 |
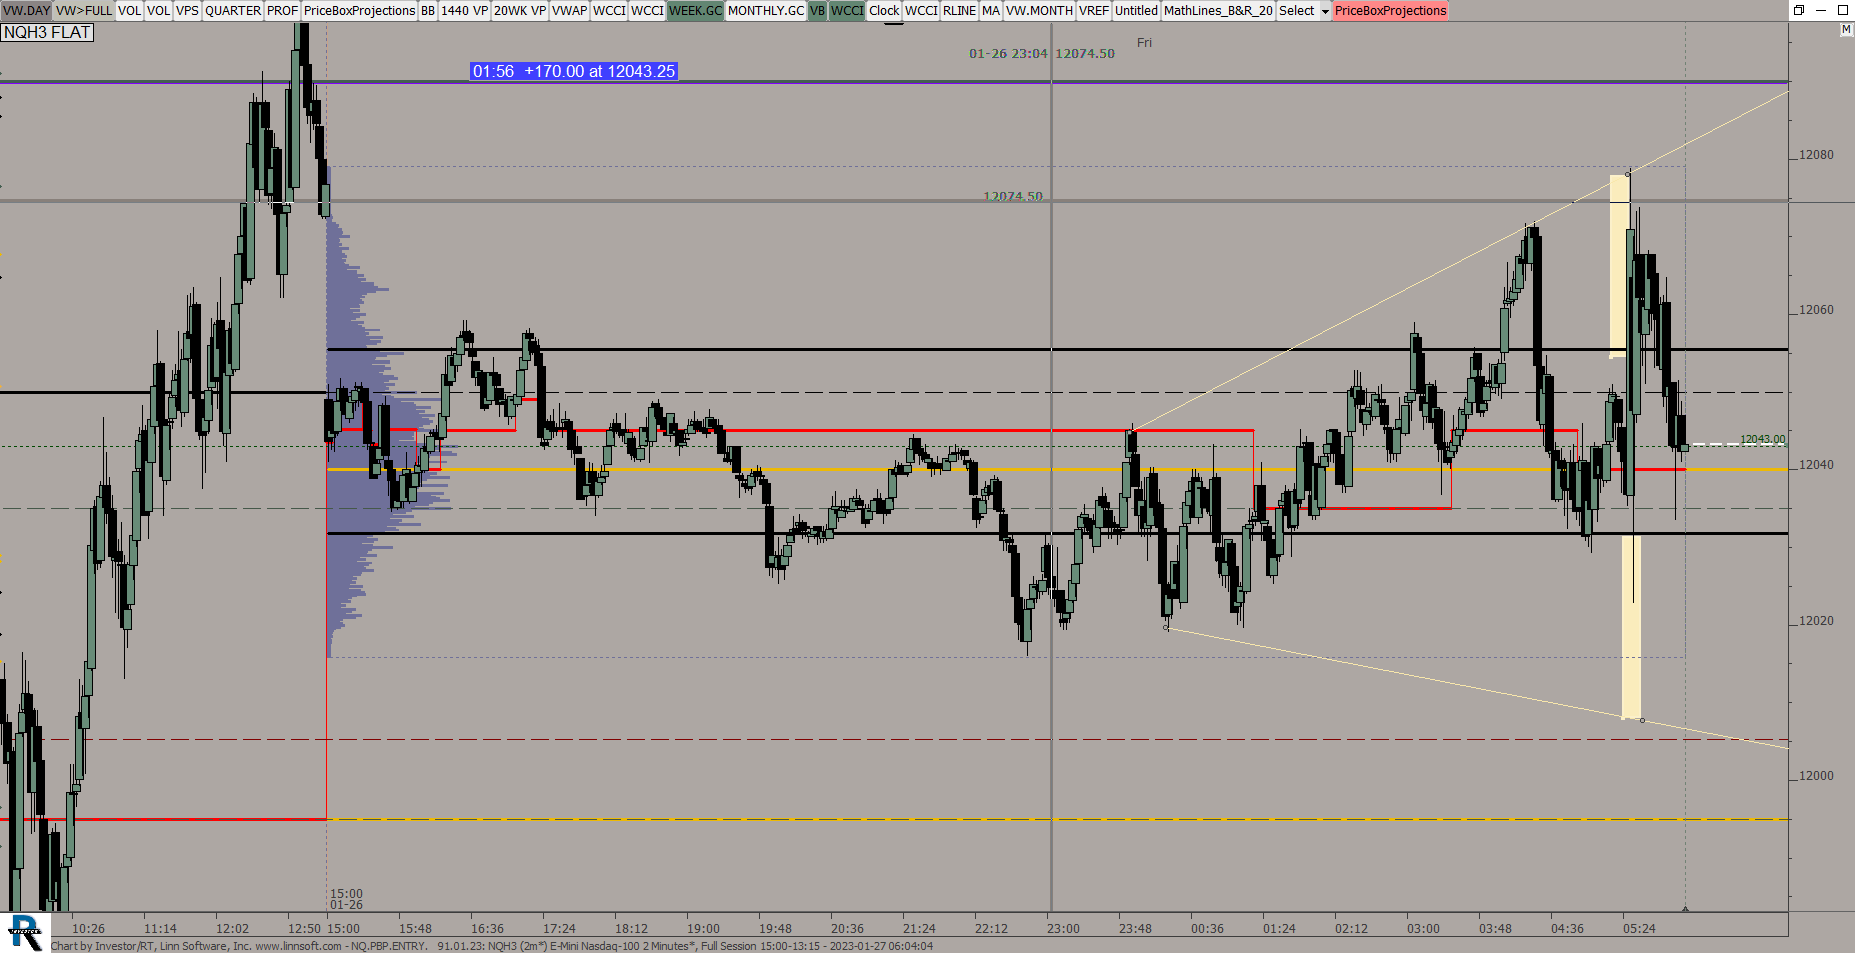
NQPBPENTRY (NQH3) ES42 [totalcount]
3 years 6 months ago
This chart was uploaded by Investor/RT 14.5.4 showing symbol: NQH3. |
View |
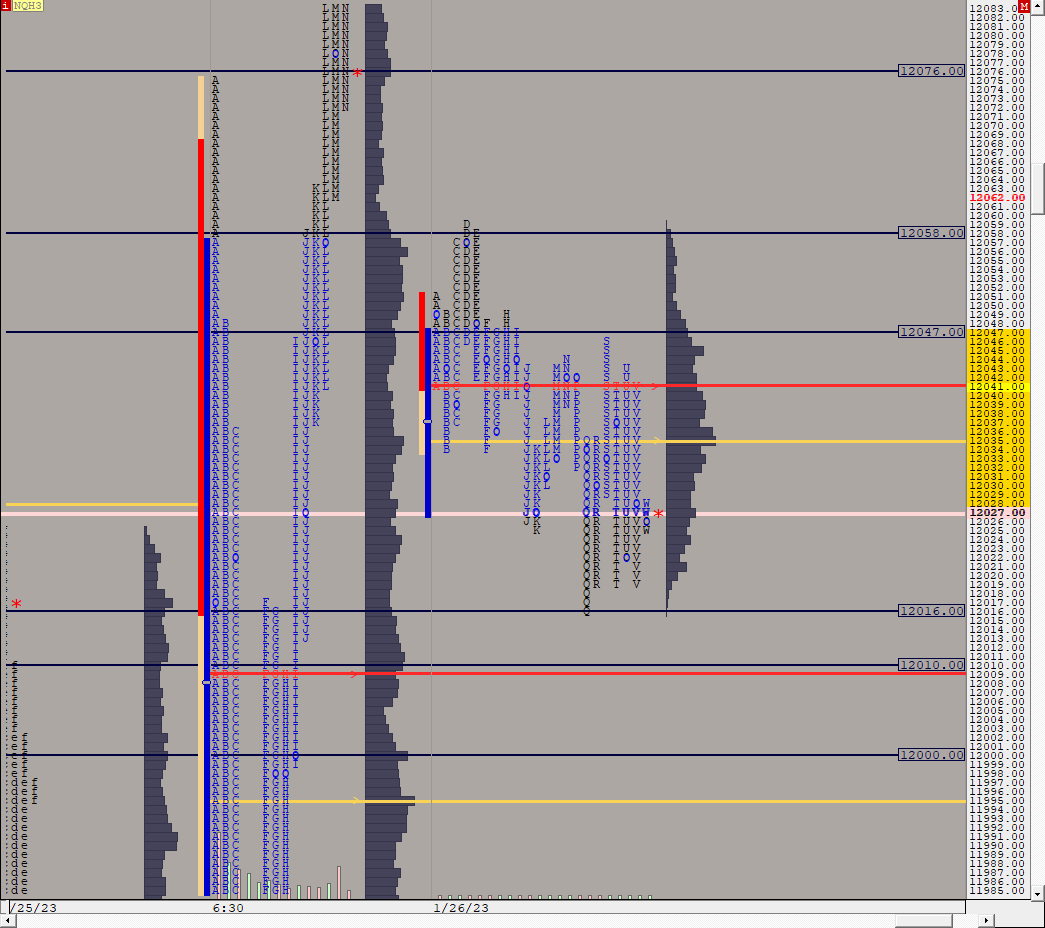 |
NQTPO DAILY (NQH3) ES42 [totalcount]
3 years 6 months ago
This chart was uploaded by Investor/RT 14.5.3 showing symbol: NQH3. |
View |
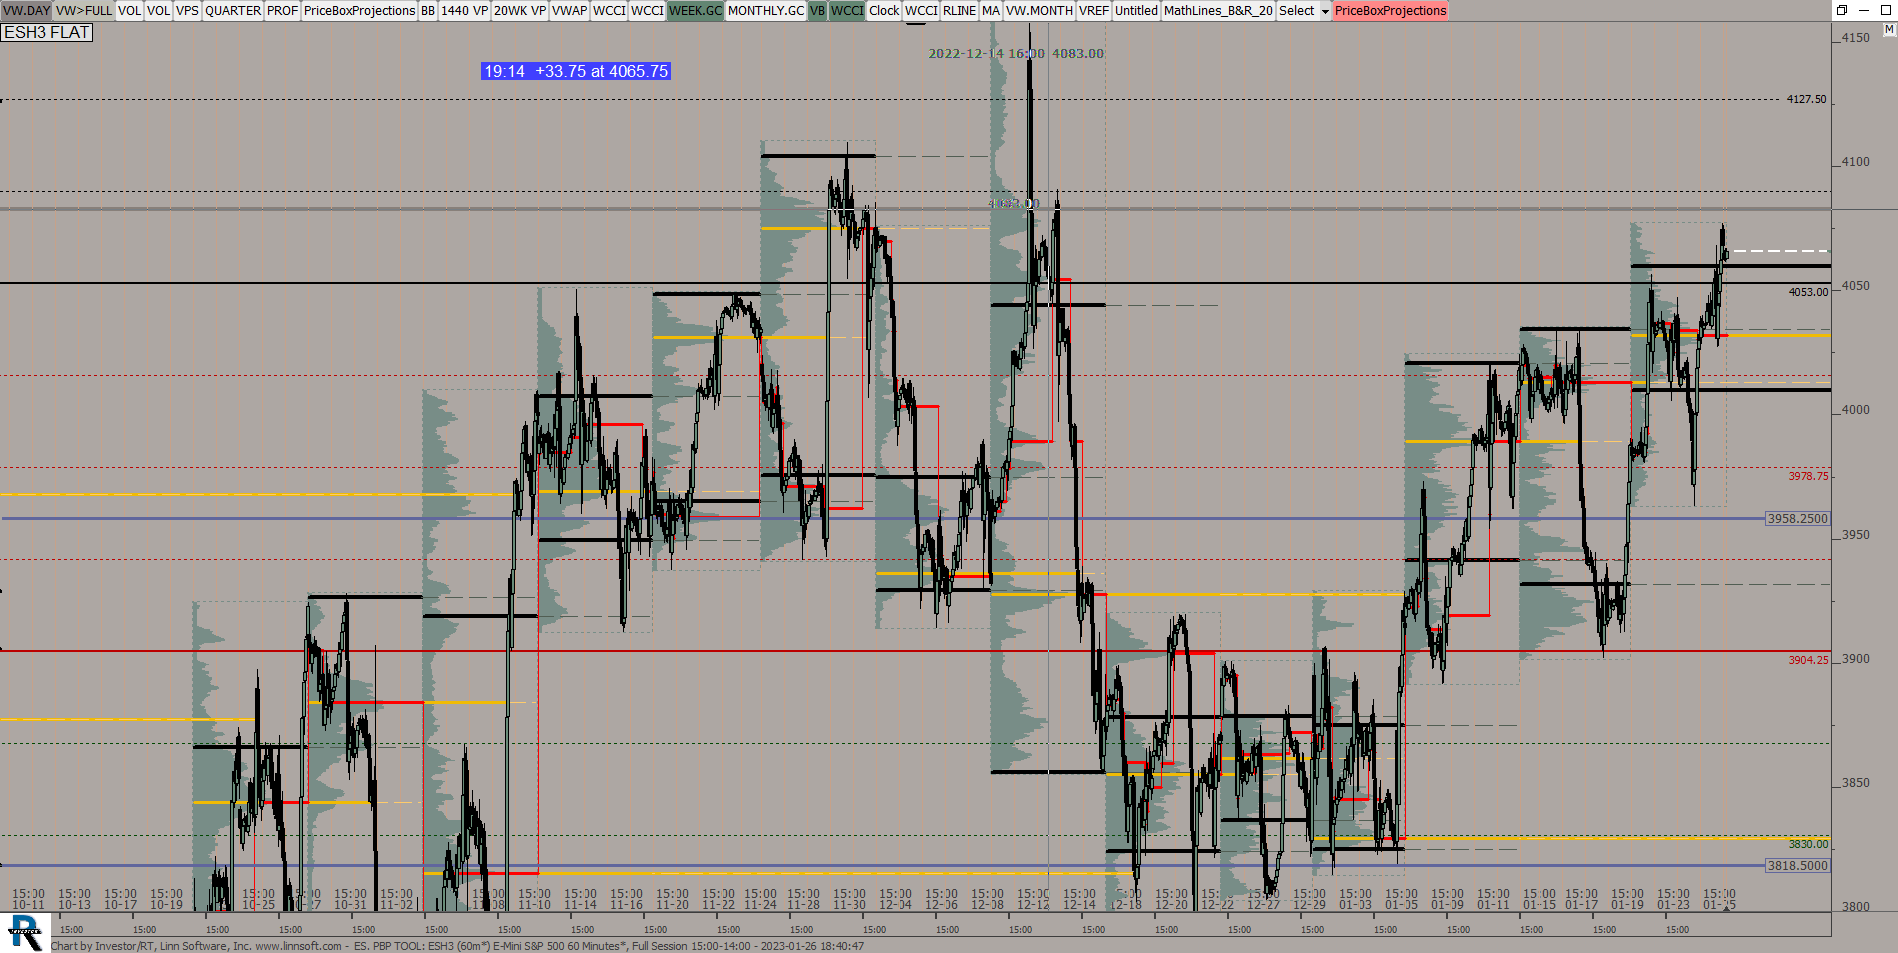 |
ES PBP TOOL (ESH3) ES42 [totalcount]
3 years 6 months ago
This chart was uploaded by Investor/RT 14.5.4 showing symbol: ESH3. |
View |
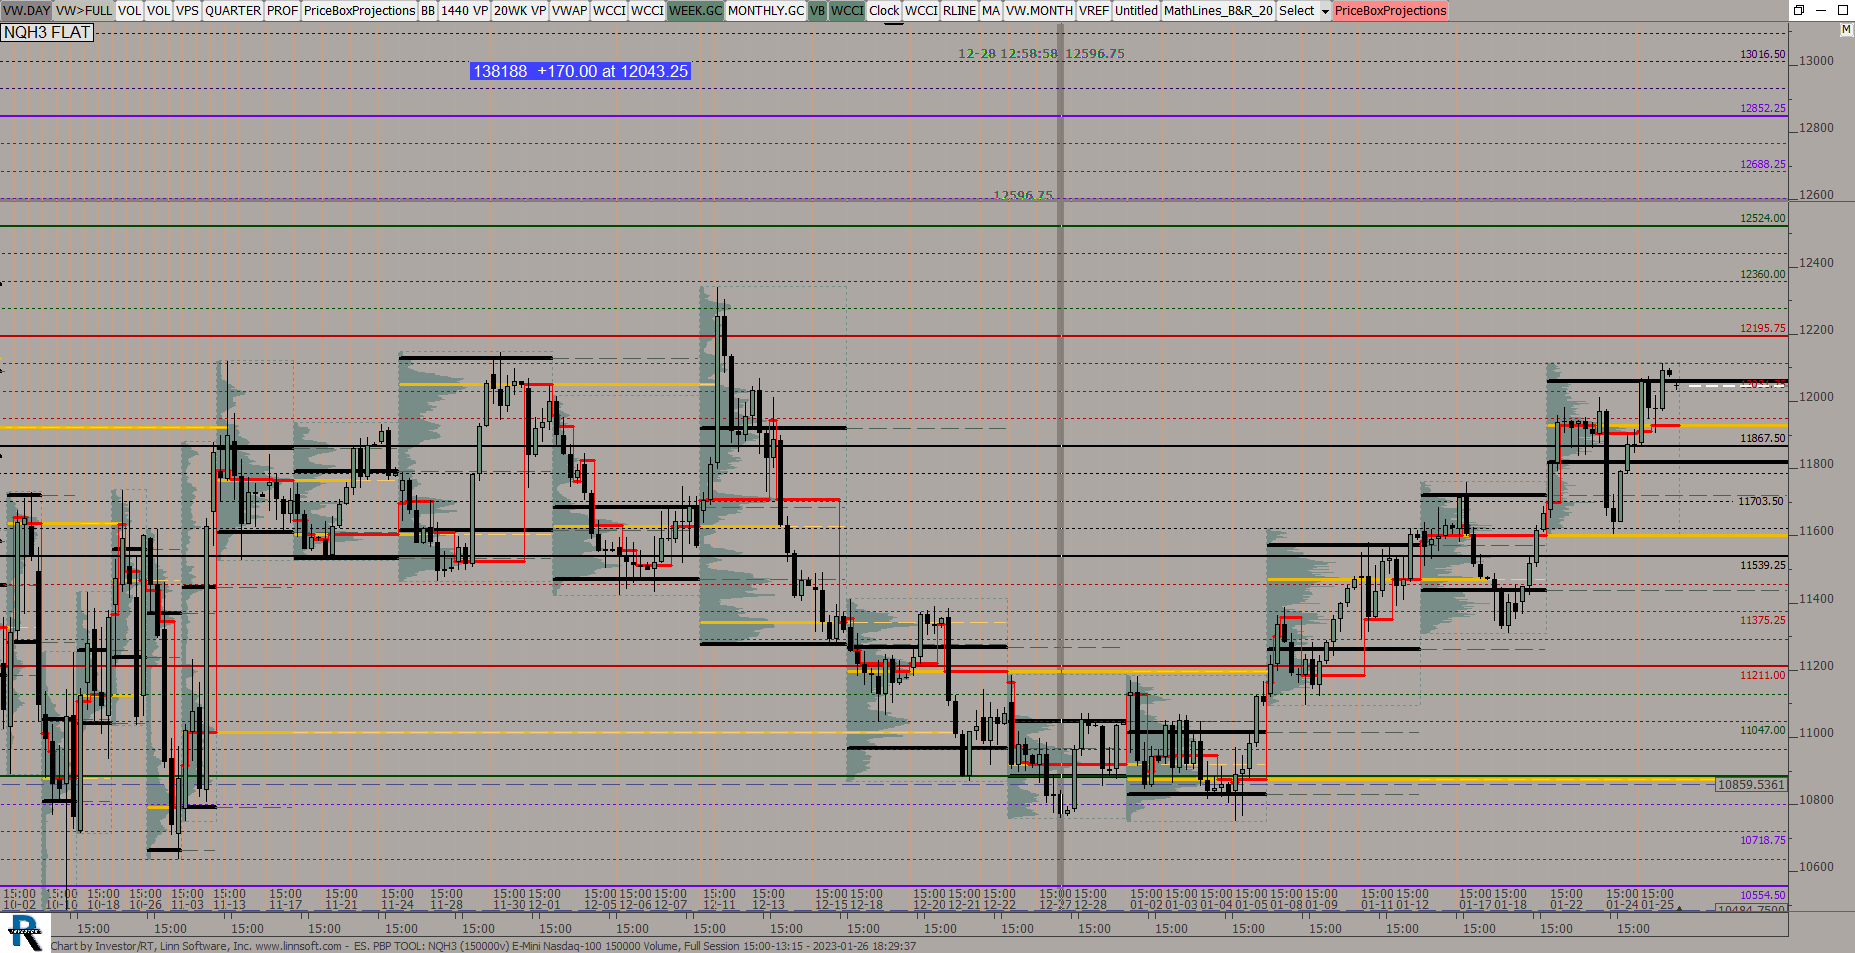 |
ES PBP TOOL (NQH3) ES42 [totalcount]
3 years 6 months ago
This chart was uploaded by Investor/RT 14.5.4 showing symbol: NQH3. |
View |
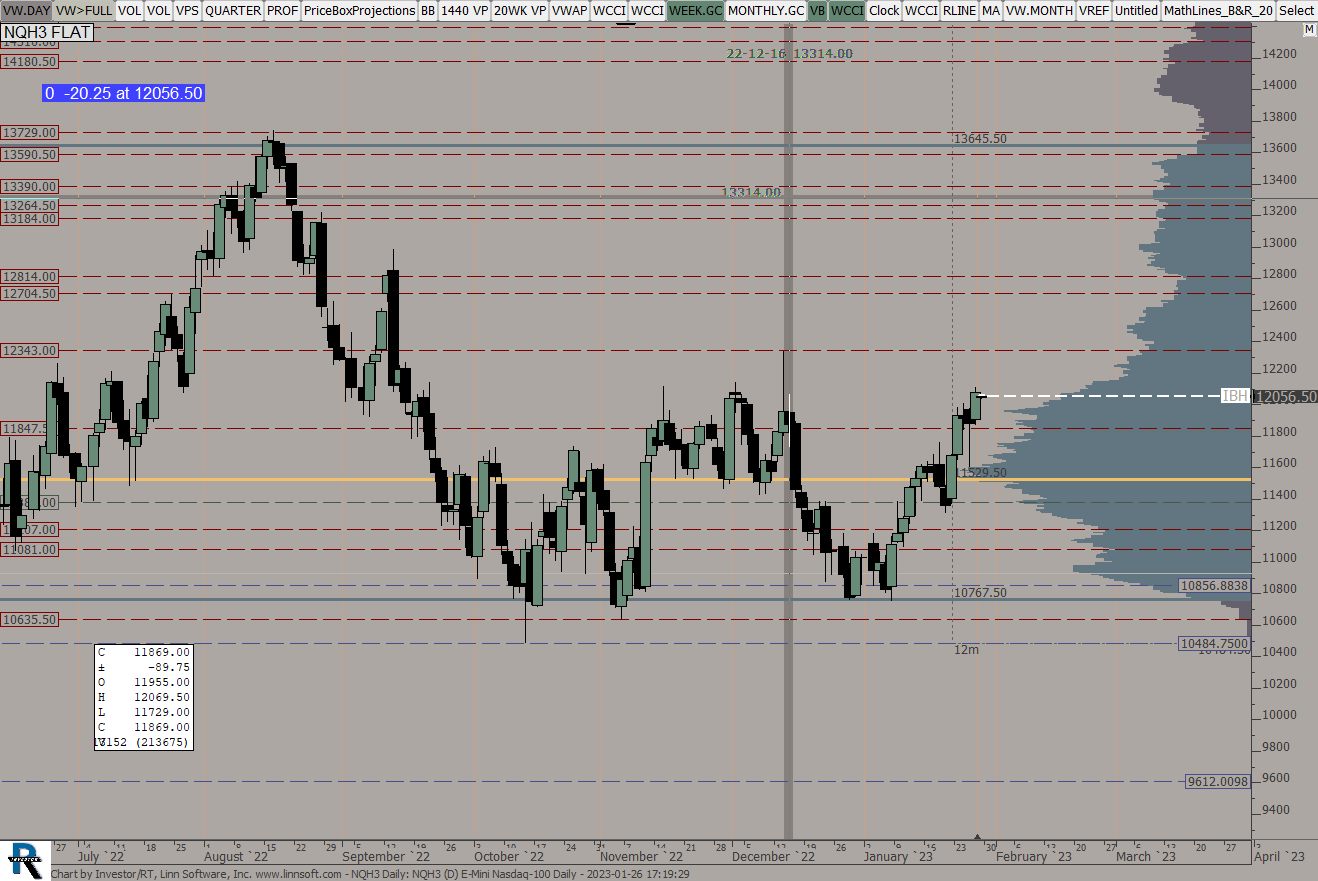 |
NQH3 Daily (NQH3) ES42 [totalcount]
3 years 6 months ago
This chart was uploaded by Investor/RT 14.5.4 showing symbol: NQH3. |
View |
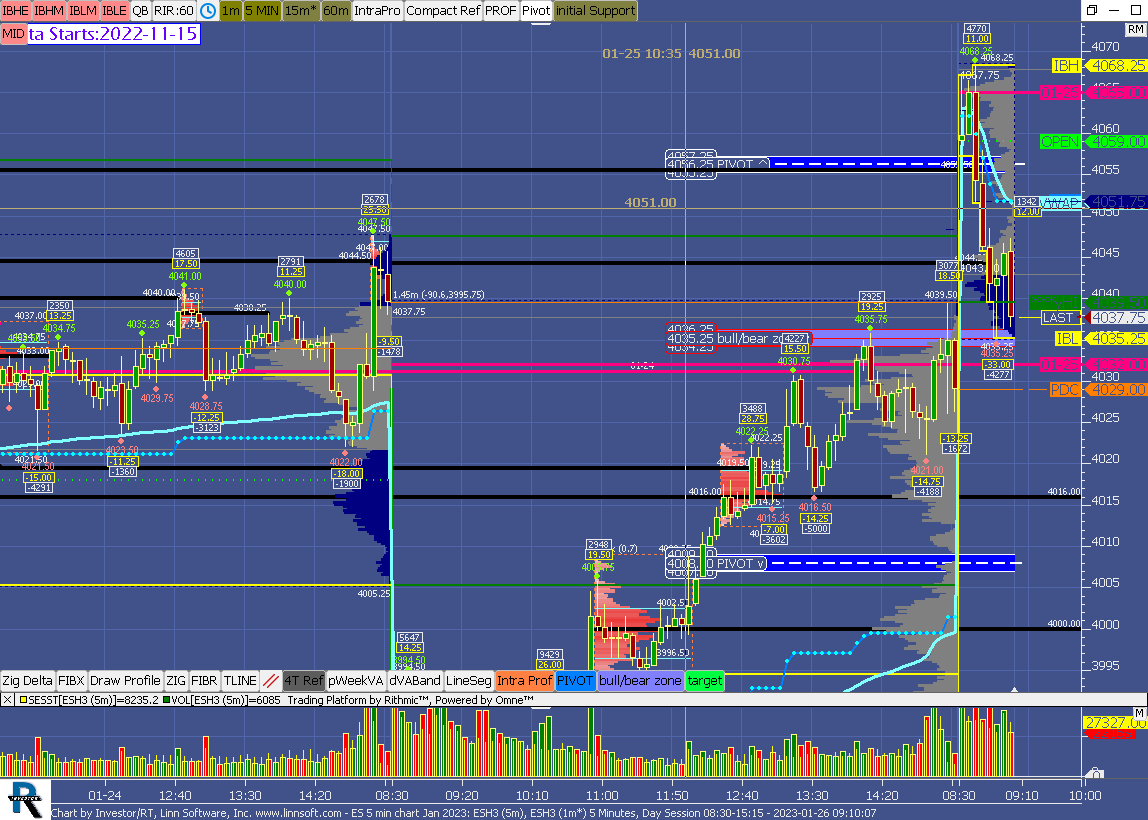 |
ES 5 min chart Jan 2023 (ESH3) donmelvin [totalcount]
3 years 6 months ago
5 minute chart. This chart was uploaded by Investor/RT 15.1.12 showing symbol: ESH3. |
View |
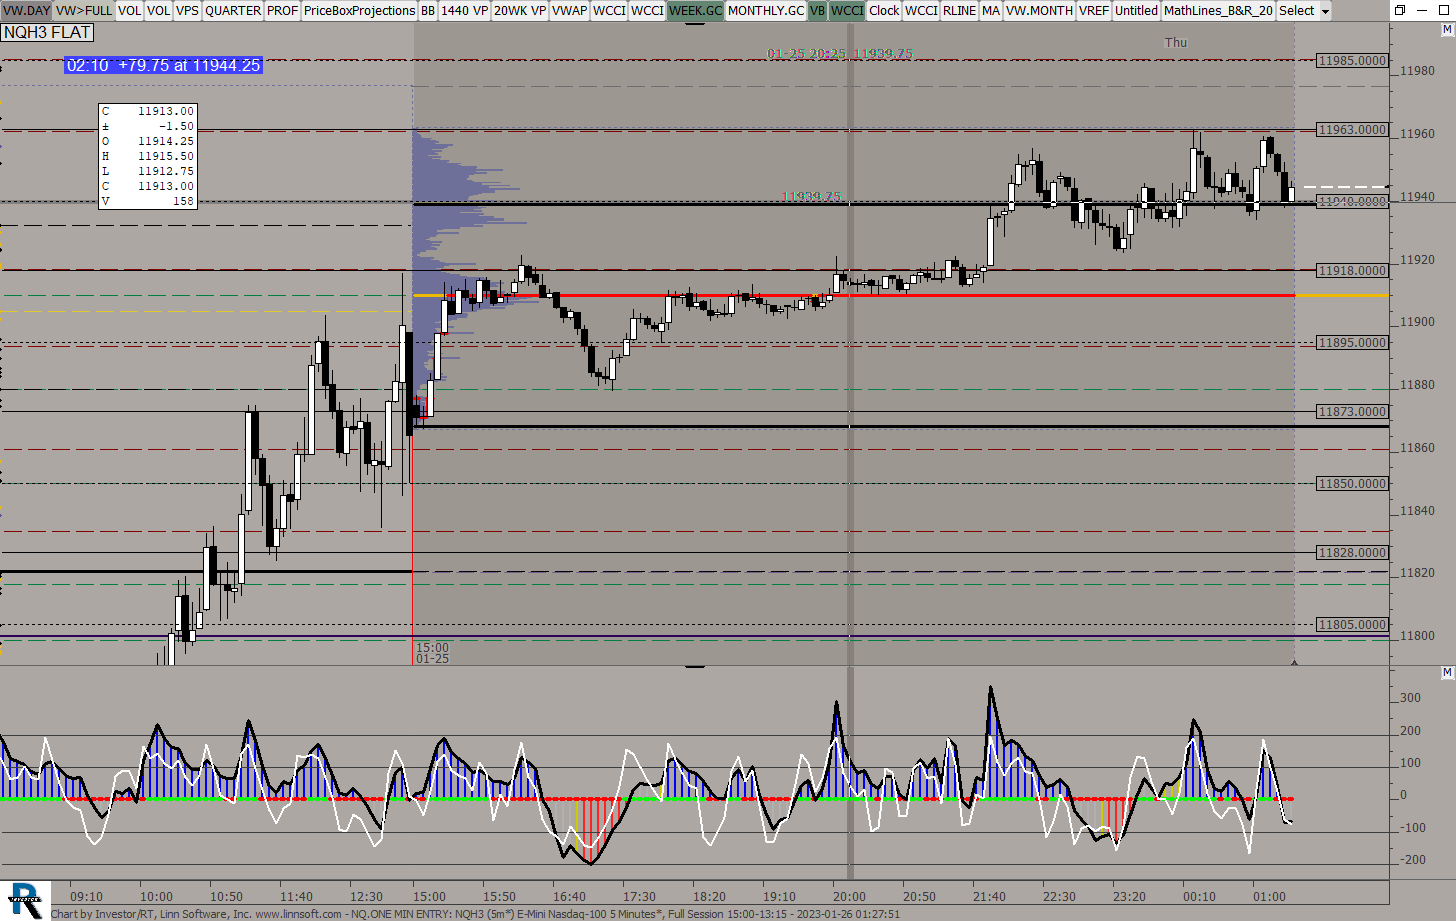 |
NQONE MIN ENTRY (NQH3) ES42 [totalcount]
3 years 6 months ago
This chart was uploaded by Investor/RT 14.5.4 showing symbol: NQH3. |
View |
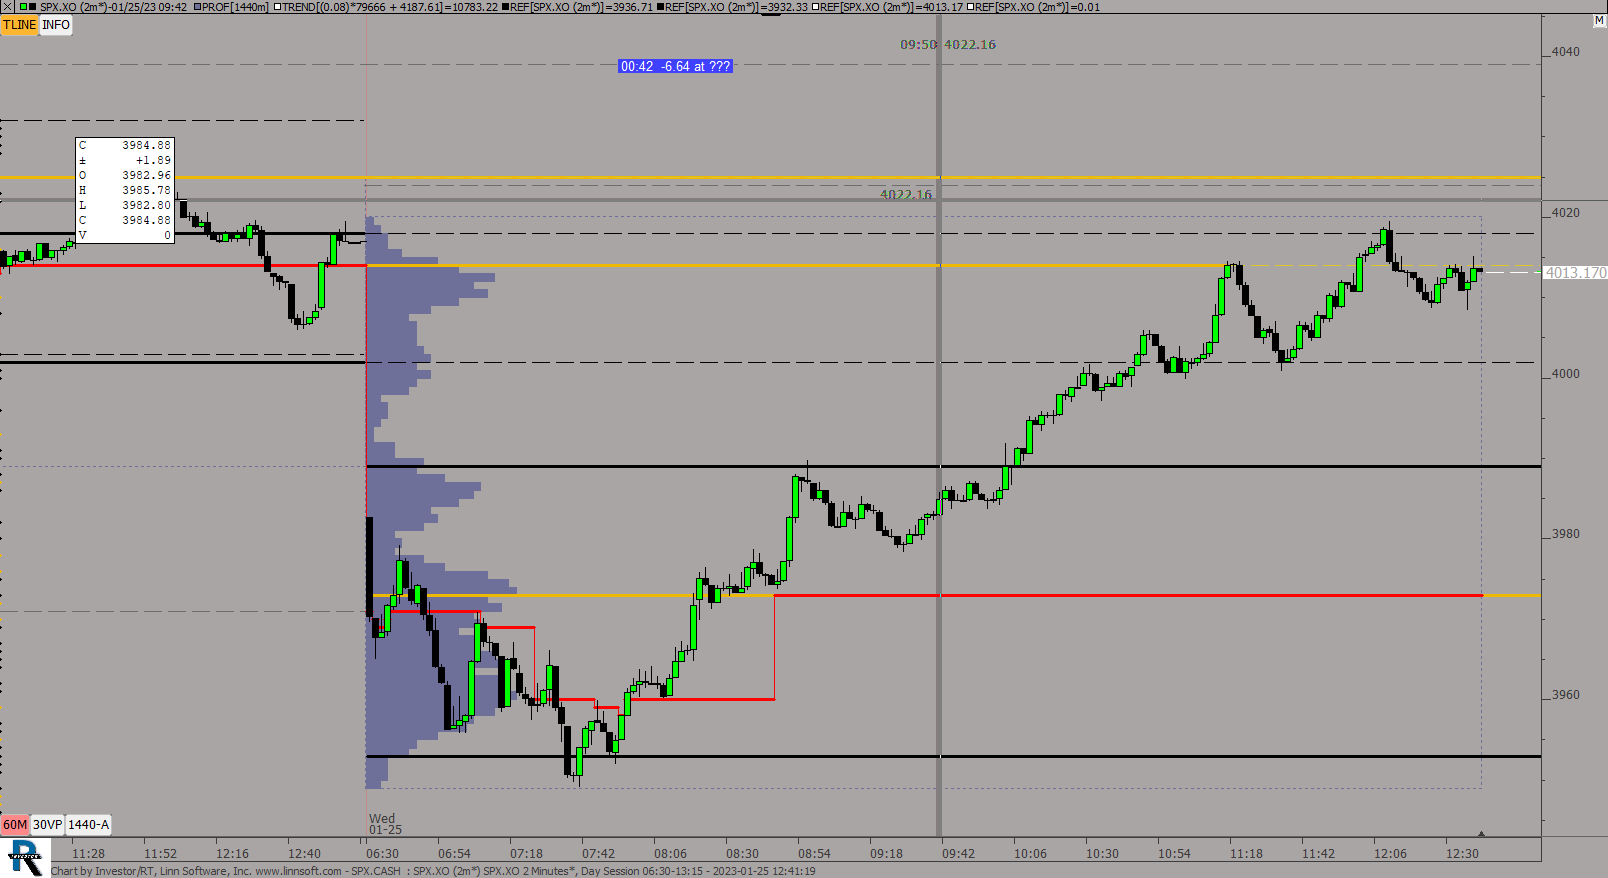 |
SPXCASH (SPX.XO) ES42 [totalcount]
3 years 6 months ago
This chart was uploaded by Investor/RT 14.2.7 showing symbol: SPX.XO. |
View |
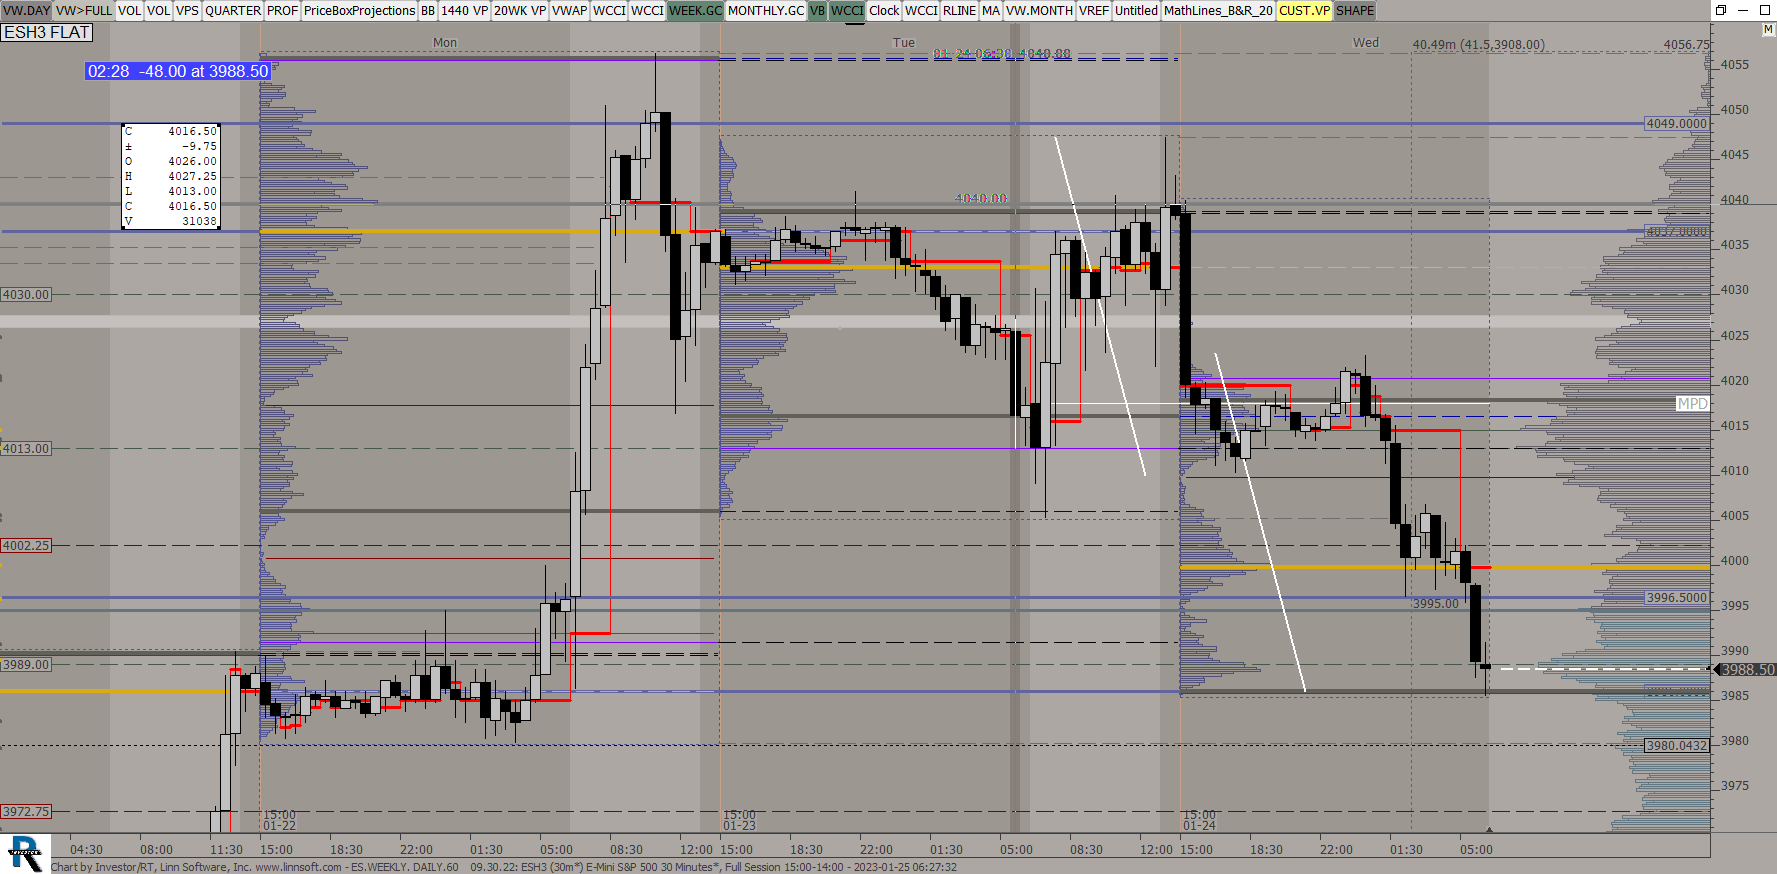 |
ESWEEKLY DAILY60 (ESH3) ES42 [totalcount]
3 years 6 months ago
This chart was uploaded by Investor/RT 14.5.4 showing symbol: ESH3. |
View |
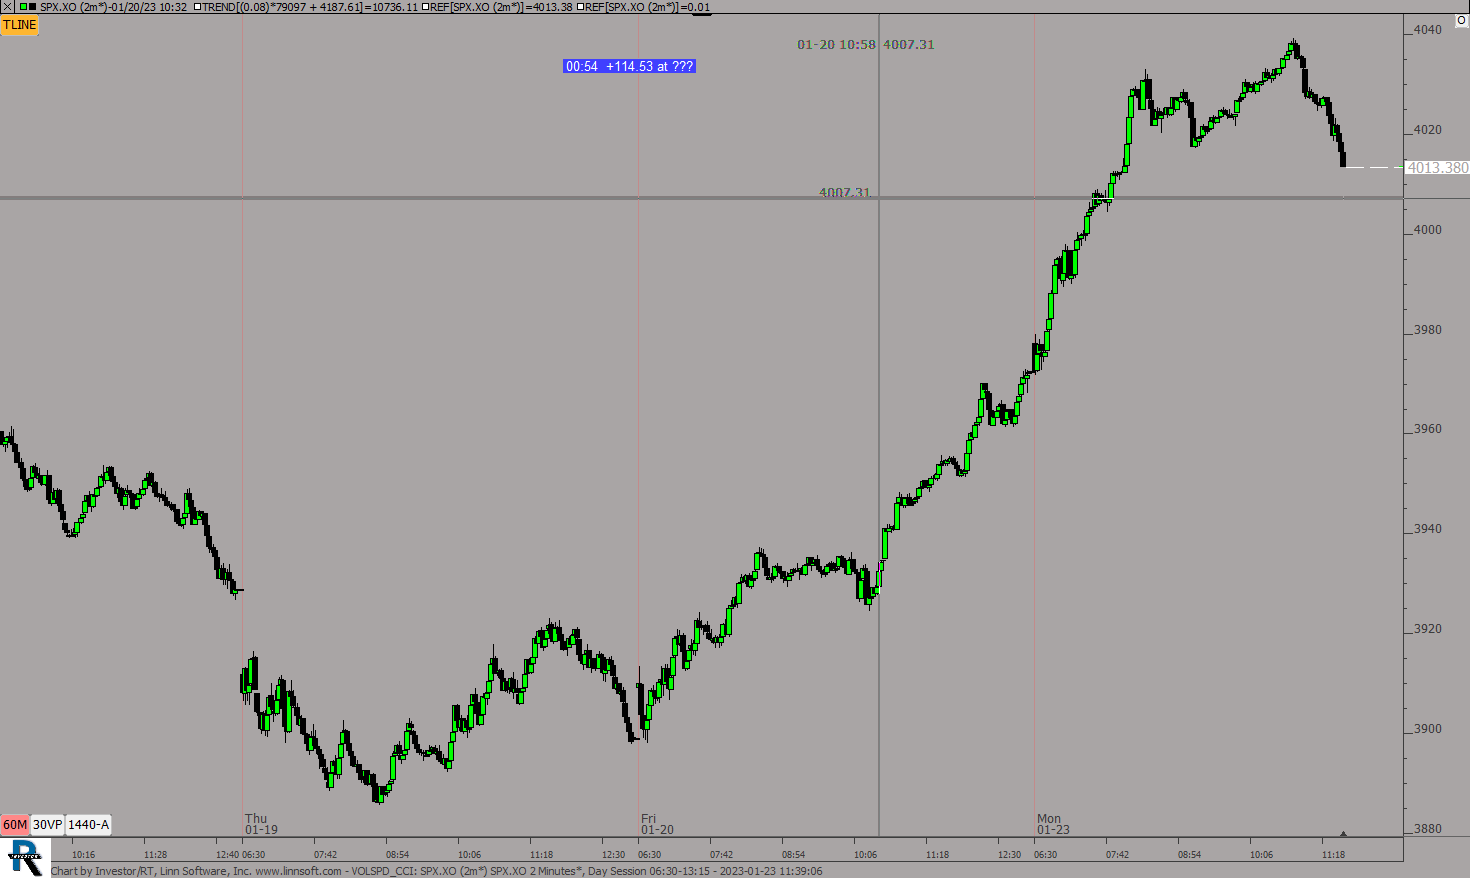 |
VOLSPD CCI (SPX.XO) ES42 [totalcount]
3 years 6 months ago
This chart was uploaded by Investor/RT 14.5.3 showing symbol: SPX.XO. |
View |
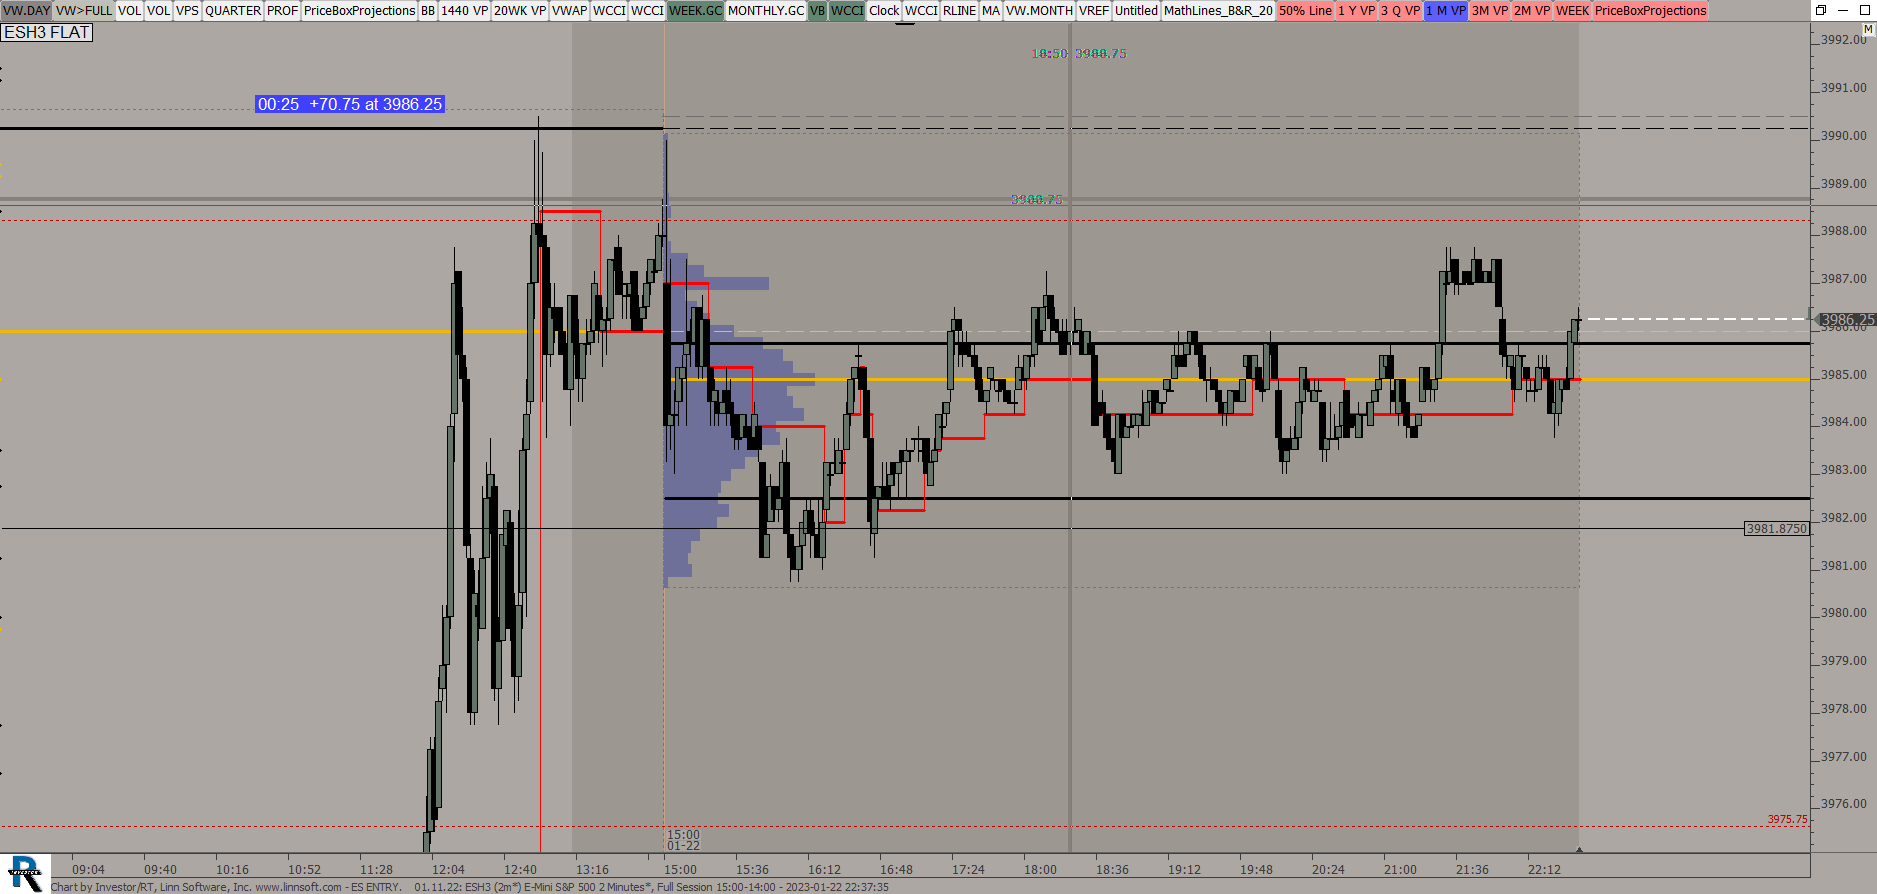 |
ES ENTRY (ESH3) ES42 [totalcount]
3 years 6 months ago
This chart was uploaded by Investor/RT 14.5.4 showing symbol: ESH3. |
View |
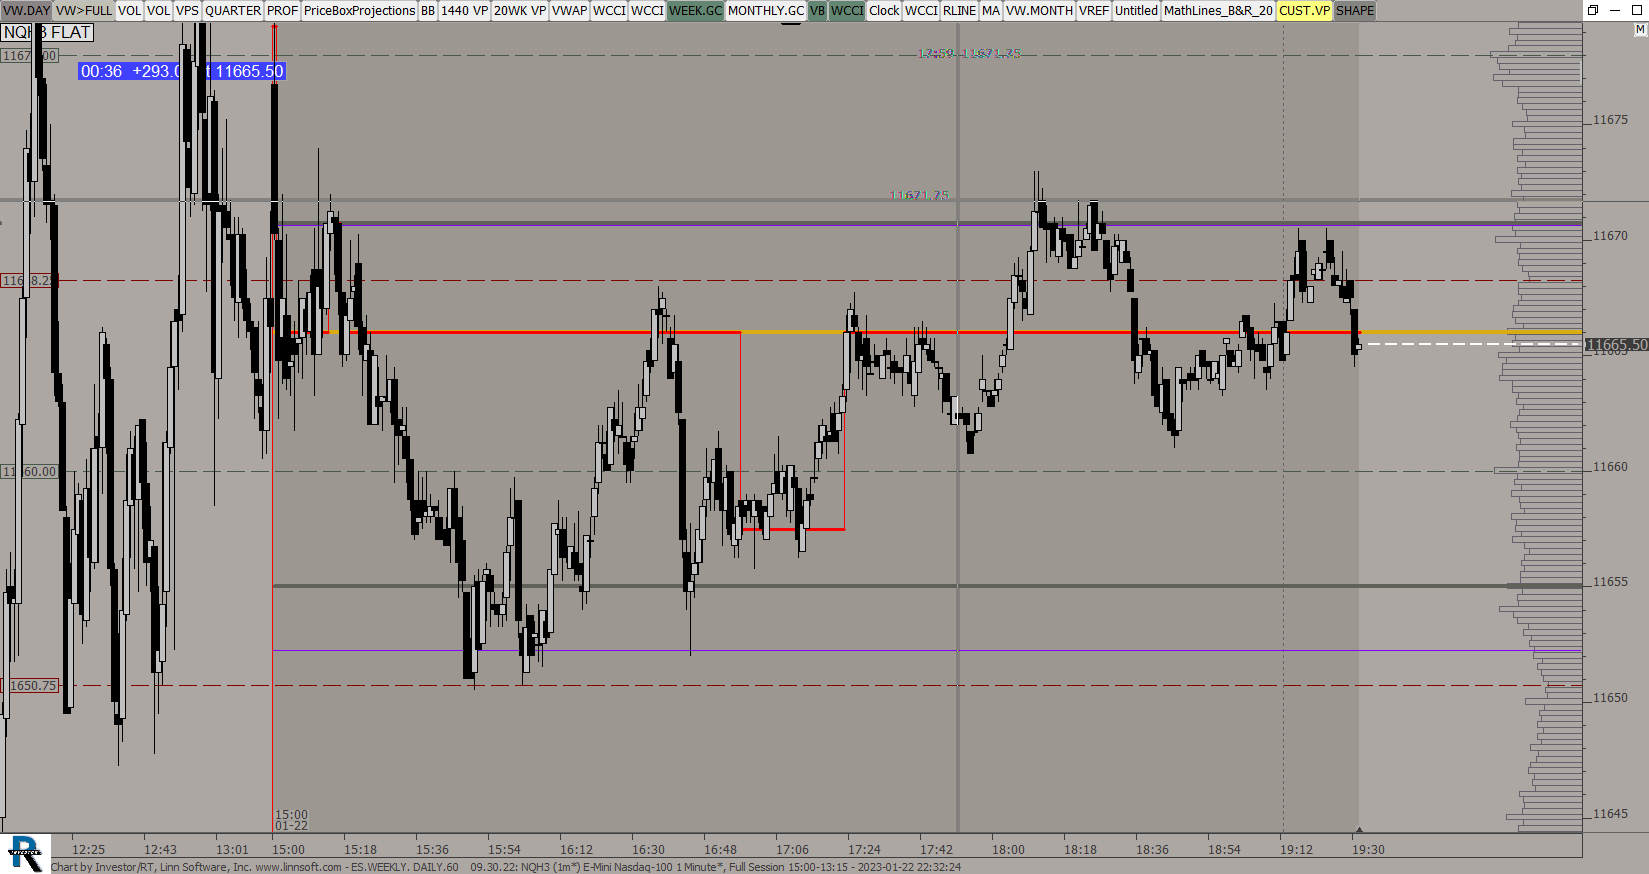 |
ESWEEKLY DAILY60 (NQH3) ES42 [totalcount]
3 years 6 months ago
This chart was uploaded by Investor/RT 14.5.4 showing symbol: NQH3. |
View |
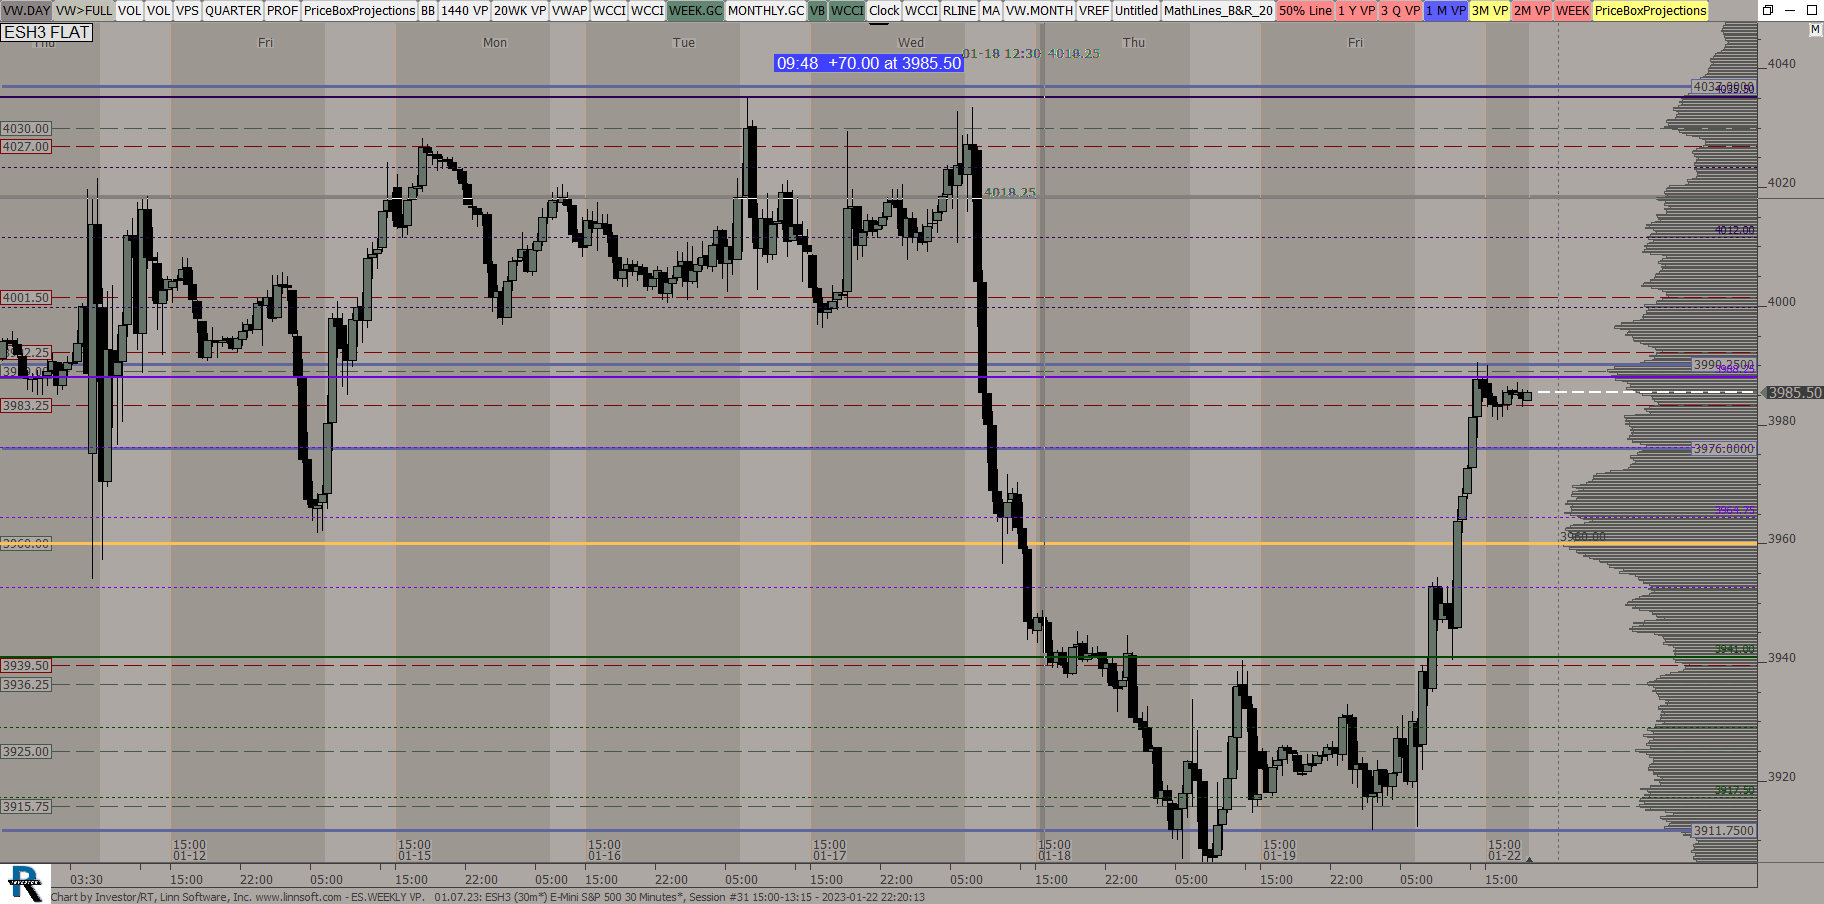 |
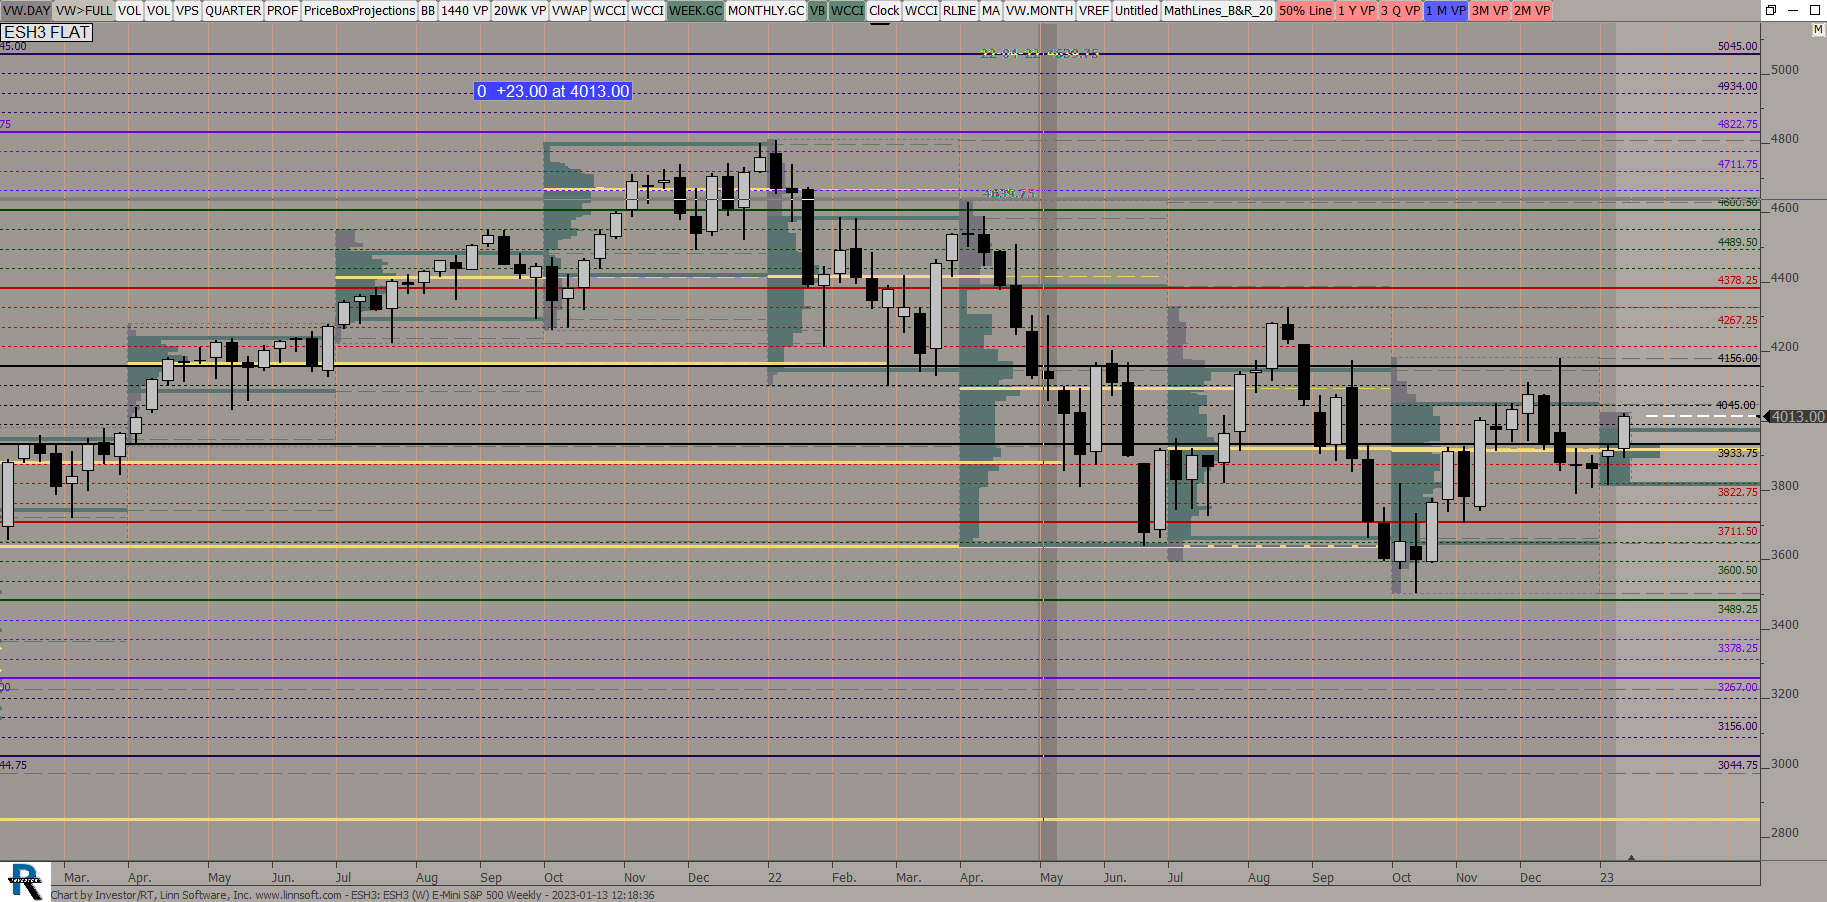
ESWEEKLY VP (ESH3) ES42 [totalcount]
3 years 6 months ago
This chart was uploaded by Investor/RT 14.5.4 showing symbol: ESH3. |
View |
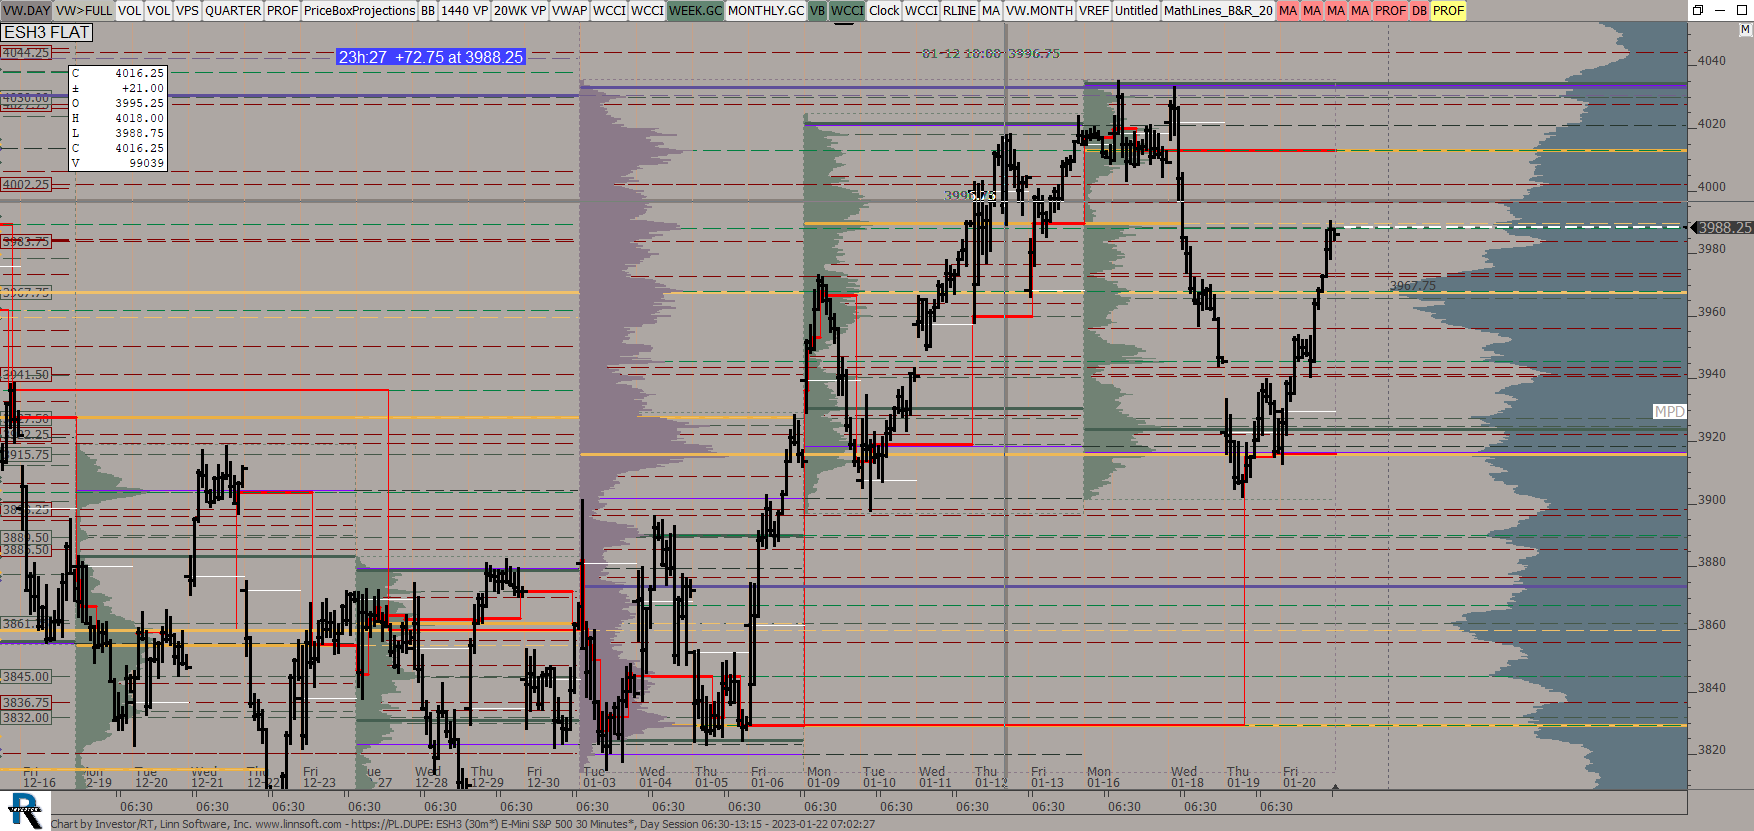 |
https PLDUPE (ESH3) ES42 [totalcount]
3 years 6 months ago
This chart was uploaded by Investor/RT 14.5.4 showing symbol: ESH3. |
View |
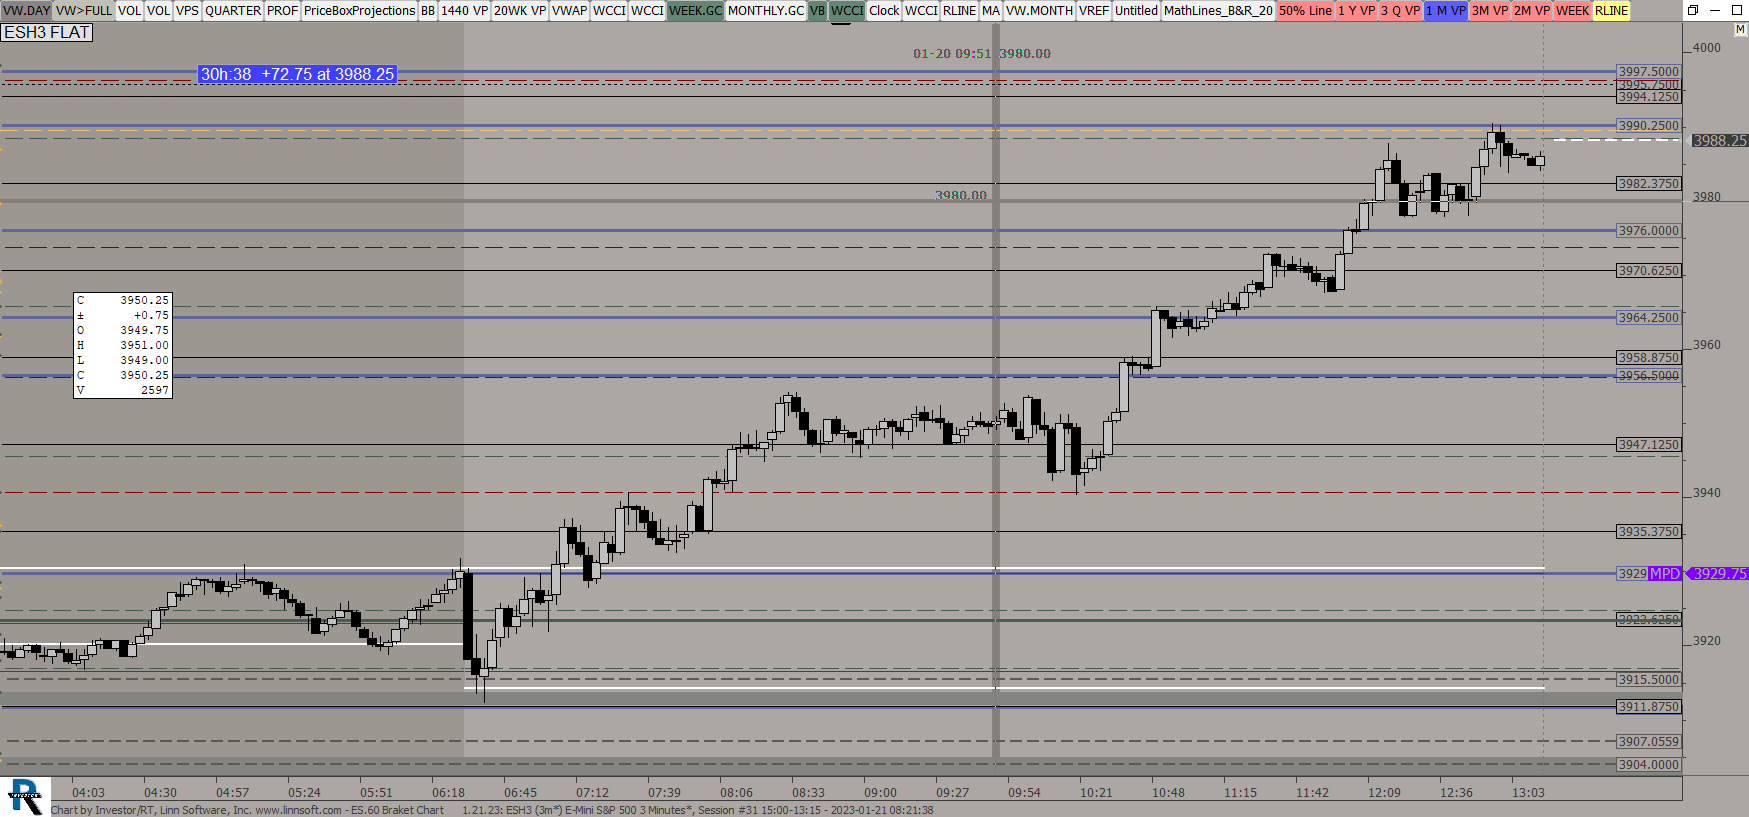 |
ES60 Braket Chart (ESH3) ES42 [totalcount]
3 years 6 months ago
This chart was uploaded by Investor/RT 14.5.4 showing symbol: ESH3. |
View |
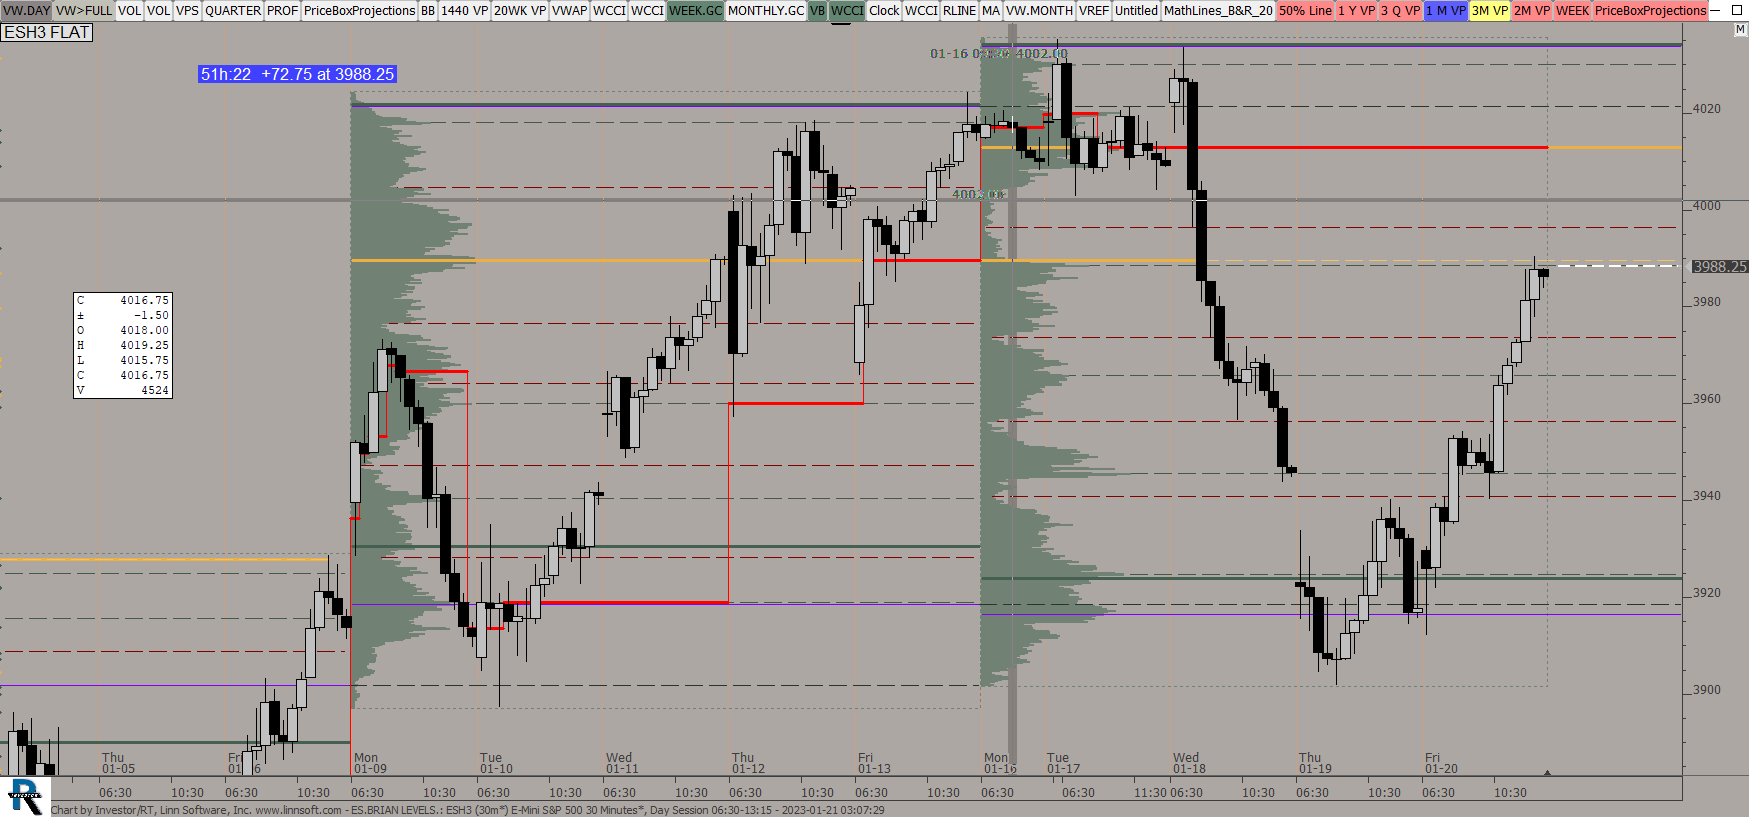 |
ESBRIAN LEVELS (ESH3) ES42 [totalcount]
3 years 6 months ago
This chart was uploaded by Investor/RT 14.5.4 showing symbol: ESH3. |
View |
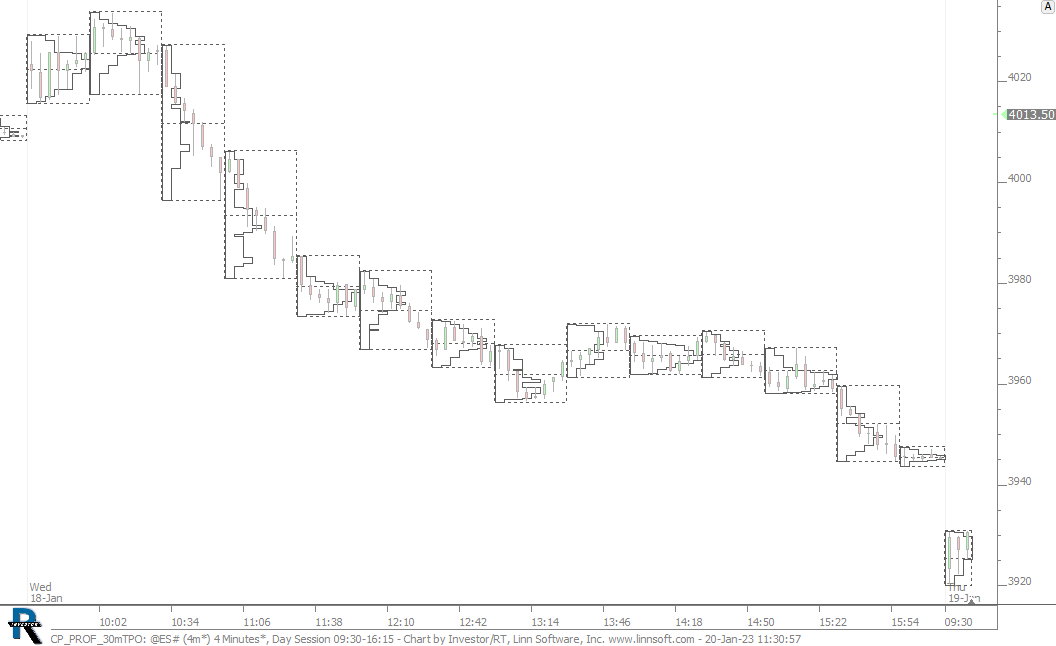 |
CP PROF 30mTPO (@ES#) cpayne [totalcount]
3 years 6 months ago
This chart was uploaded by Investor/RT 15.1.12 showing symbol: @ES#. |
View |
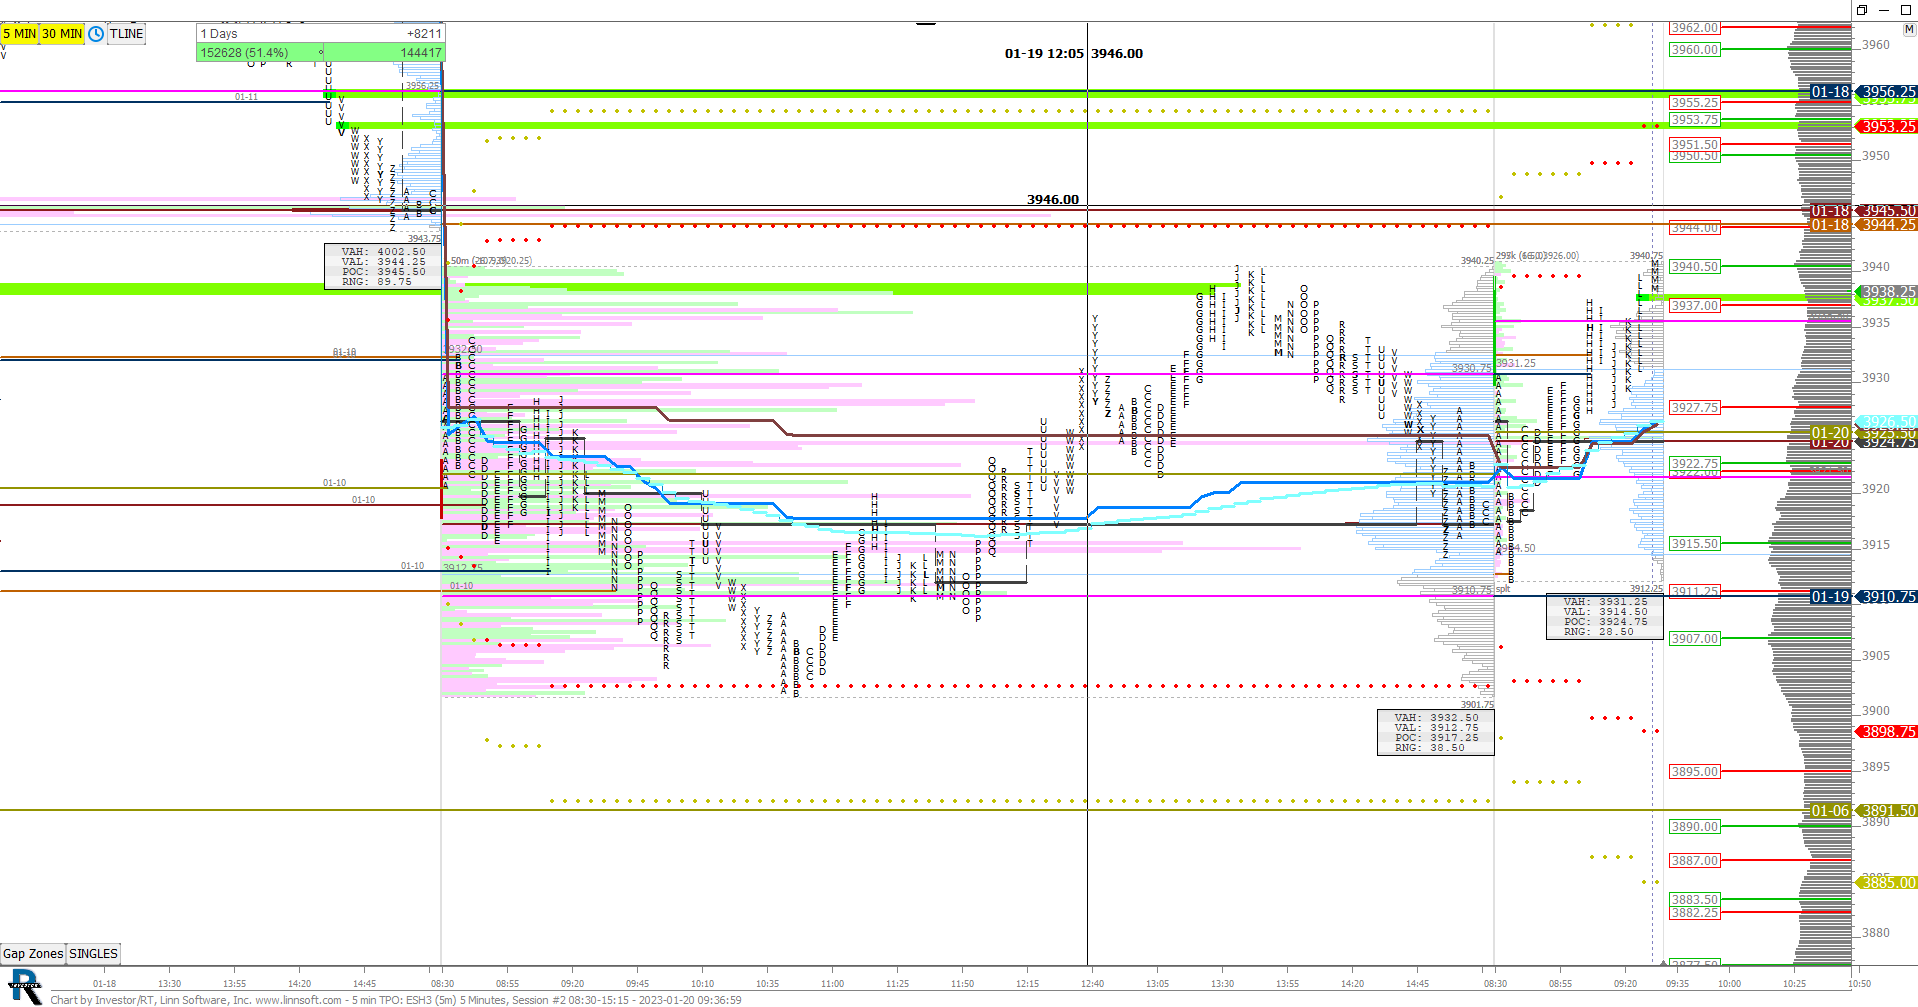 |
5 min TPO (ESH3) scottz46 [totalcount]
3 years 6 months ago
This chart was uploaded by Investor/RT 14.5.4 showing symbol: ESH3. |
View |
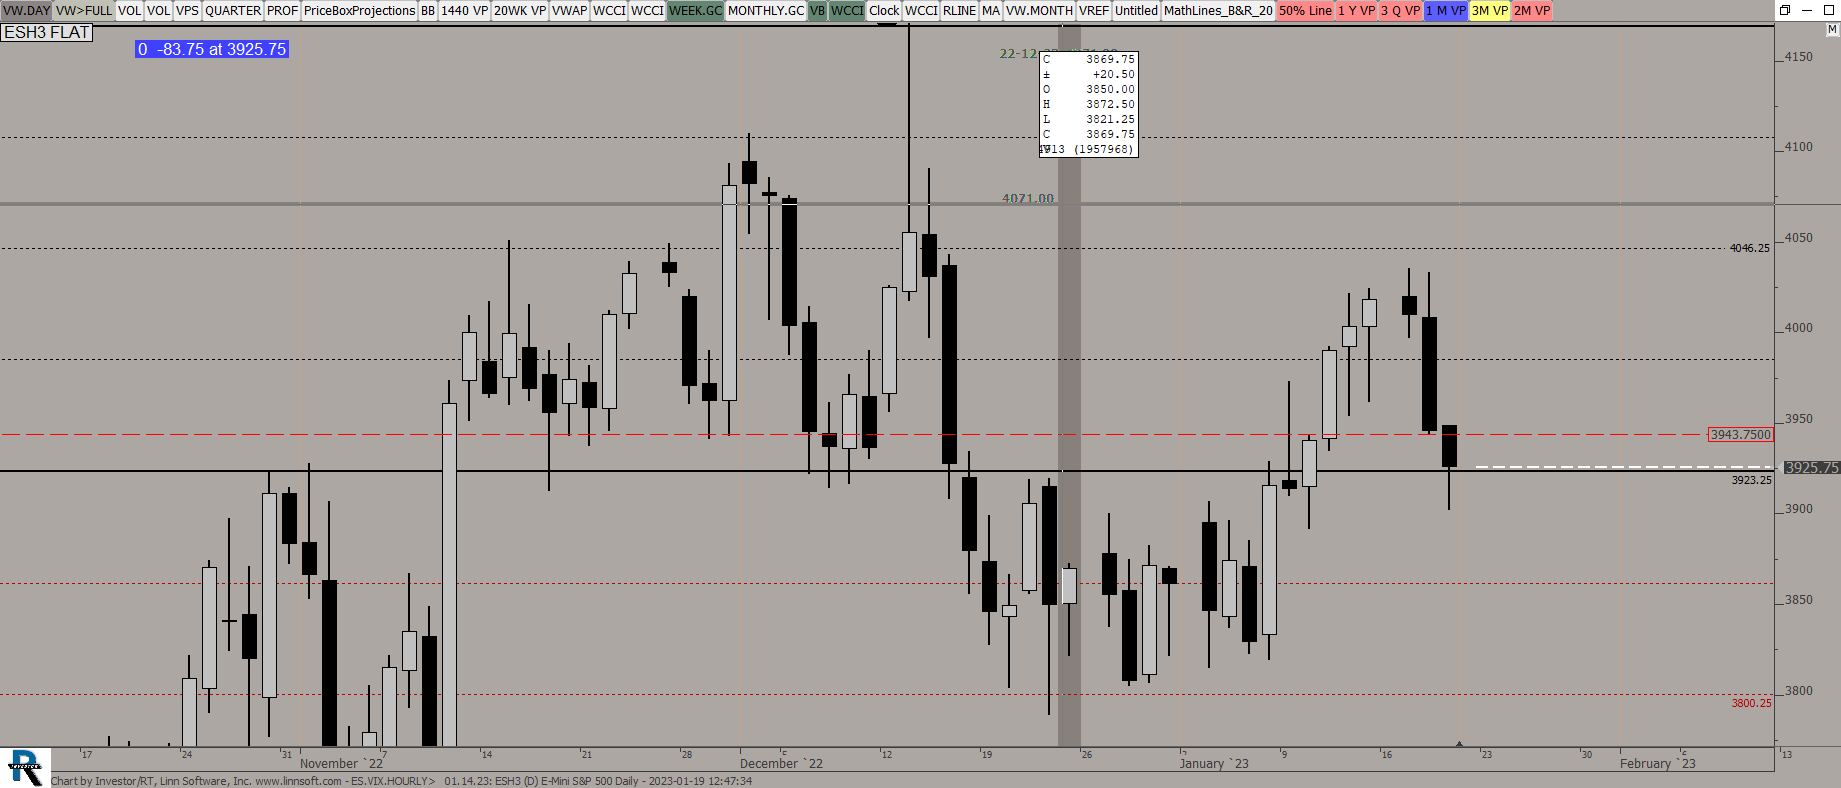 |
ESVIXHOURLY (ESH3) ES42 [totalcount]
3 years 6 months ago
This chart was uploaded by Investor/RT 14.5.4 showing symbol: ESH3. |
View |
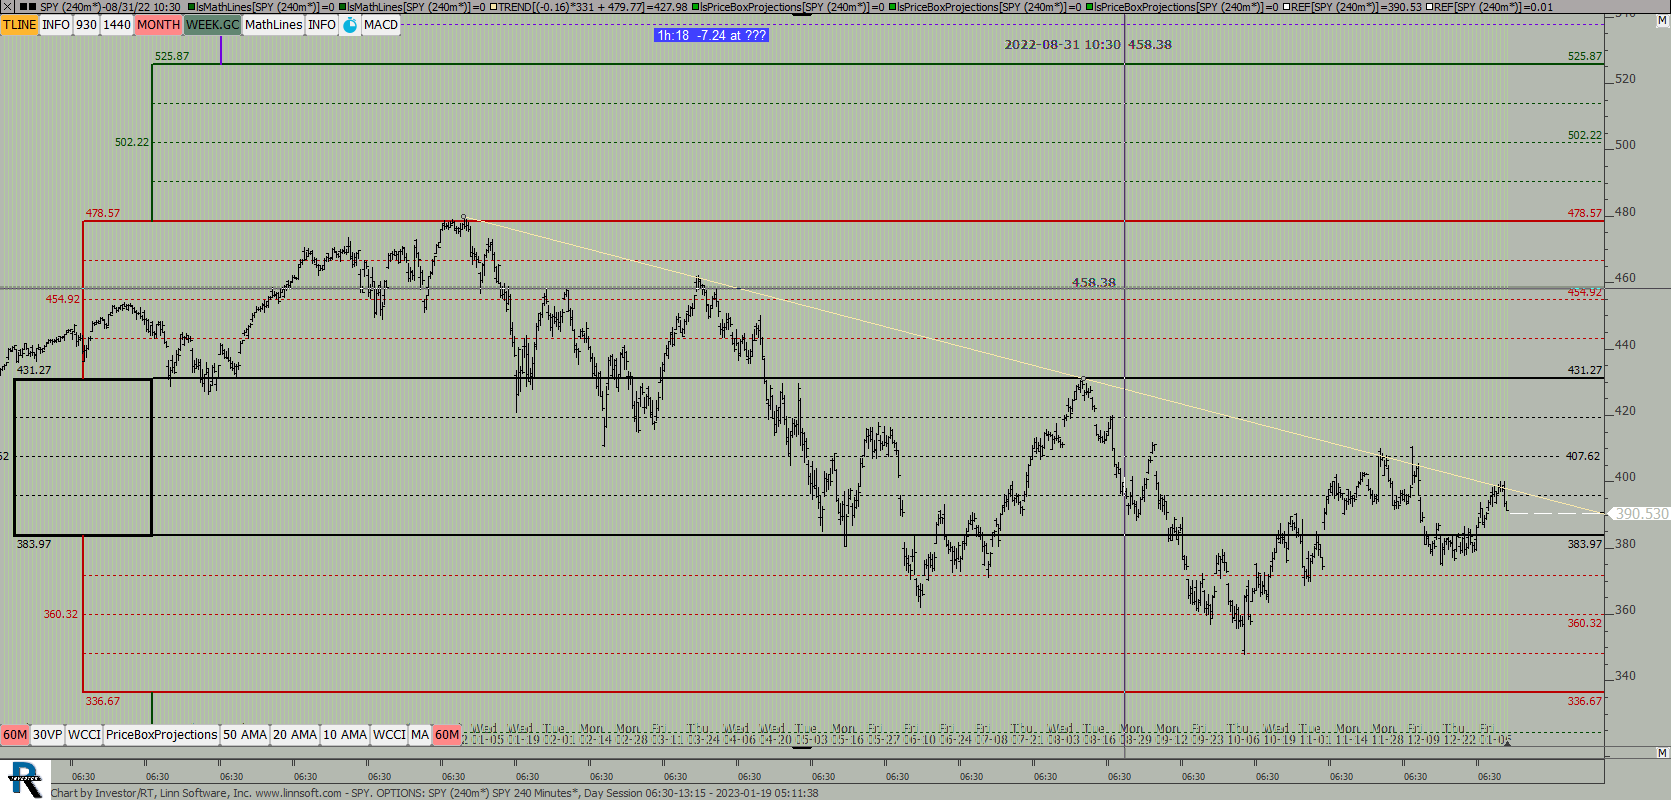 |
SPY OPTIONS (SPY) ES42 [totalcount]
3 years 6 months ago
This chart was uploaded by Investor/RT 14.5.4 showing symbol: SPY. |
View |
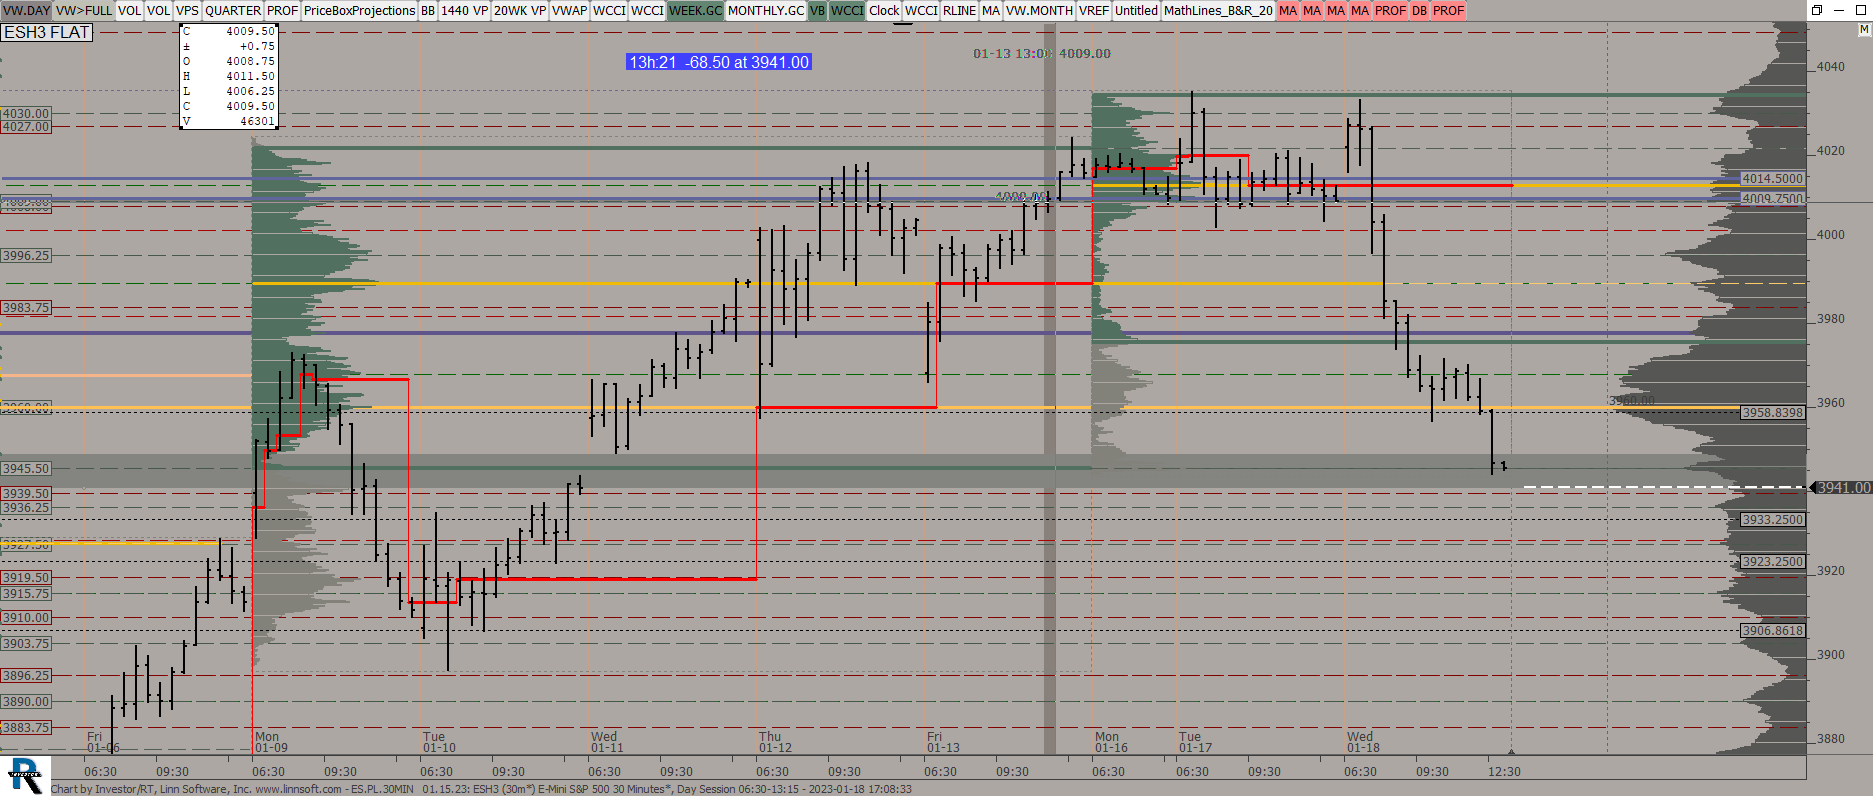 |
ESPL30MIN (ESH3) ES42 [totalcount]
3 years 6 months ago
This chart was uploaded by Investor/RT 14.5.4 showing symbol: ESH3. |
View |
 |
ESH (ESH3) ES42 [totalcount]
3 years 6 months ago
This chart was uploaded by Investor/RT 14.5.4 showing symbol: ESH3. |
View |
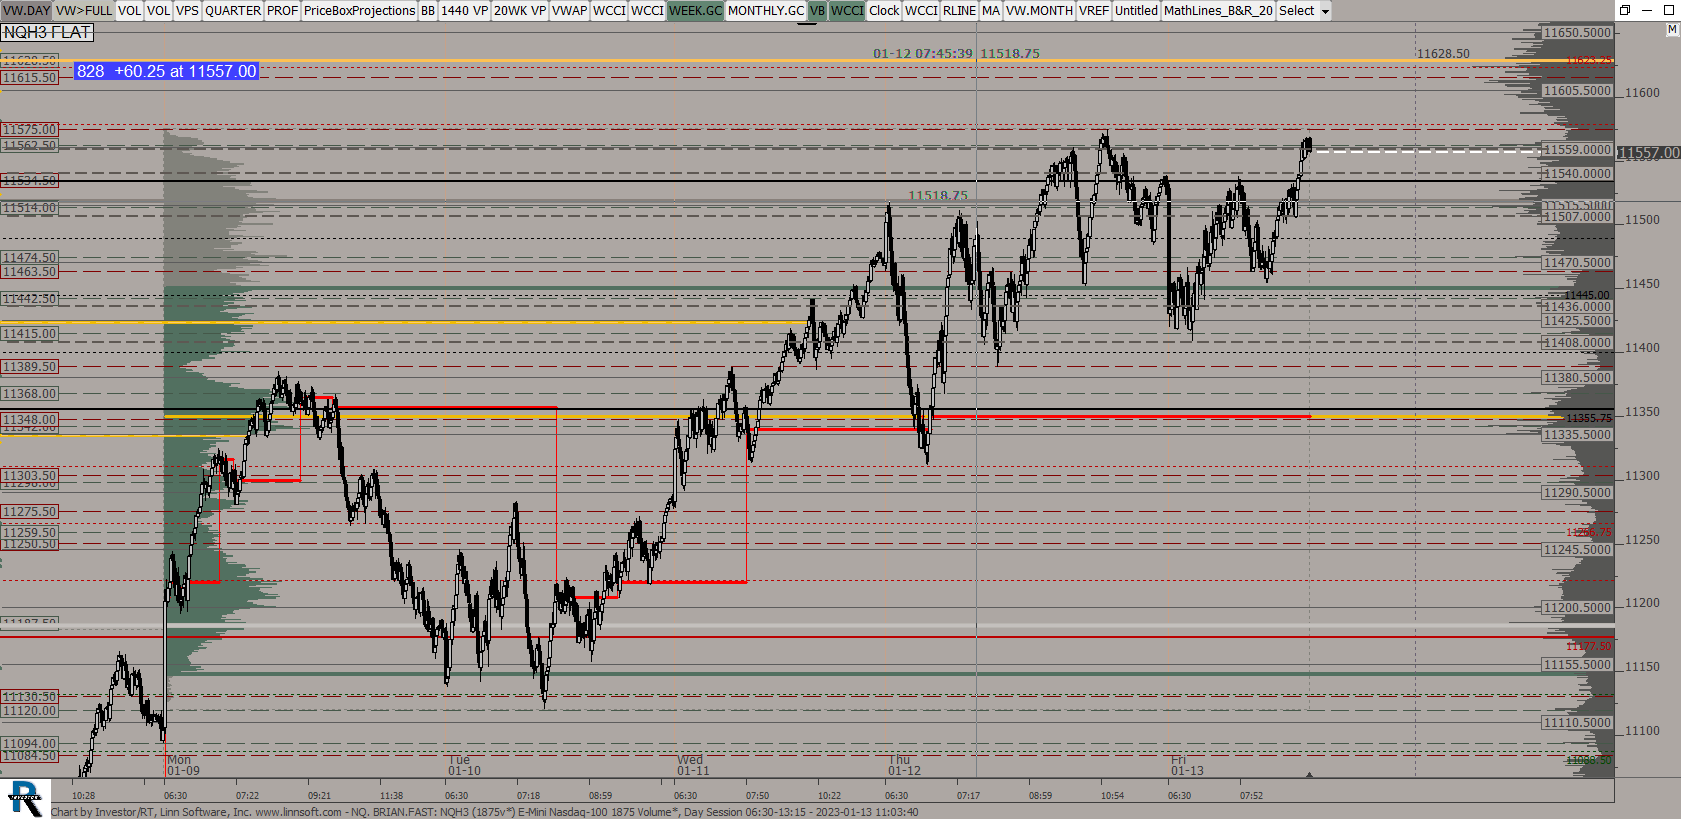 |
NQ BRIANFAST (NQH3) ES42 [totalcount]
3 years 6 months ago
This chart was uploaded by Investor/RT 14.5.4 showing symbol: NQH3. |
View |
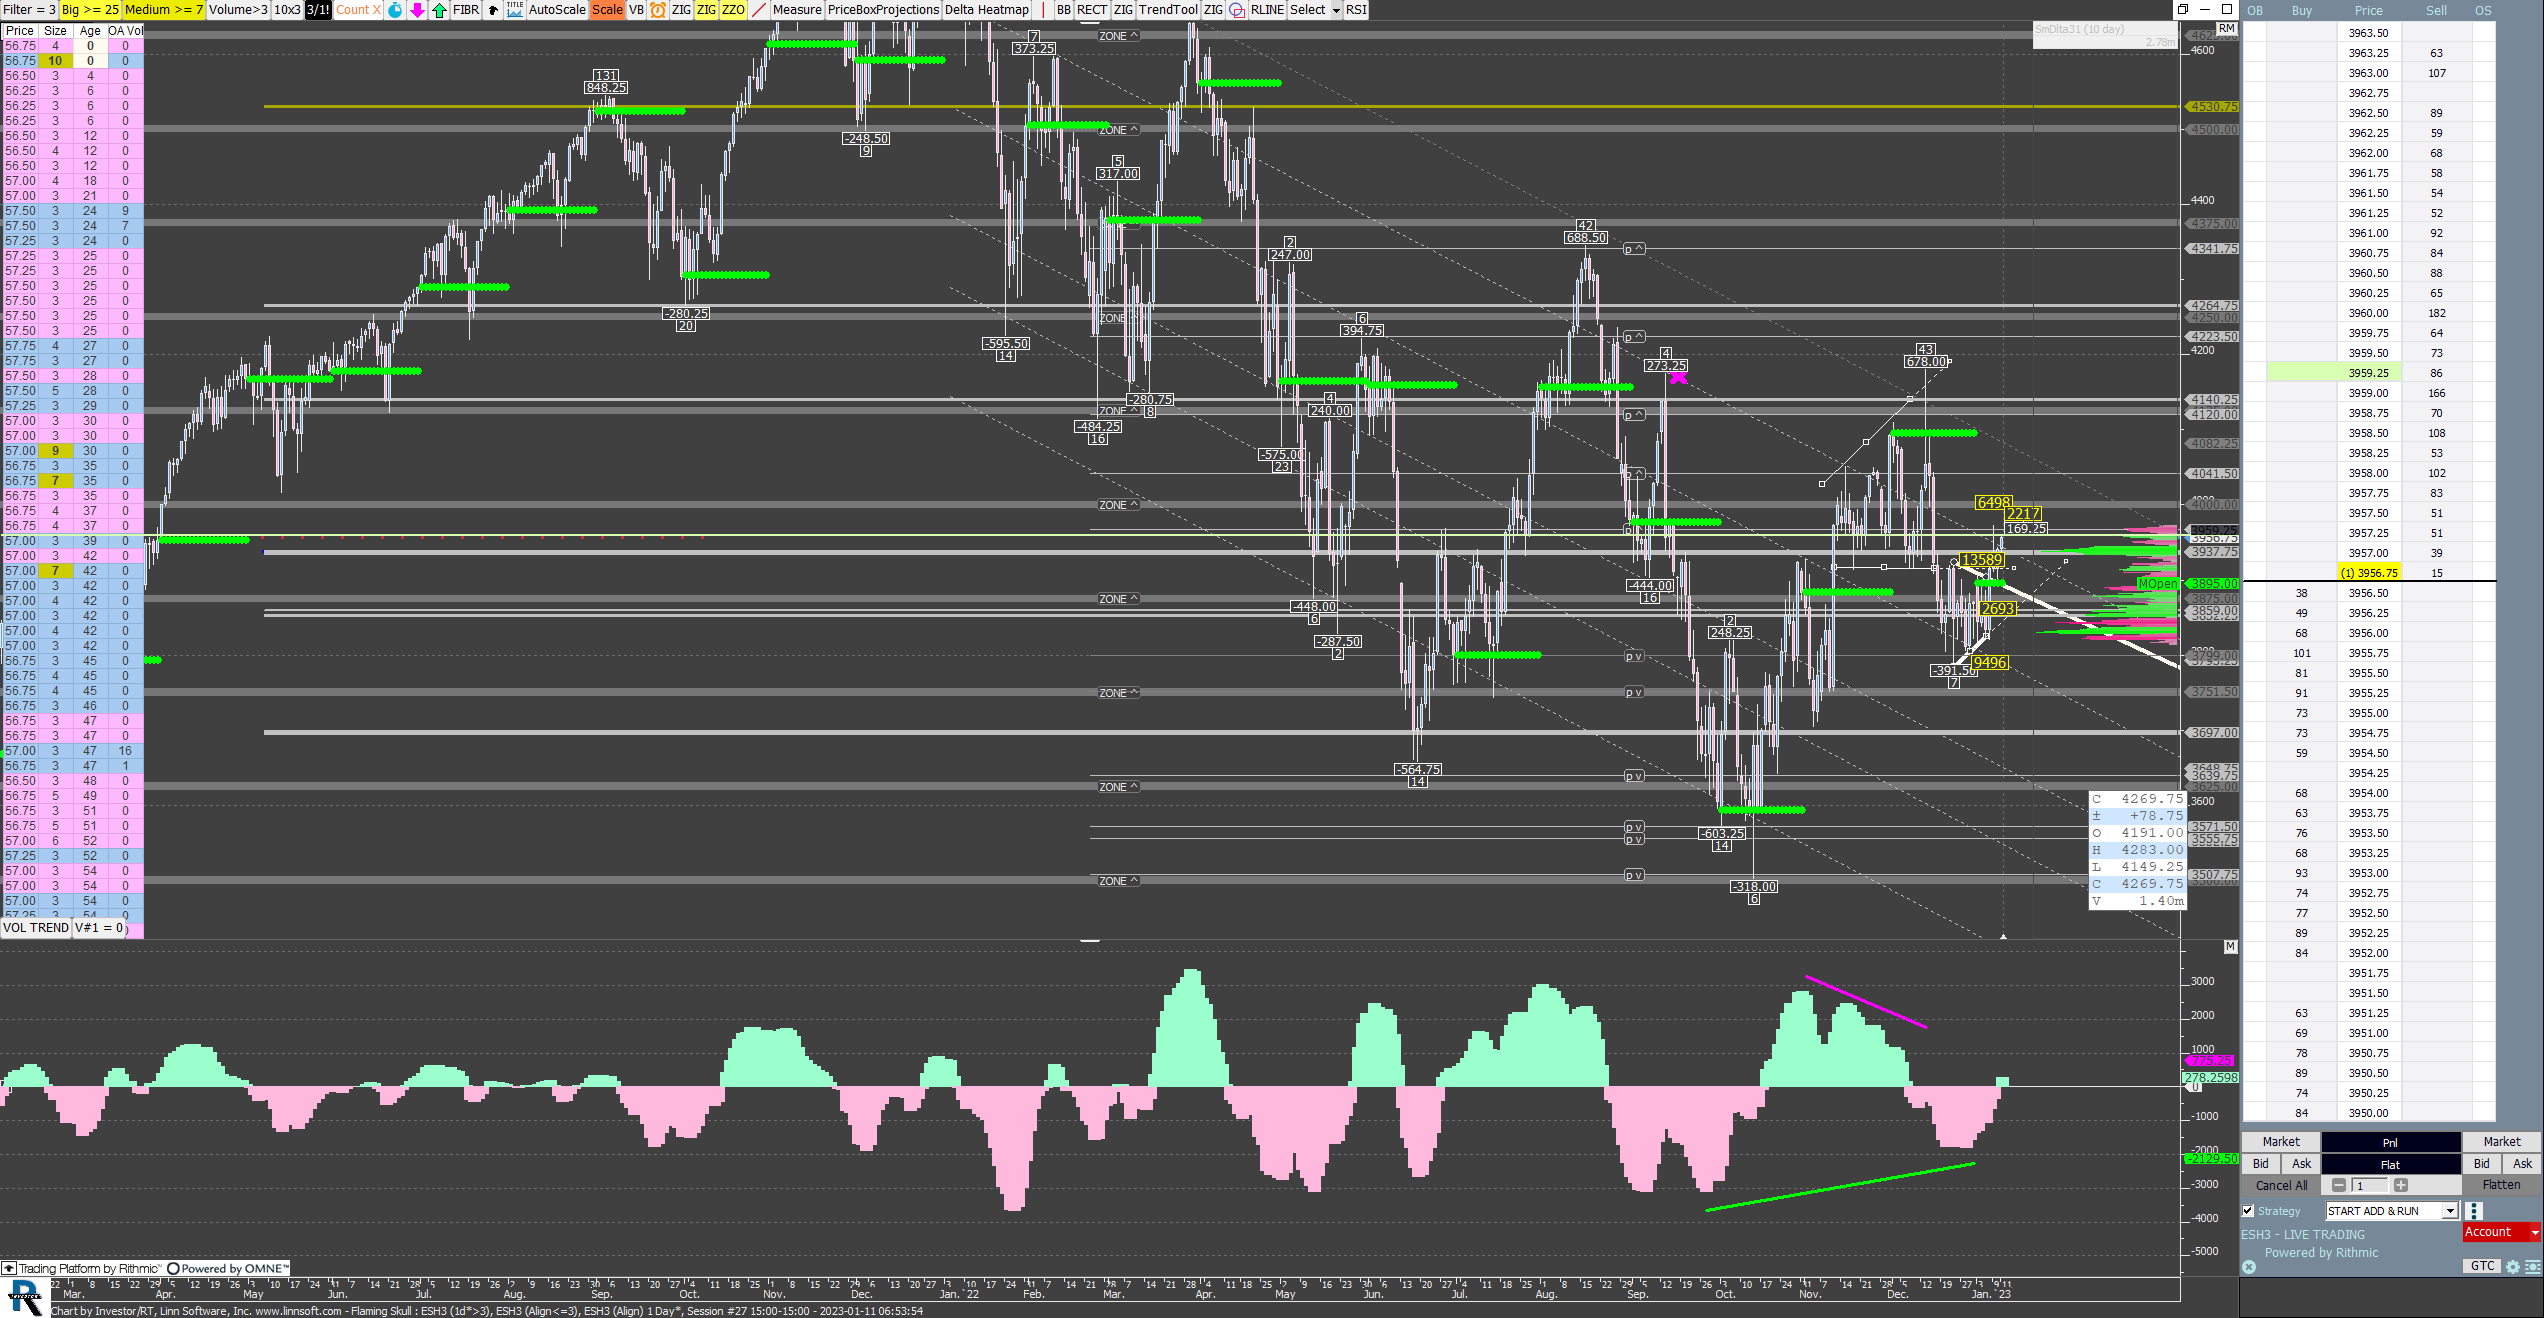 |
Flaming Skull (ESH3) Group_B [totalcount]
3 years 6 months ago
Dom will not scroll up. This chart was uploaded by Investor/RT 15.1.12 showing symbol: ESH3. |
View |
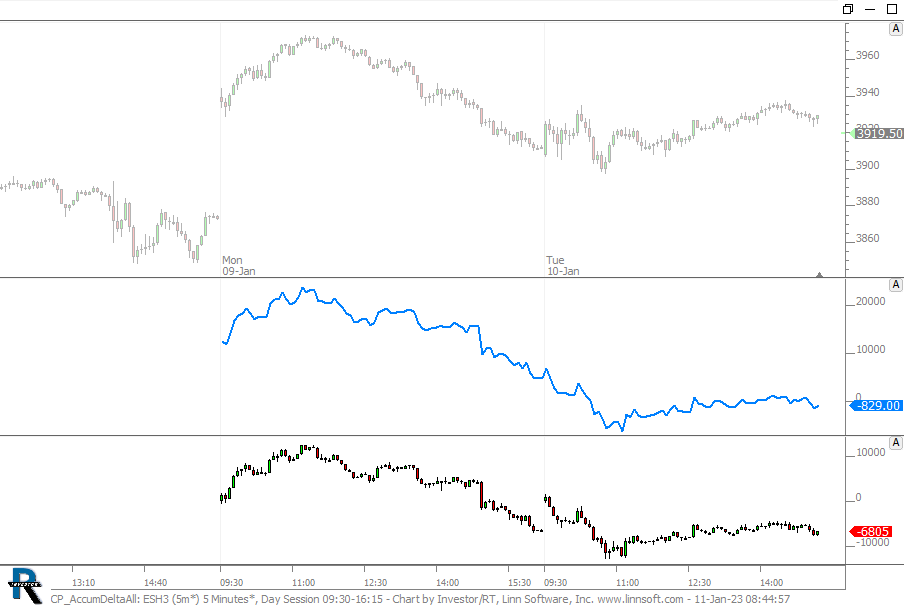 |
CP AccumDeltaAll (ESH3) cpayne [totalcount]
3 years 6 months ago
This chart was uploaded by Investor/RT 15.1.12 showing symbol: ESH3. |
View |