 |
MoradData cpayne [totalcount]
4 years 4 months ago
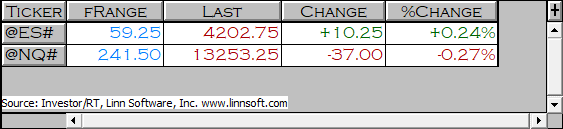
Morad Statistics - Full Session Range Custom Column. This chart was uploaded by Investor/RT 15.1.4. |
View |
 |
ESH22 (@ESH22) Kirk Howard [totalcount]
4 years 4 months ago
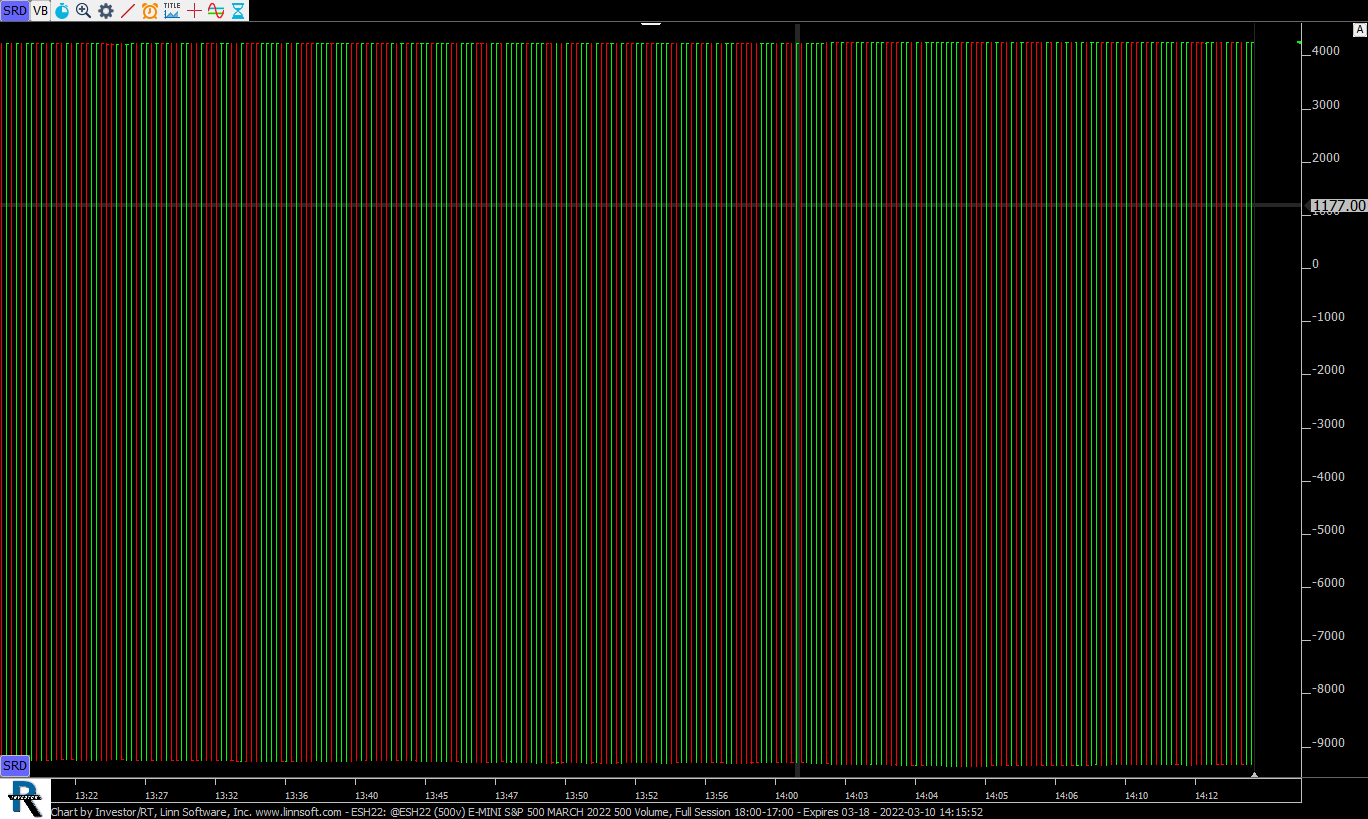
This chart was uploaded by Investor/RT 14.2.8 showing symbol: @ESH22. |
View |
 |
CP VS TSLA (TSLA) cpayne [totalcount]
4 years 4 months ago
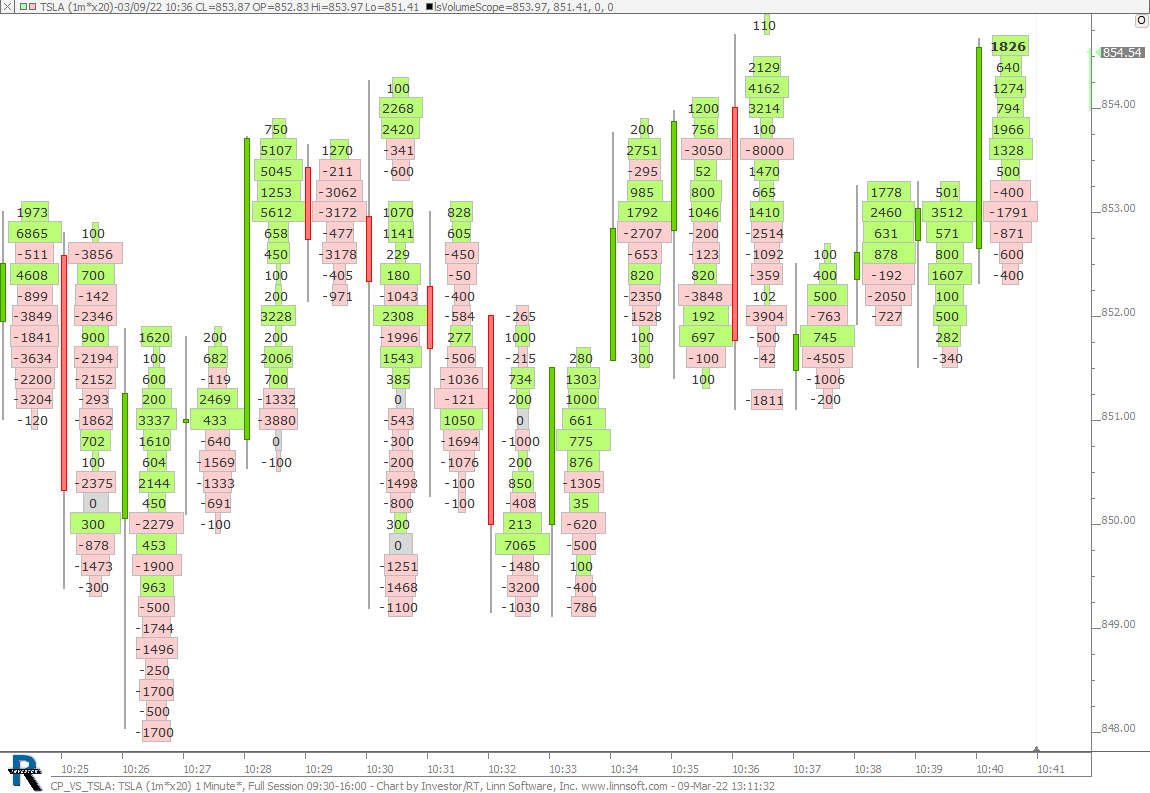
This chart was uploaded by Investor/RT 15.1.4 showing symbol: TSLA. |
View |
 |
lsPeriodCandles (@ES#) cpayne [totalcount]
4 years 4 months ago
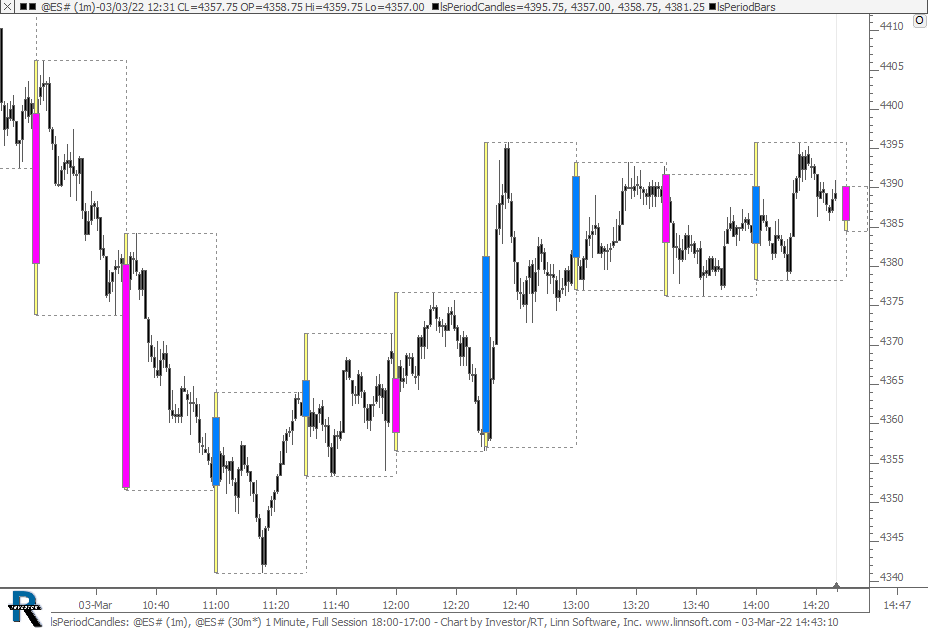
lsPeriodCandles. This chart was uploaded by Investor/RT 15.1.3 showing symbol: @ES#. |
View |
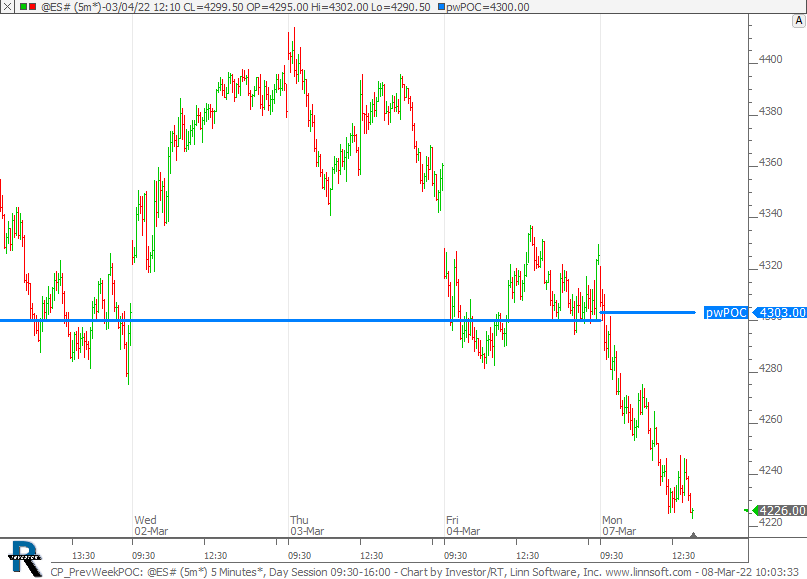 |
CP PrevWeekPOC (@ES#) cpayne [totalcount]
4 years 4 months ago
This chart was uploaded by Investor/RT 15.1.4 showing symbol: @ES#. |
View |
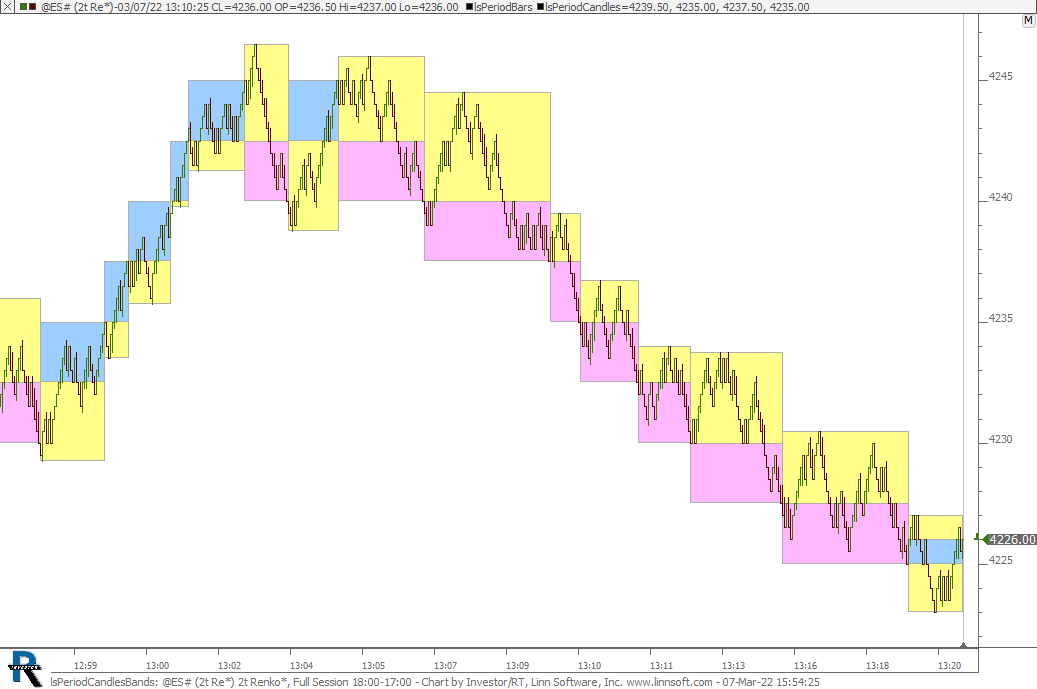 |
lsPeriodCandlesBands (@ES#) cpayne [totalcount]
4 years 4 months ago
lsPeriodCandles Bands. This chart was uploaded by Investor/RT 15.1.4 showing symbol: @ES#. |
View |
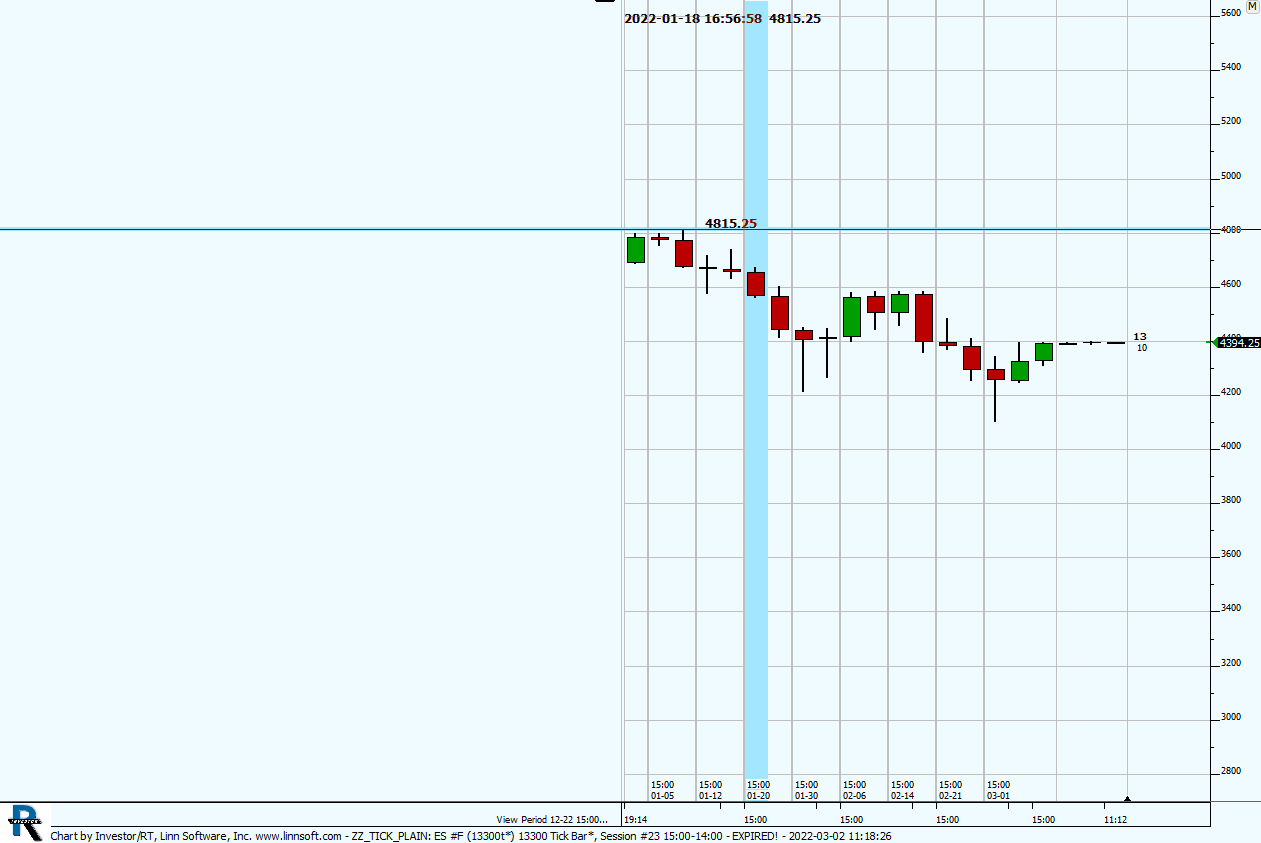 |
ZZ TICK PLAIN (ES #F) yksingh [totalcount]
4 years 5 months ago
This chart was uploaded by Investor/RT 13.7.13 showing symbol: ES #F. |
View |
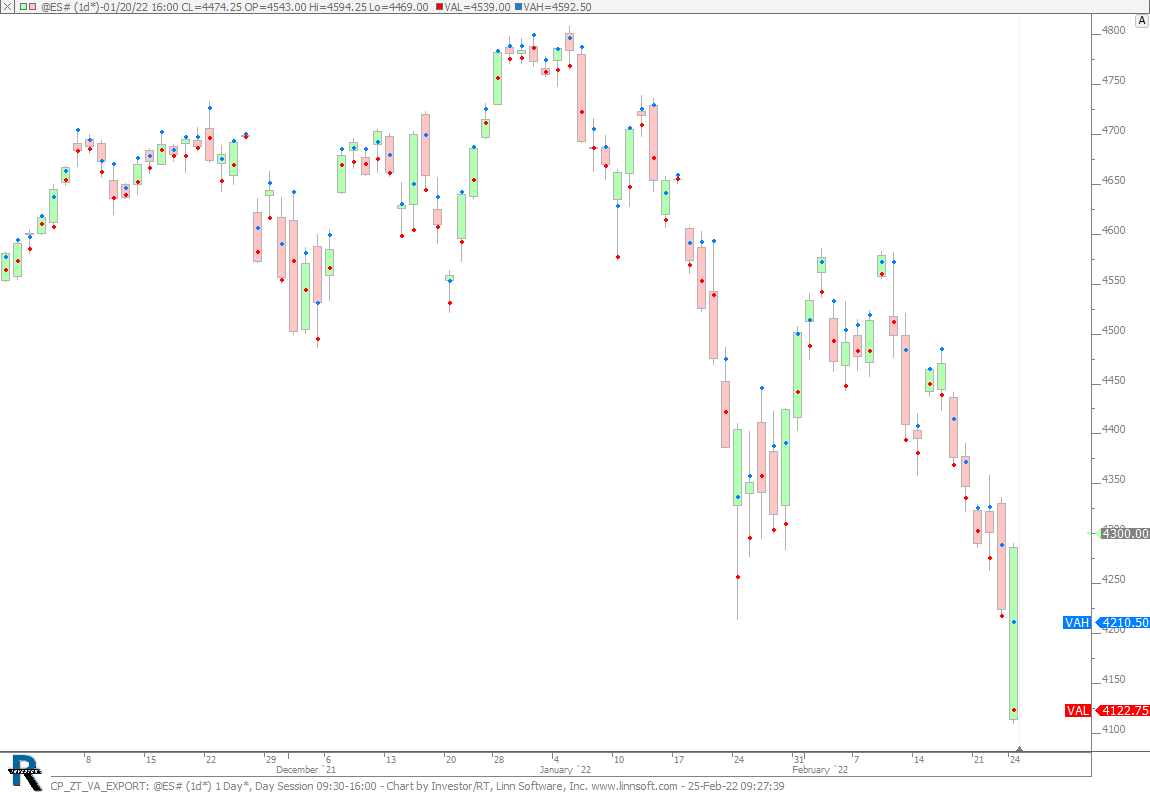 |
CP ZT VA EXPORT (@ES#) cpayne [totalcount]
4 years 5 months ago
This chart was uploaded by Investor/RT 15.1.2 showing symbol: @ES#. |
View |
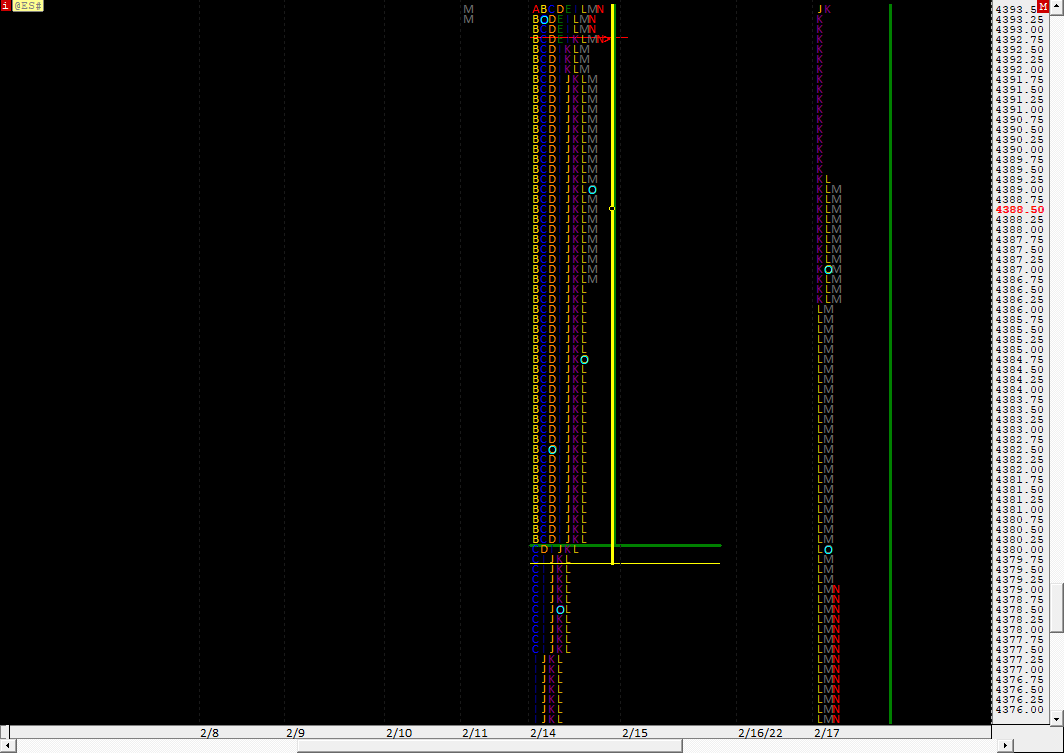 |
ES Market Profile (@ES#) cpayne [totalcount]
4 years 5 months ago
This chart was uploaded by Investor/RT 15.1.2 showing symbol: @ES#. |
View |
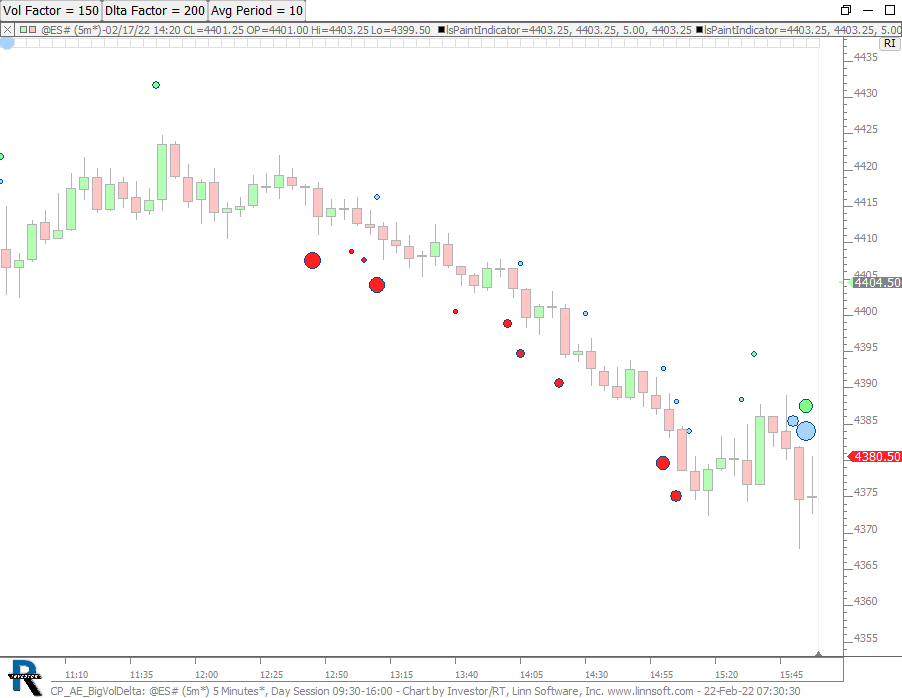 |
CP AE BigVolDelta (@ES#) cpayne [totalcount]
4 years 5 months ago
This chart was uploaded by Investor/RT 15.1.2 showing symbol: @ES#. |
View |
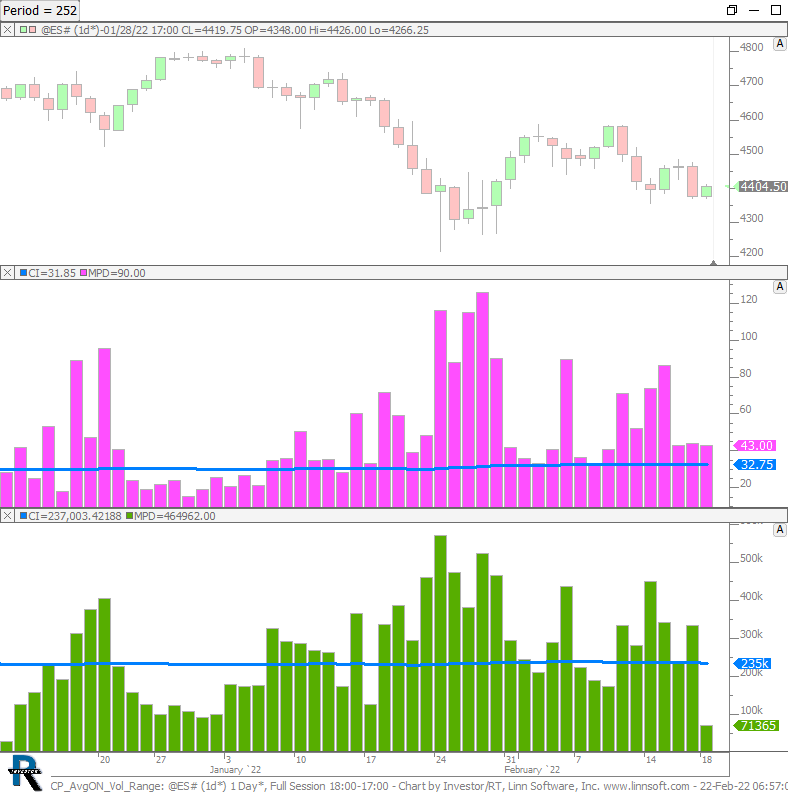 |
CP AvgON Vol Range (@ES#) cpayne [totalcount]
4 years 5 months ago
Average Overnight Volume and Range (252 Day). This chart was uploaded by Investor/RT 15.1.2 showing symbol: @ES#. |
View |
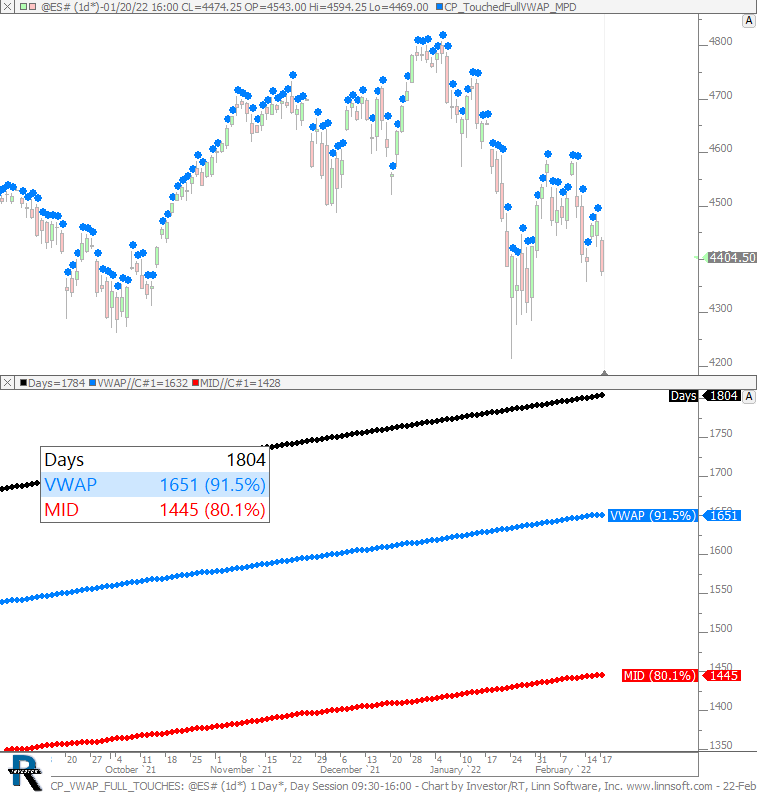 |
CP VWAP FULL TOUCHES (@ES#) cpayne [totalcount]
4 years 5 months ago
This chart was uploaded by Investor/RT 15.1.2 showing symbol: @ES#. |
View |
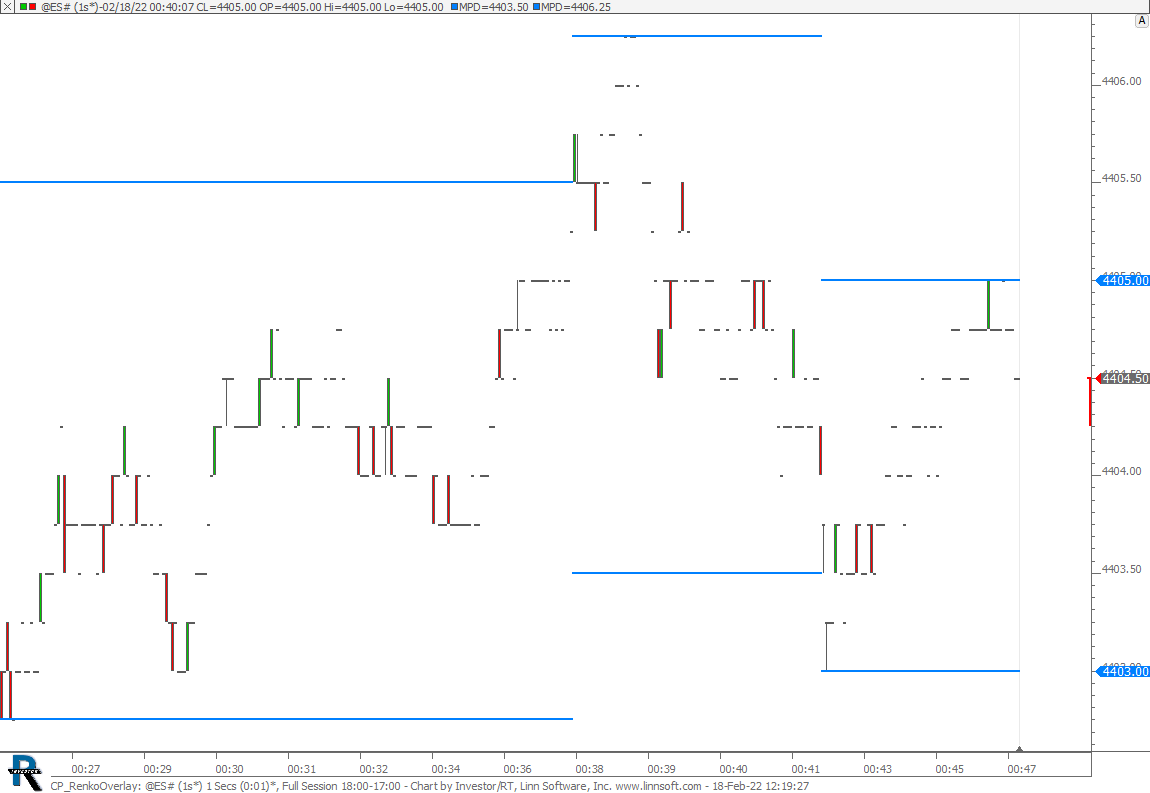 |
CP RenkoOverlay (@ES#) cpayne [totalcount]
4 years 5 months ago
This chart was uploaded by Investor/RT 15.1.2 showing symbol: @ES#. |
View |
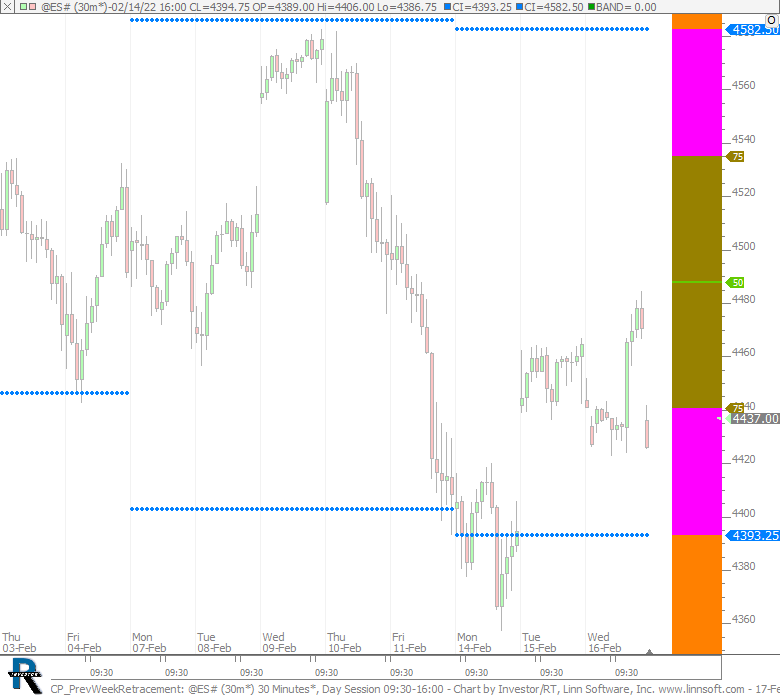 |
CP PrevWeekRetracement (@ES#) cpayne [totalcount]
4 years 5 months ago
This chart was uploaded by Investor/RT 15.1.2 showing symbol: @ES#. |
View |
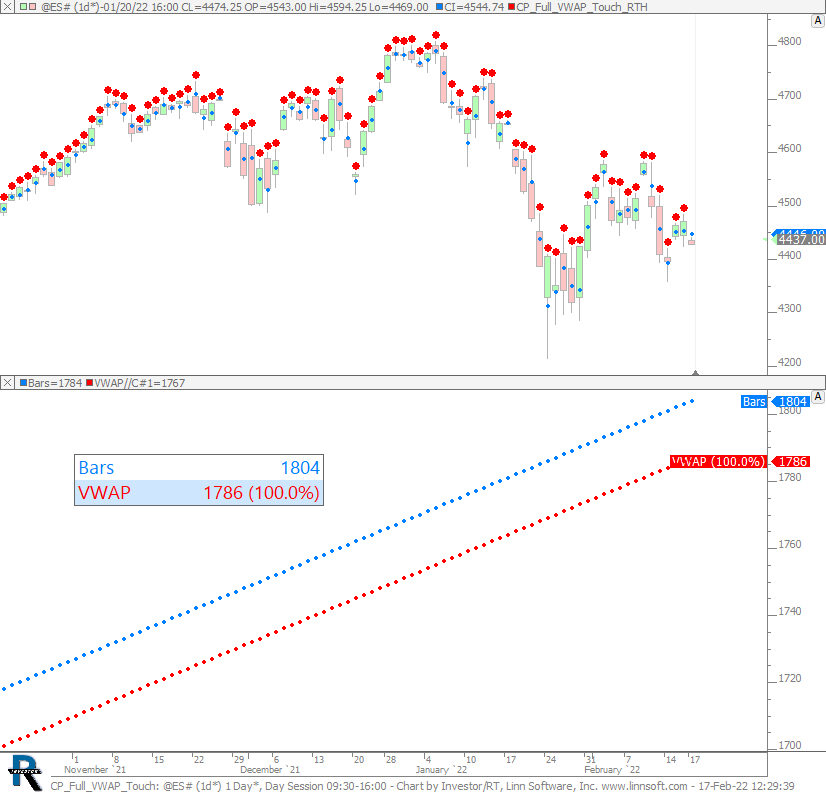 |
CP Full VWAP Touch (@ES#) cpayne [totalcount]
4 years 5 months ago
This chart was uploaded by Investor/RT 15.1.2 showing symbol: @ES#. |
View |
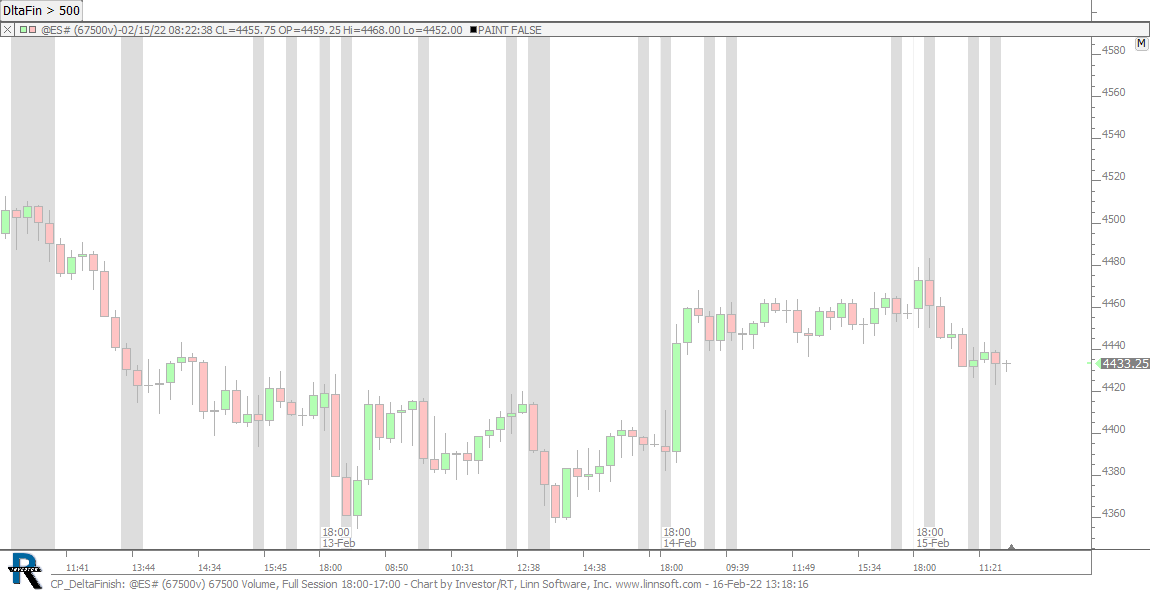 |
CP DeltaFinish (@ES#) cpayne [totalcount]
4 years 5 months ago
This chart was uploaded by Investor/RT 15.1.2 showing symbol: @ES#. |
View |
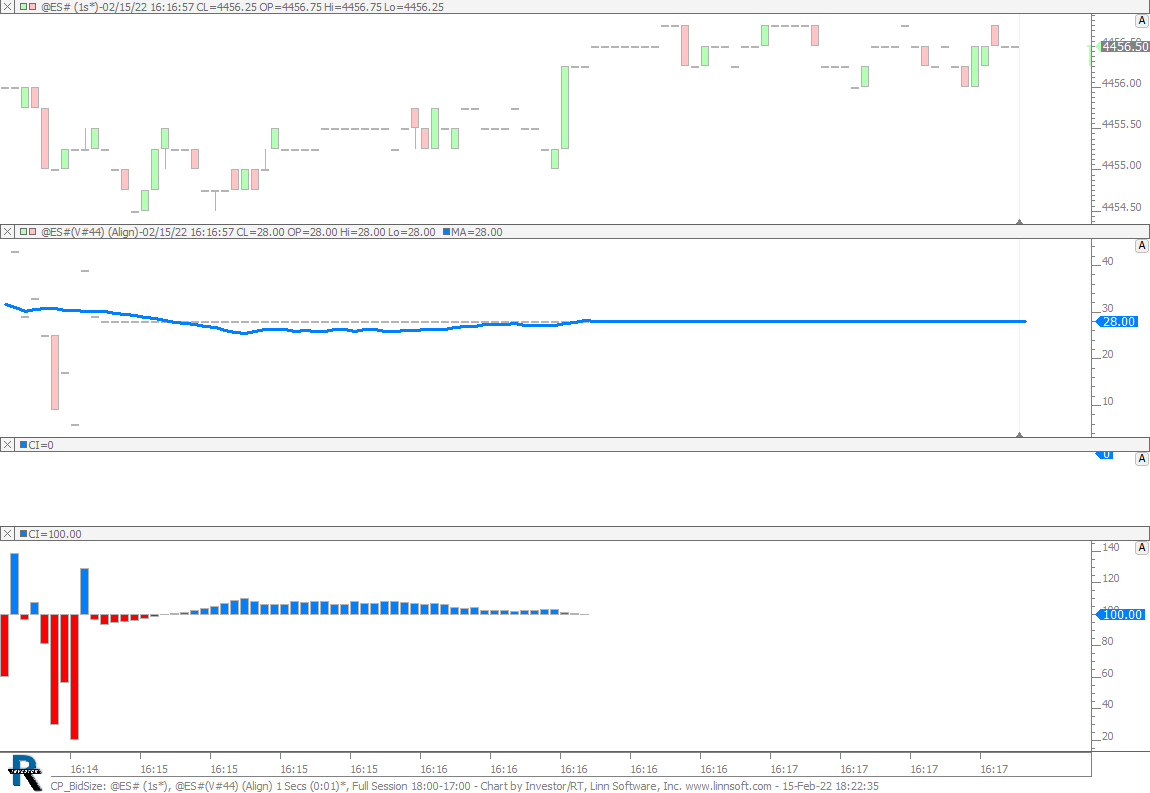 |
CP BidSize (@ES#) cpayne [totalcount]
4 years 5 months ago
This chart was uploaded by Investor/RT 15.1.2 showing symbol: @ES#. |
View |
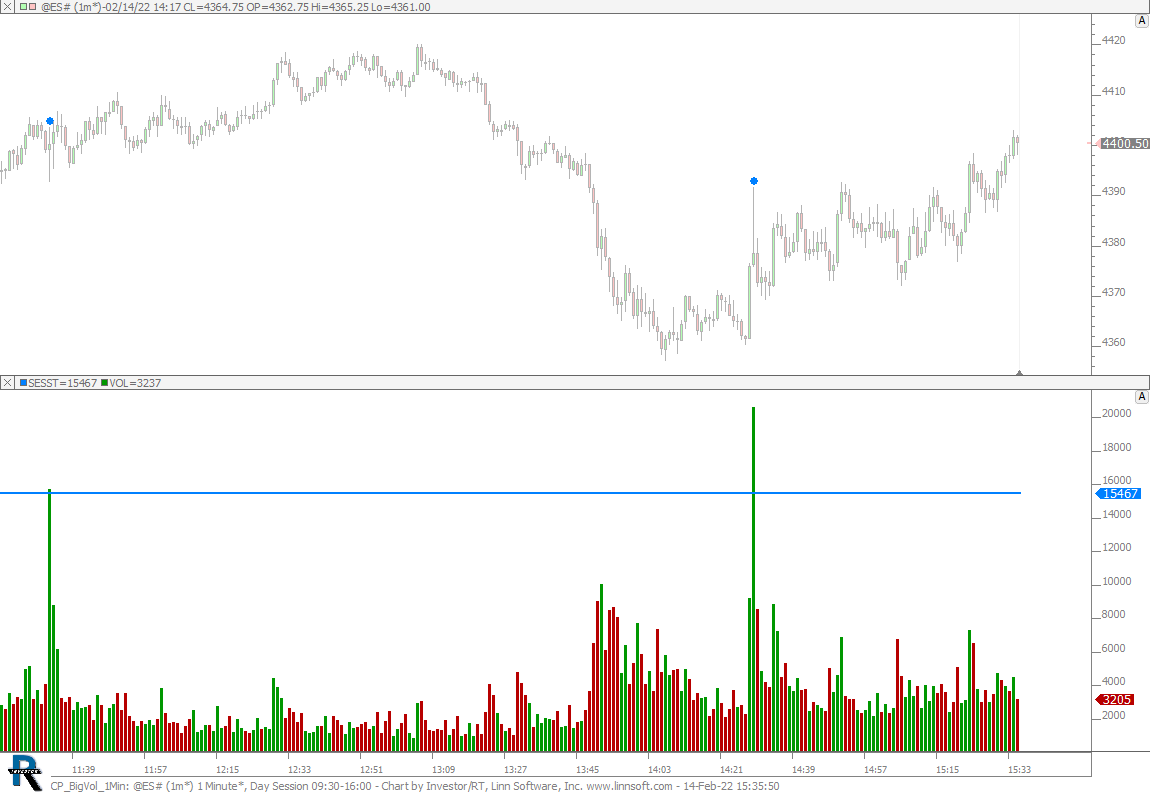 |
CP BigVol 1Min (@ES#) cpayne [totalcount]
4 years 5 months ago
This chart was uploaded by Investor/RT 15.1.2 showing symbol: @ES#. |
View |
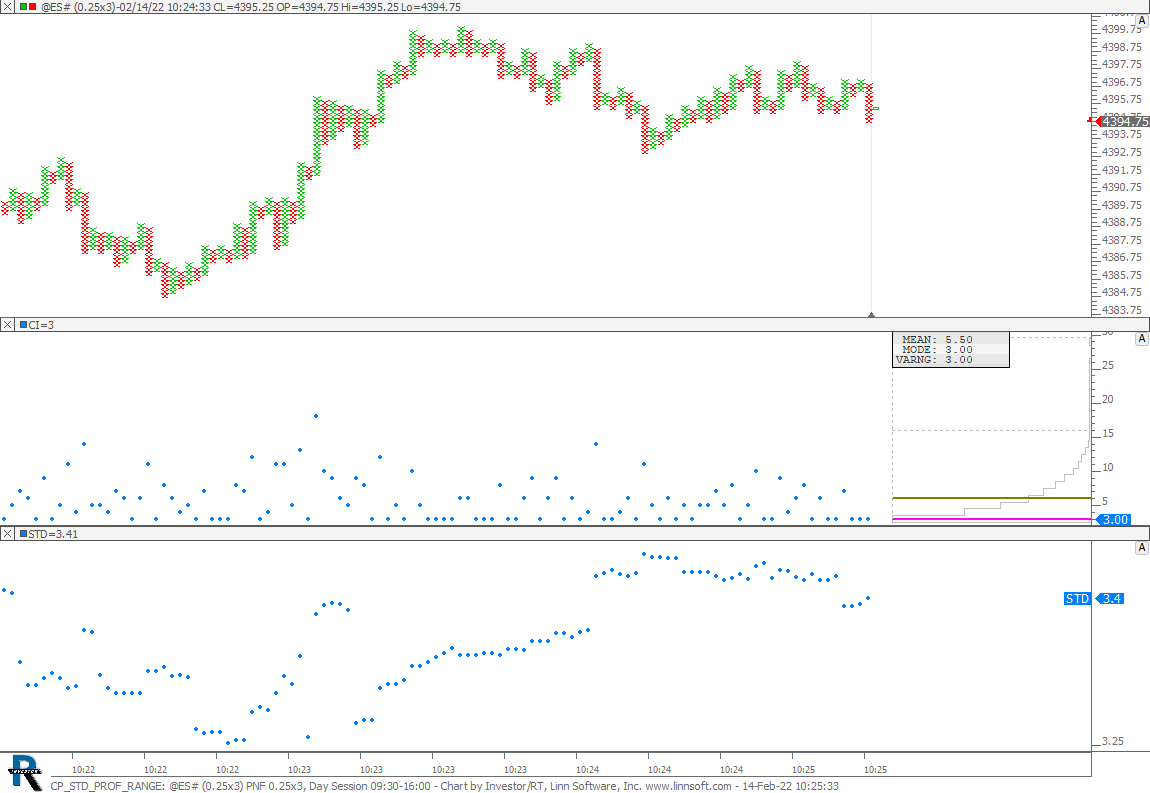 |
CP STD PROF RANGE (@ES#) cpayne [totalcount]
4 years 5 months ago
This chart was uploaded by Investor/RT 15.1.2 showing symbol: @ES#. |
View |
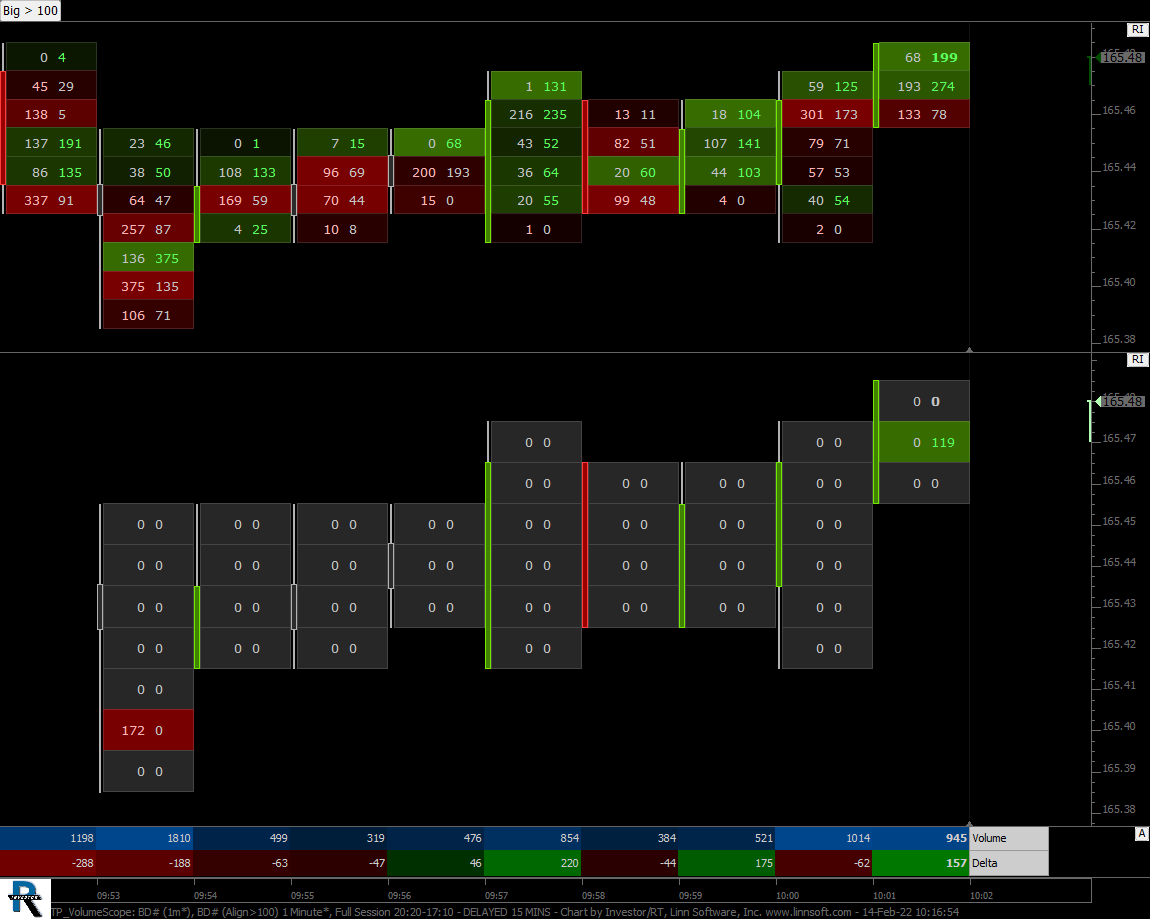 |
TP VolumeScope (BD#) cpayne [totalcount]
4 years 5 months ago
This chart was uploaded by Investor/RT 15.1.2 showing symbol: BD#. |
View |
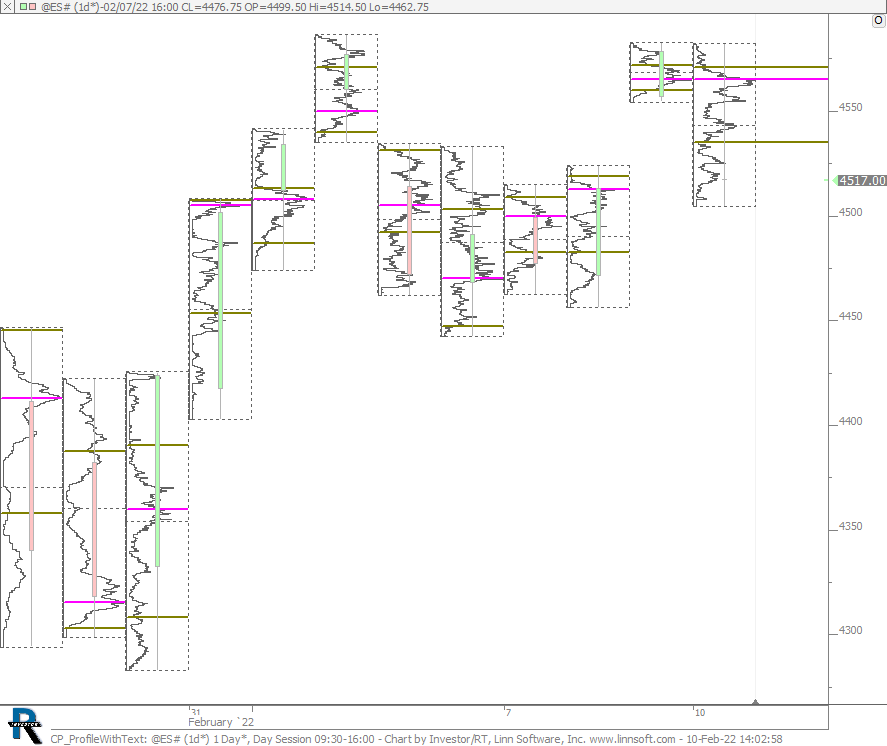 |
CP ProfileWithText (@ES#) cpayne [totalcount]
4 years 5 months ago
This chart was uploaded by Investor/RT 15.1.2 showing symbol: @ES#. |
View |
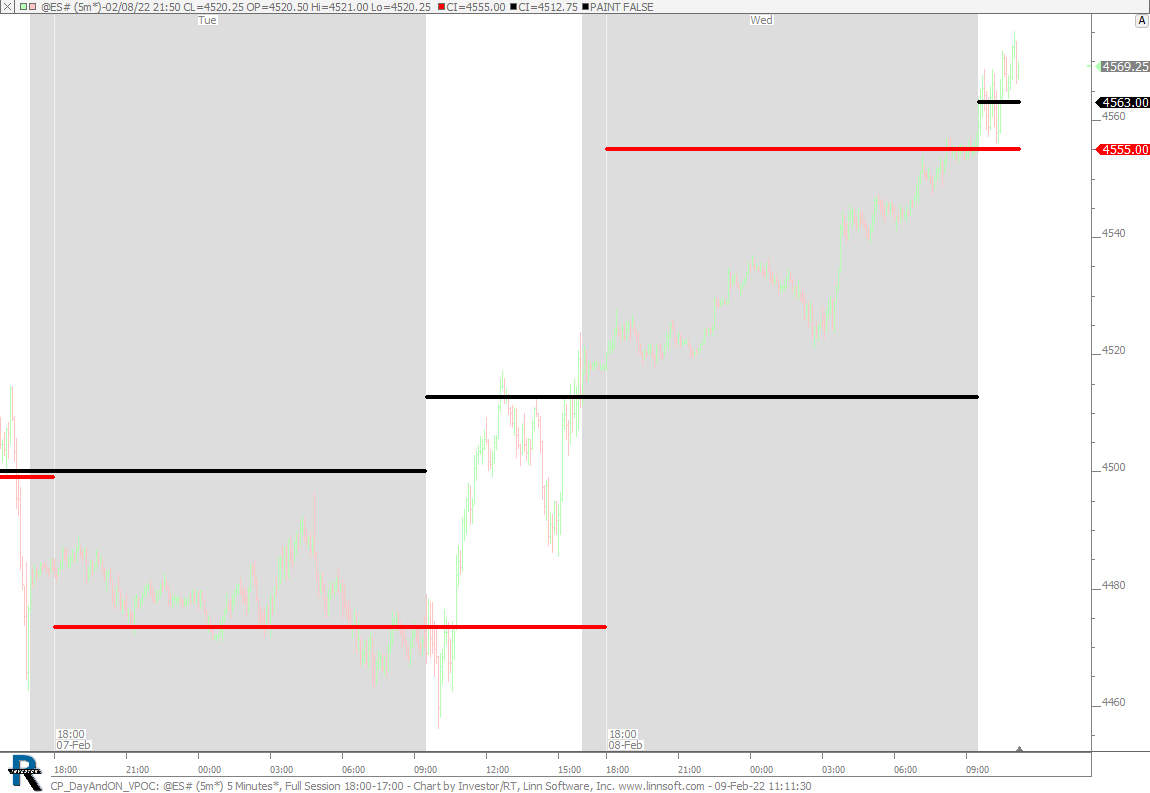 |
CP DayAndON VPOC (@ES#) cpayne [totalcount]
4 years 5 months ago
This chart was uploaded by Investor/RT 15.1.2 showing symbol: @ES#. |
View |
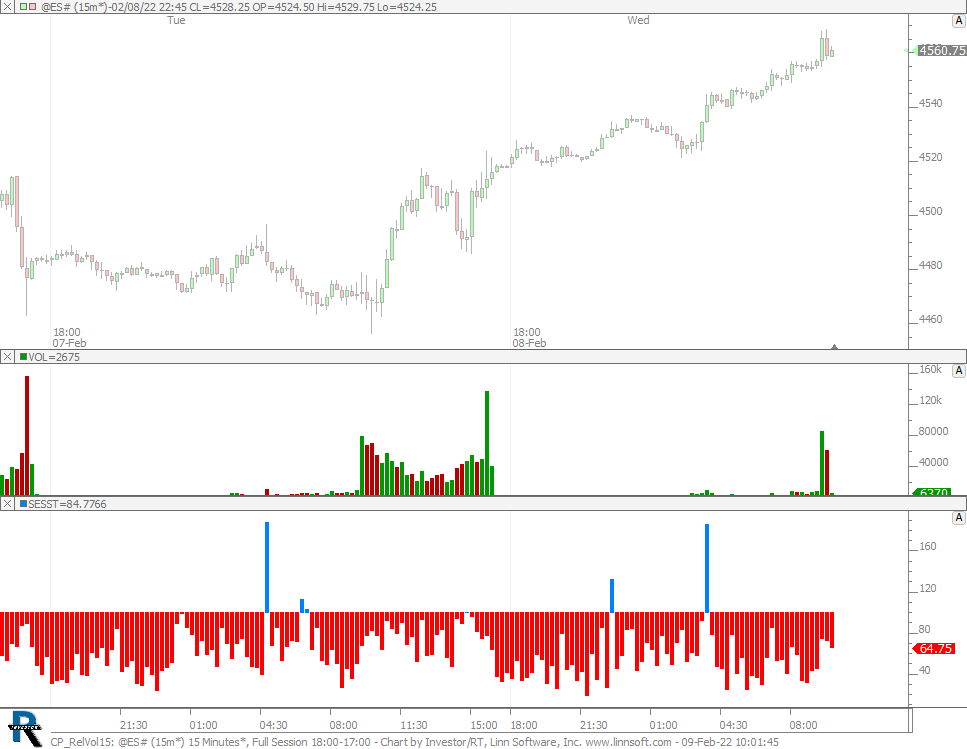 |
CP RelVol15 (@ES#) cpayne [totalcount]
4 years 5 months ago
This chart was uploaded by Investor/RT 15.1.2 showing symbol: @ES#. |
View |
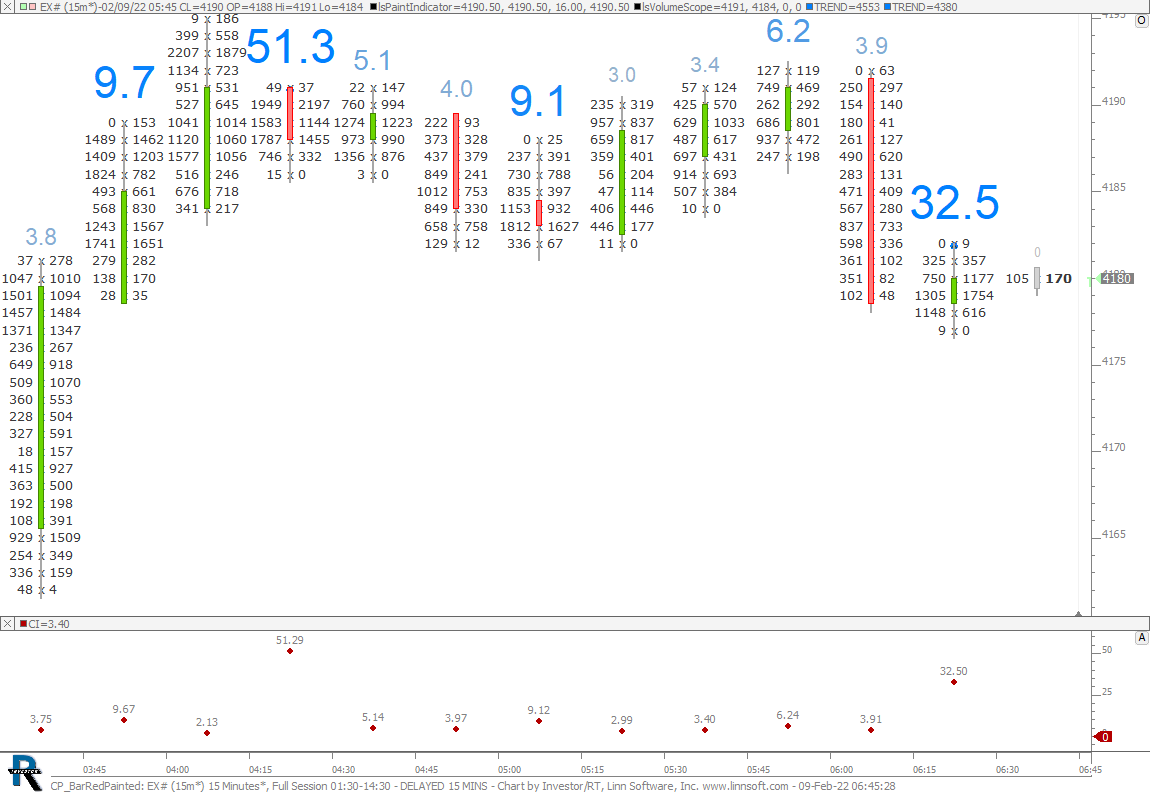 |
CP BarRedPainted (EX#) cpayne [totalcount]
4 years 5 months ago
This chart was uploaded by Investor/RT 15.1.1 showing symbol: EX#. |
View |
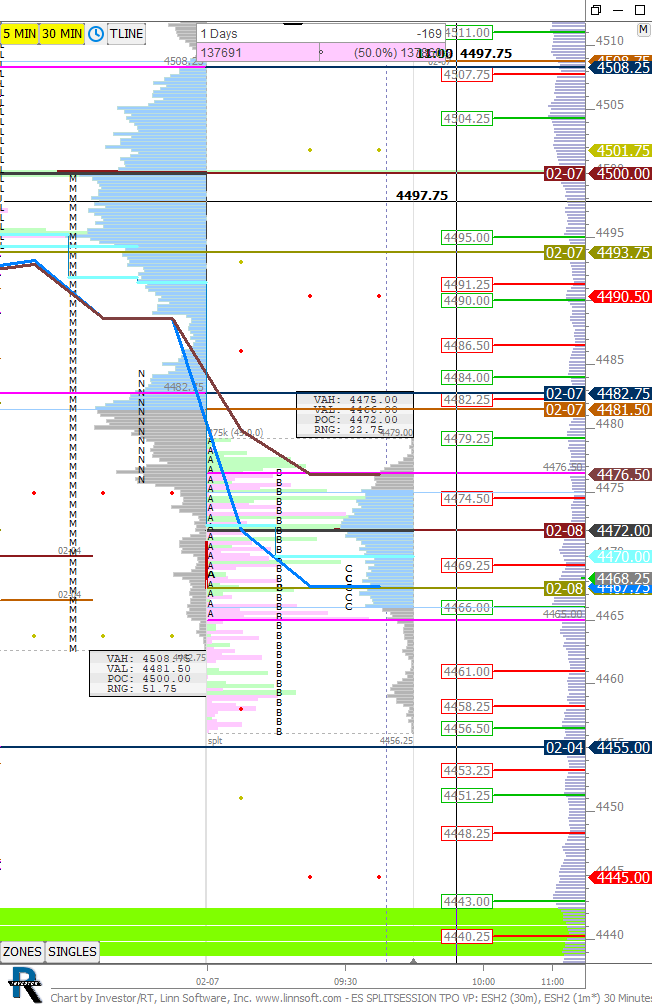 |
ES SPLITSESSION TPO VP (ESH2) scottz46 [totalcount]
4 years 5 months ago
This chart was uploaded by Investor/RT 14.2.8 showing symbol: ESH2. |
View |