 |
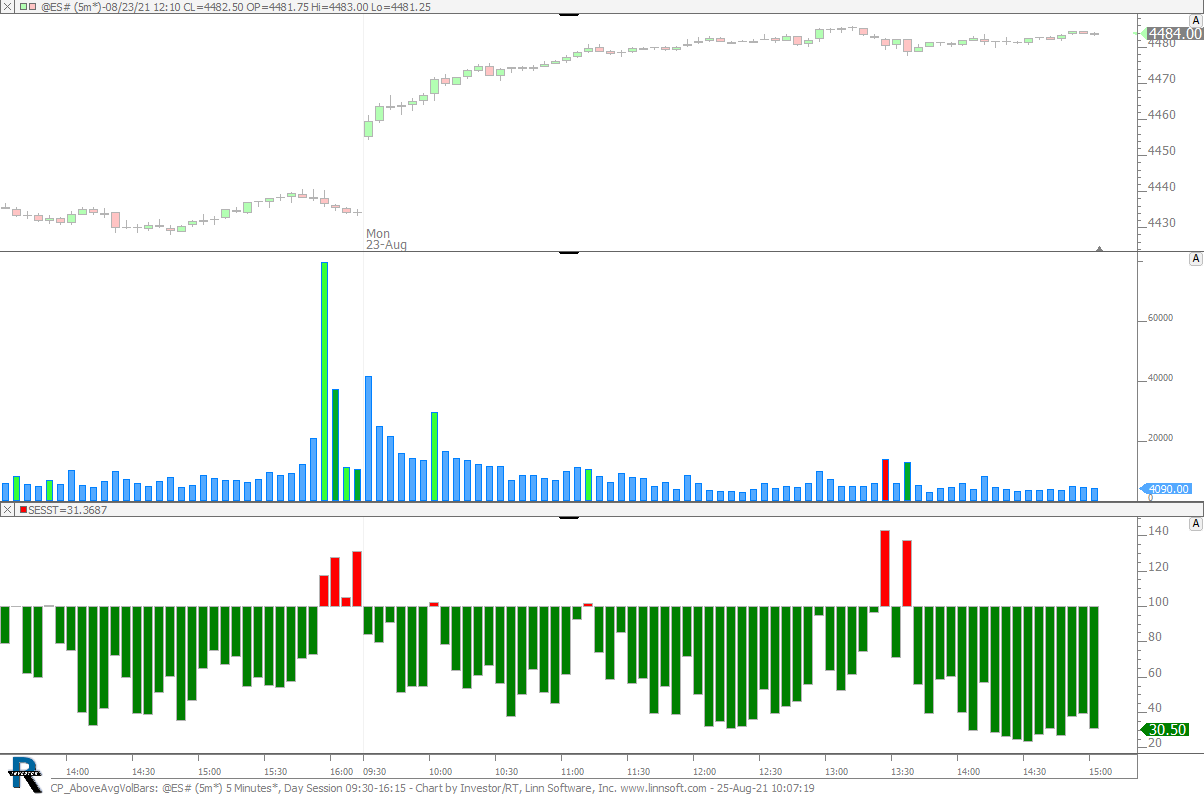
CP AboveAvgVolBars (@ES#) cpayne [totalcount]
4 years 11 months ago
This chart was uploaded by Investor/RT 15.1.1 showing symbol: @ES#. |
View |
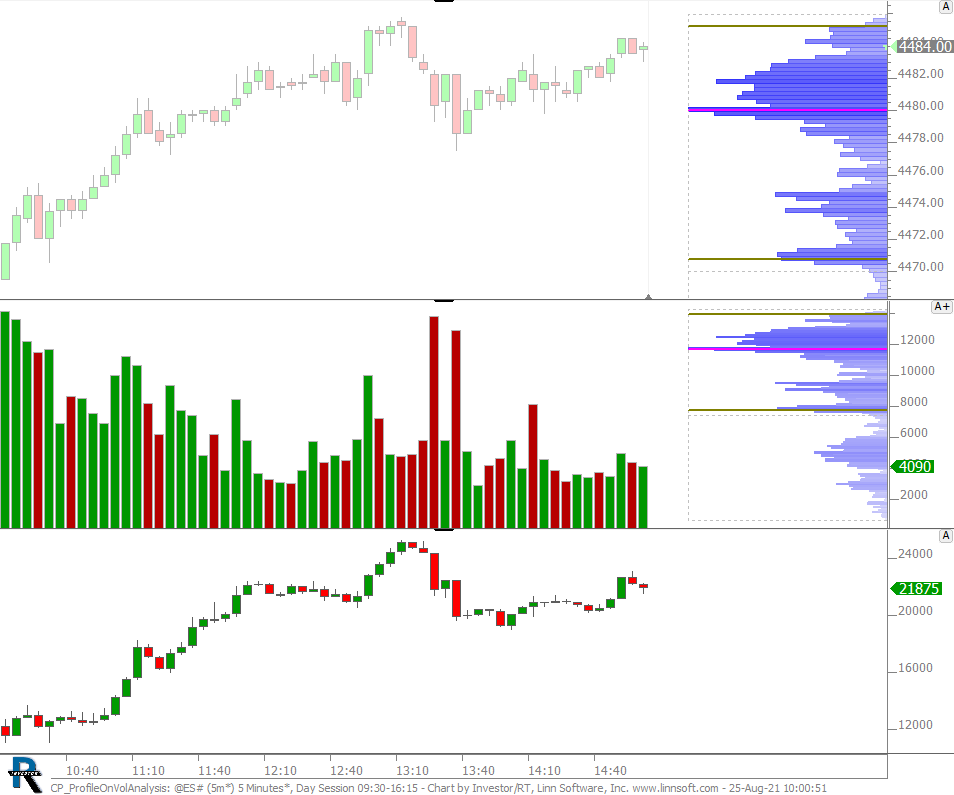 |
CP ProfileOnVolAnalysis (@ES#) cpayne [totalcount]
4 years 11 months ago
This chart was uploaded by Investor/RT 15.1.1 showing symbol: @ES#. |
View |
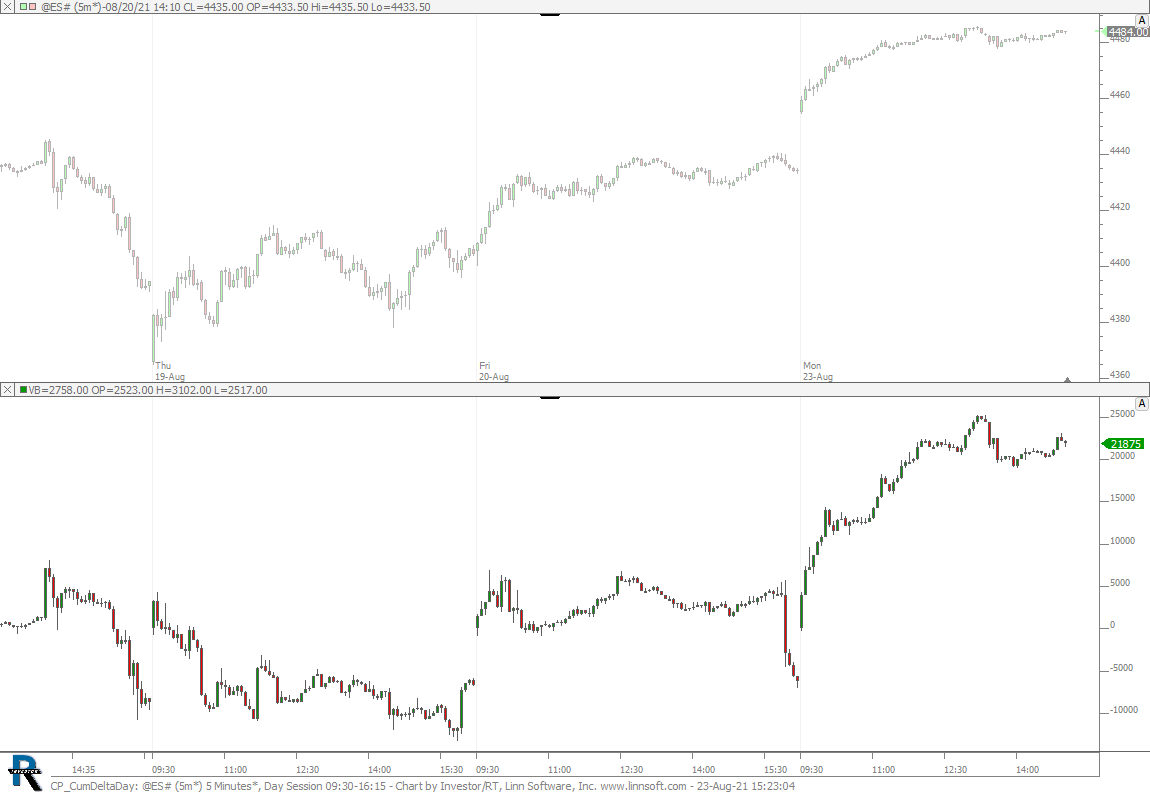 |
CP CumDeltaDay (@ES#) cpayne [totalcount]
4 years 11 months ago
This chart was uploaded by Investor/RT 15.1.1 showing symbol: @ES#. |
View |
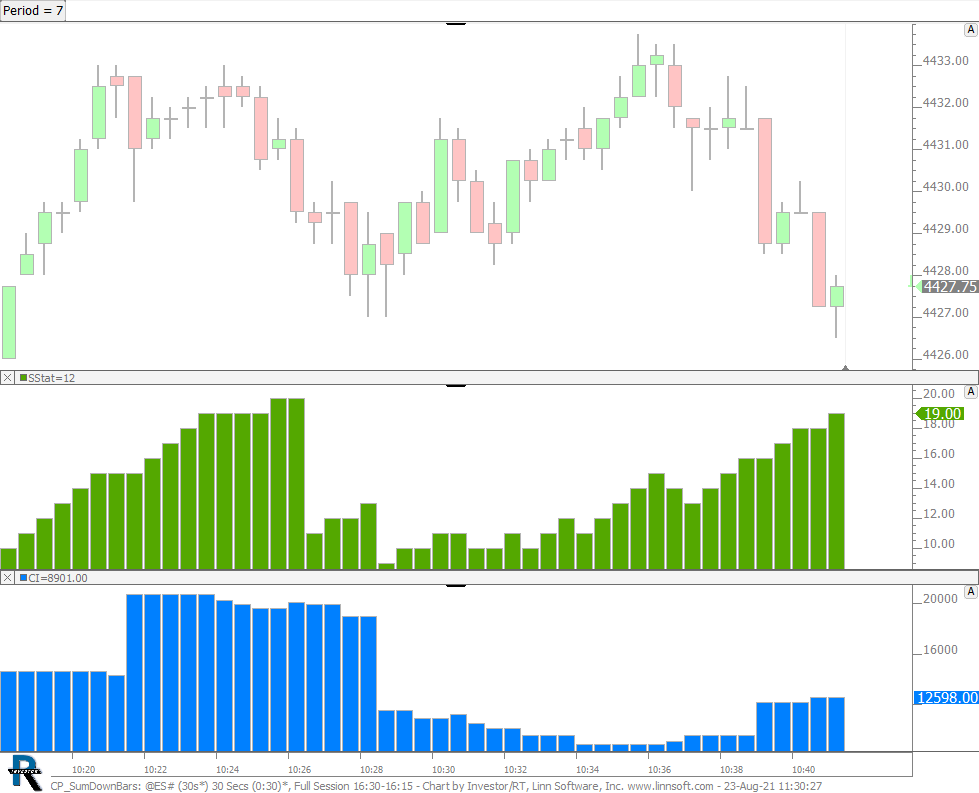 |
CP SumDownBars (@ES#) cpayne [totalcount]
4 years 11 months ago
This chart was uploaded by Investor/RT 15.1.1 showing symbol: @ES#. |
View |
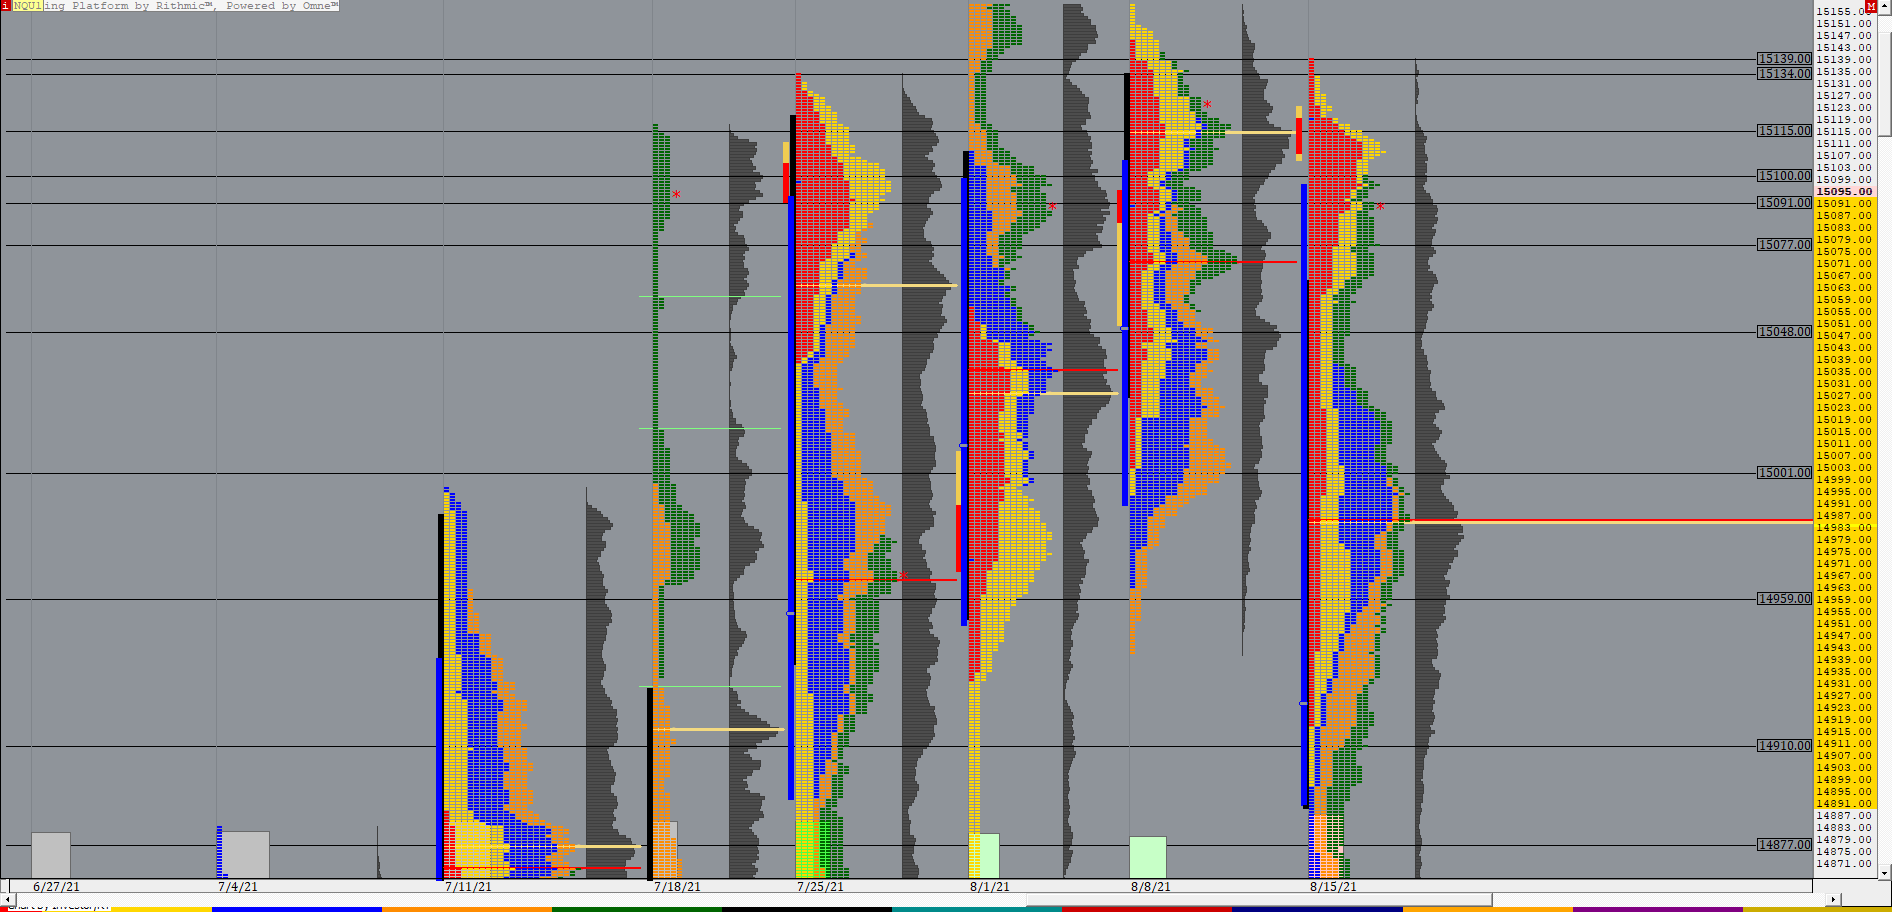 |
NQTPOWEEKLY (NQU1) ES42 [totalcount]
4 years 11 months ago
This chart was uploaded by Investor/RT 14.2.6 showing symbol: NQU1. |
View |
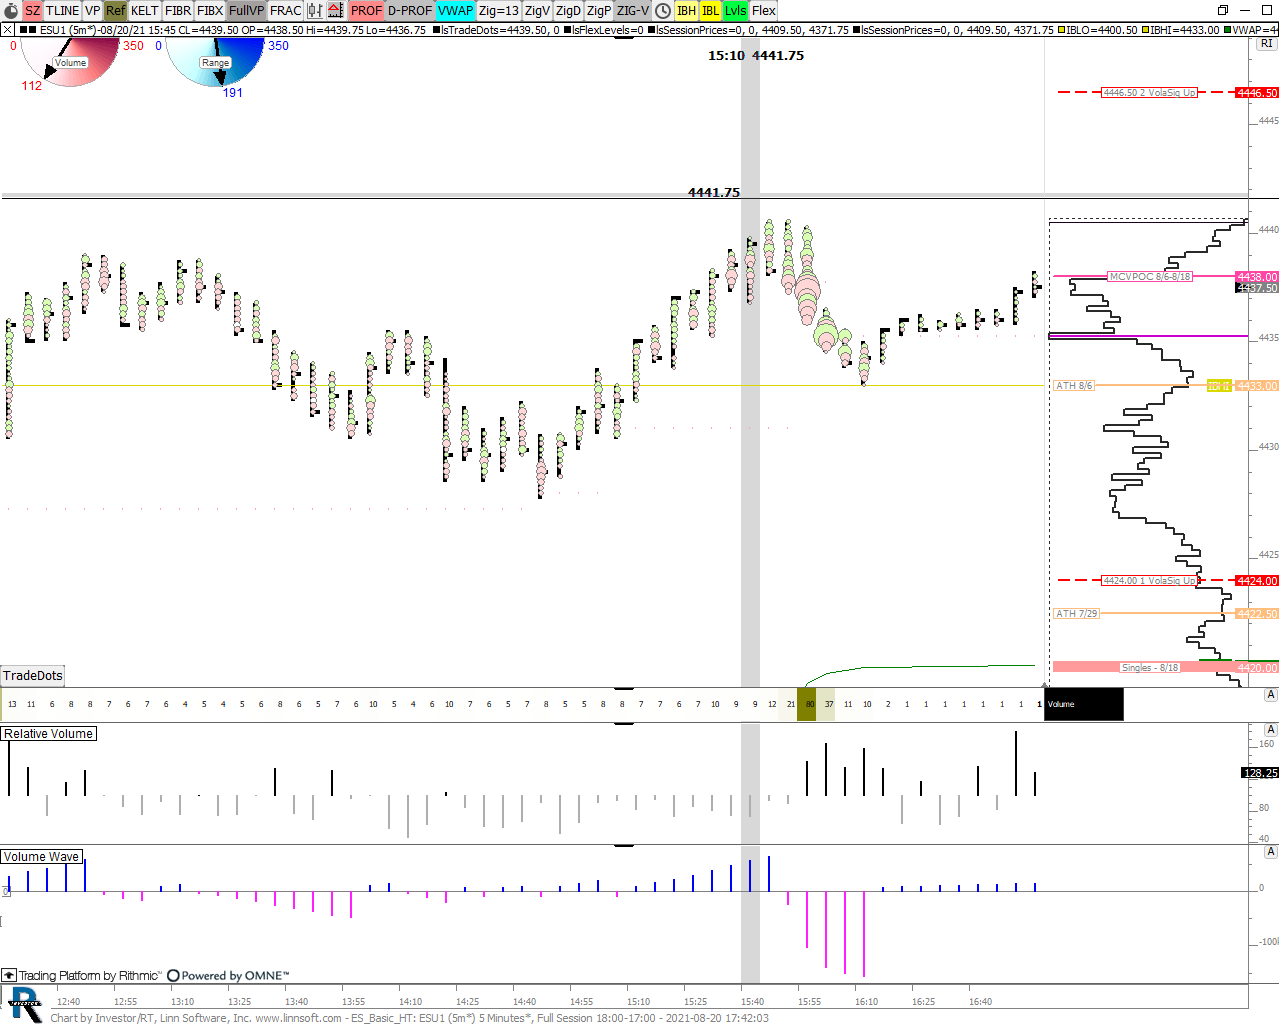 |
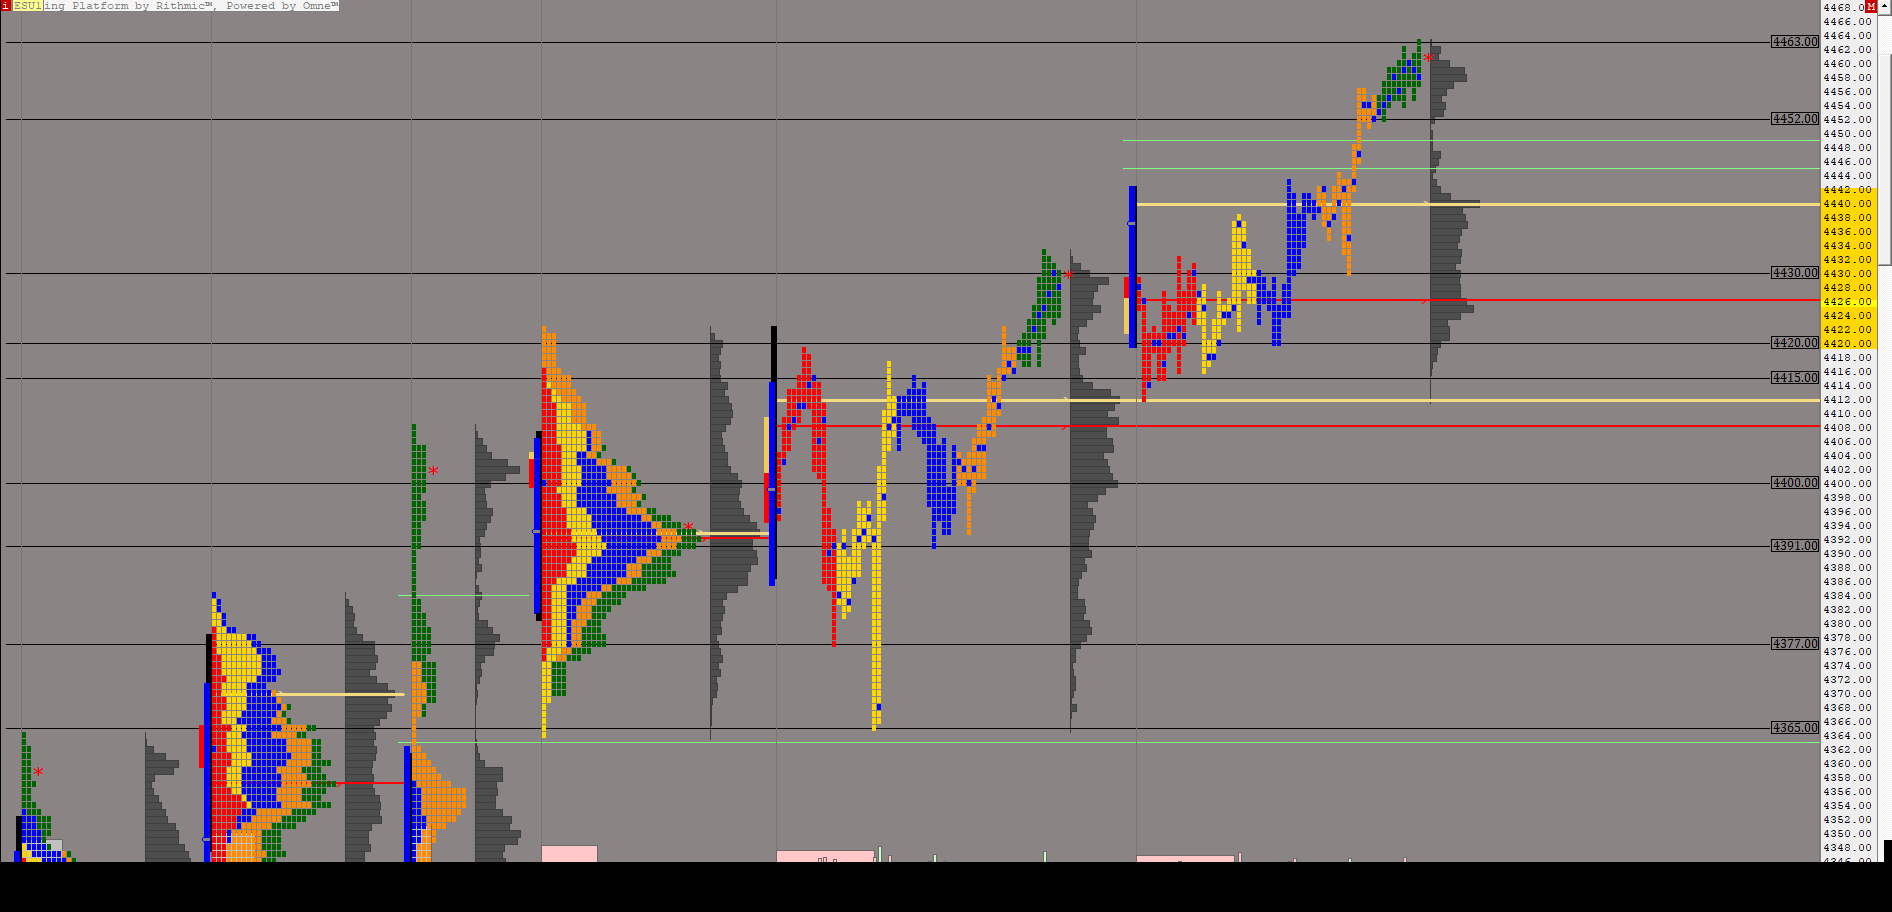
ES Basic HT (ESU1) SPetkov [totalcount]
4 years 11 months ago
RelVolume. This chart was uploaded by Investor/RT 14.2.6 showing symbol: ESU1. |
View |
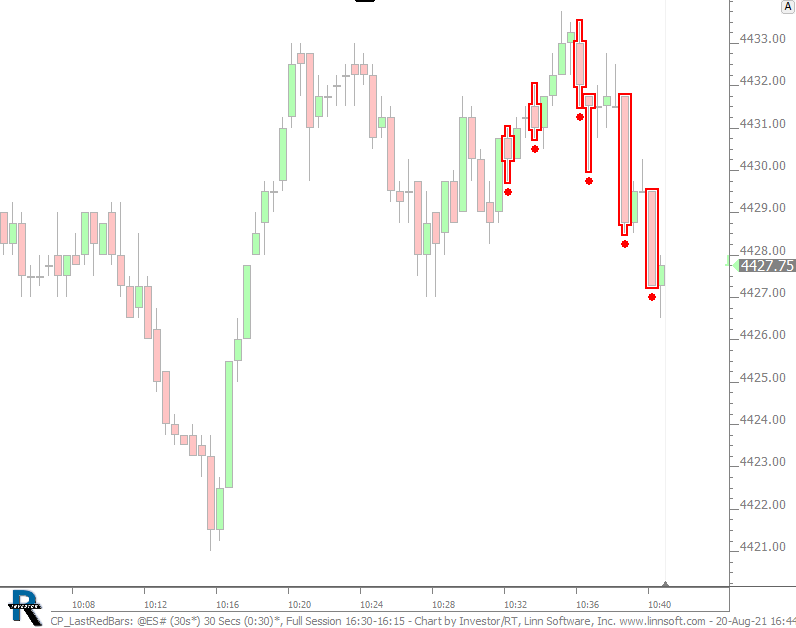 |
CP LastRedBars (@ES#) cpayne [totalcount]
4 years 11 months ago
This chart was uploaded by Investor/RT 15.1.1 showing symbol: @ES#. |
View |
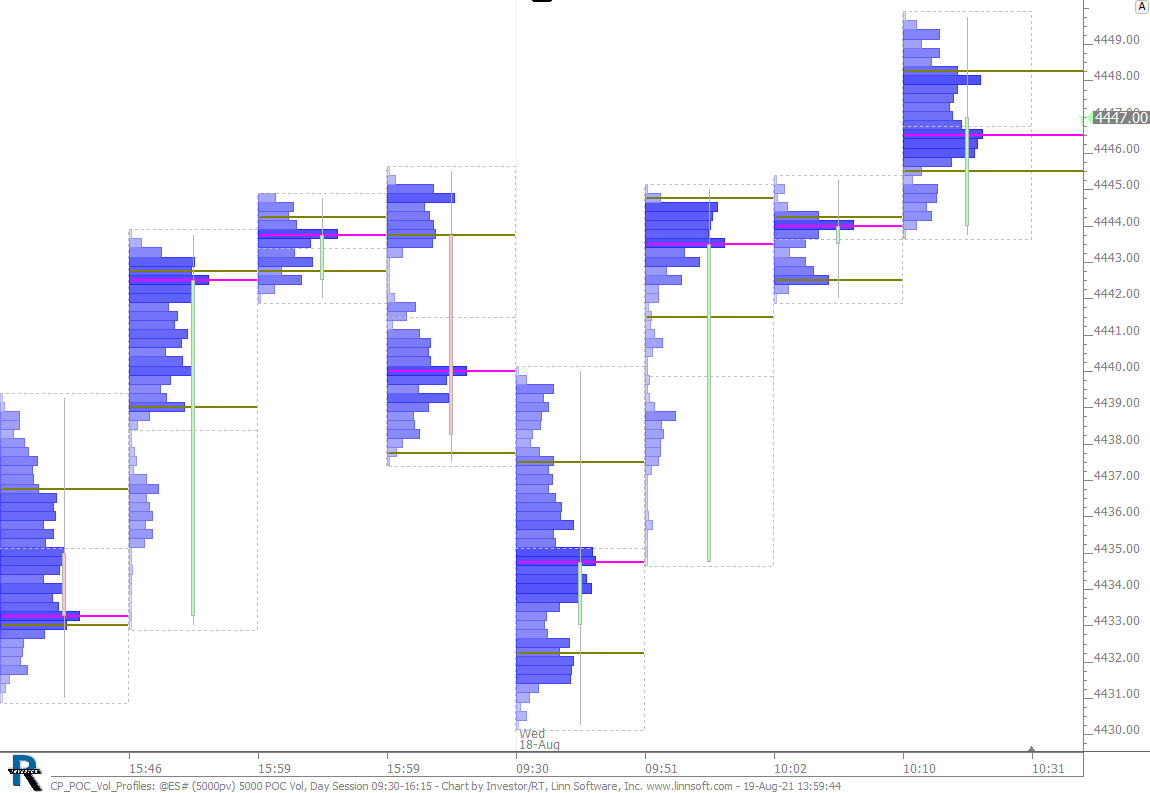 |
CP POC Vol Profiles (@ES#) cpayne [totalcount]
4 years 11 months ago
Profiles on POC Volume. This chart was uploaded by Investor/RT 15.1.1 showing symbol: @ES#. |
View |
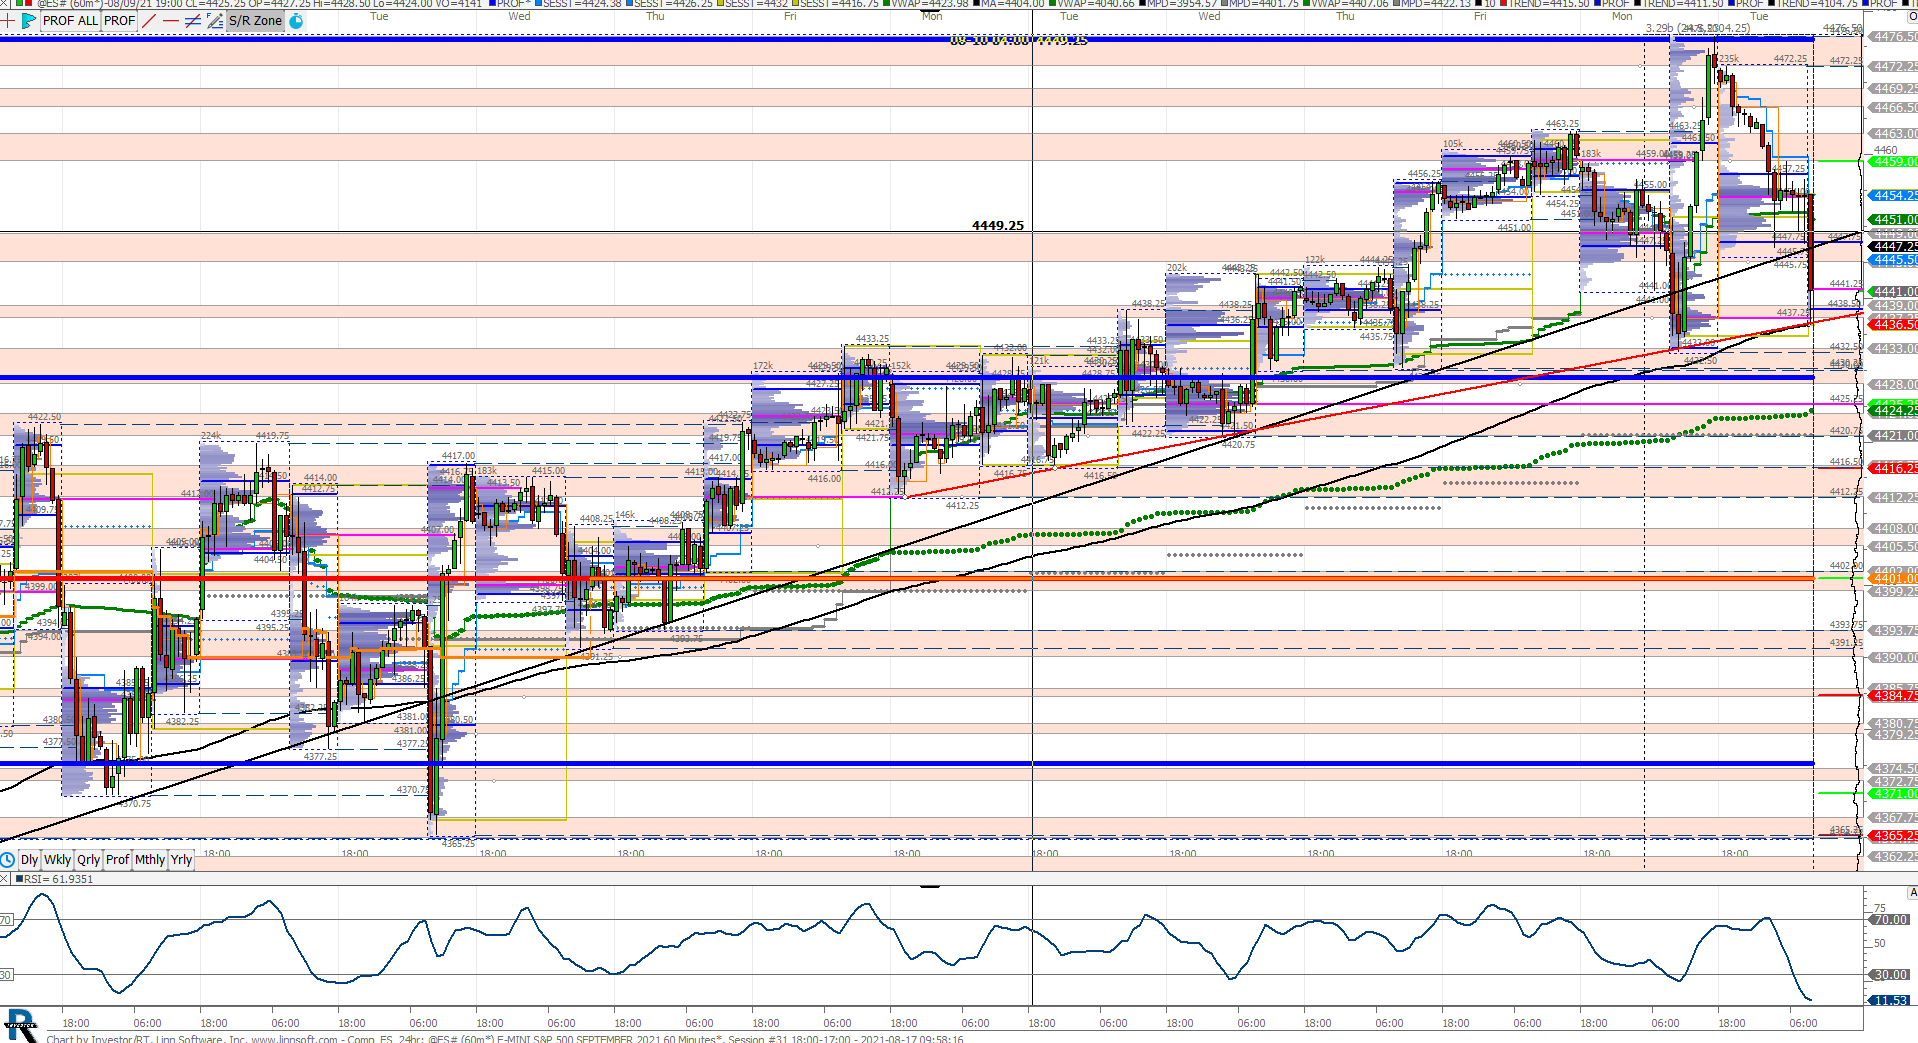 |
Comp ES 24hr (@ES#) npettinato [totalcount]
4 years 11 months ago
This chart was uploaded by Investor/RT 13.5.19 showing symbol: @ES#. |
View |
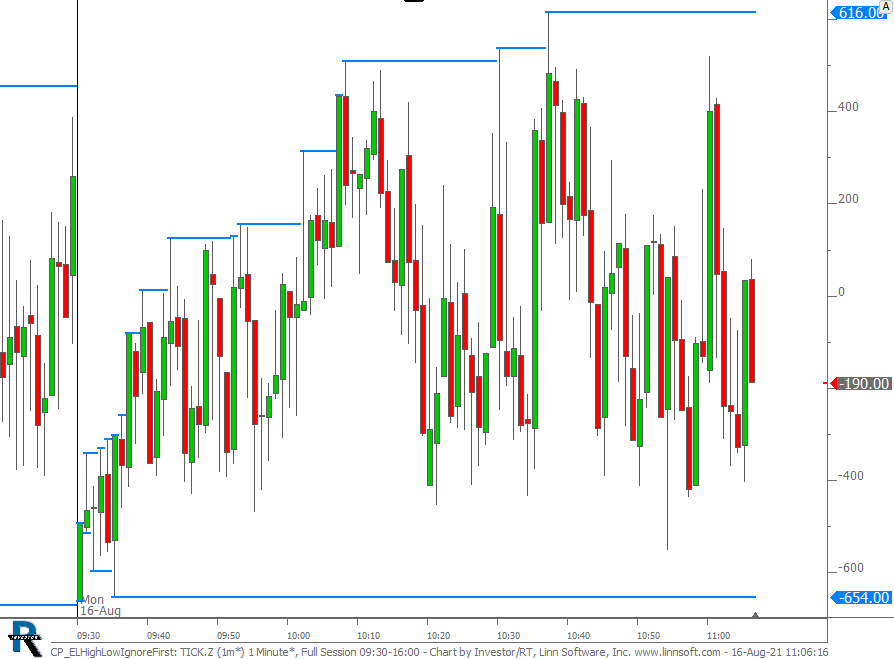 |
CP ELHighLowIgnoreFirst (TICK.Z) cpayne [totalcount]
4 years 11 months ago
This chart was uploaded by Investor/RT 15.1.1 showing symbol: TICK.Z. |
View |
 |
TPOWeekly Rainbowb (ESU1) ES42 [totalcount]
4 years 11 months ago
This chart was uploaded by Investor/RT 14.2.6 showing symbol: ESU1. |
View |
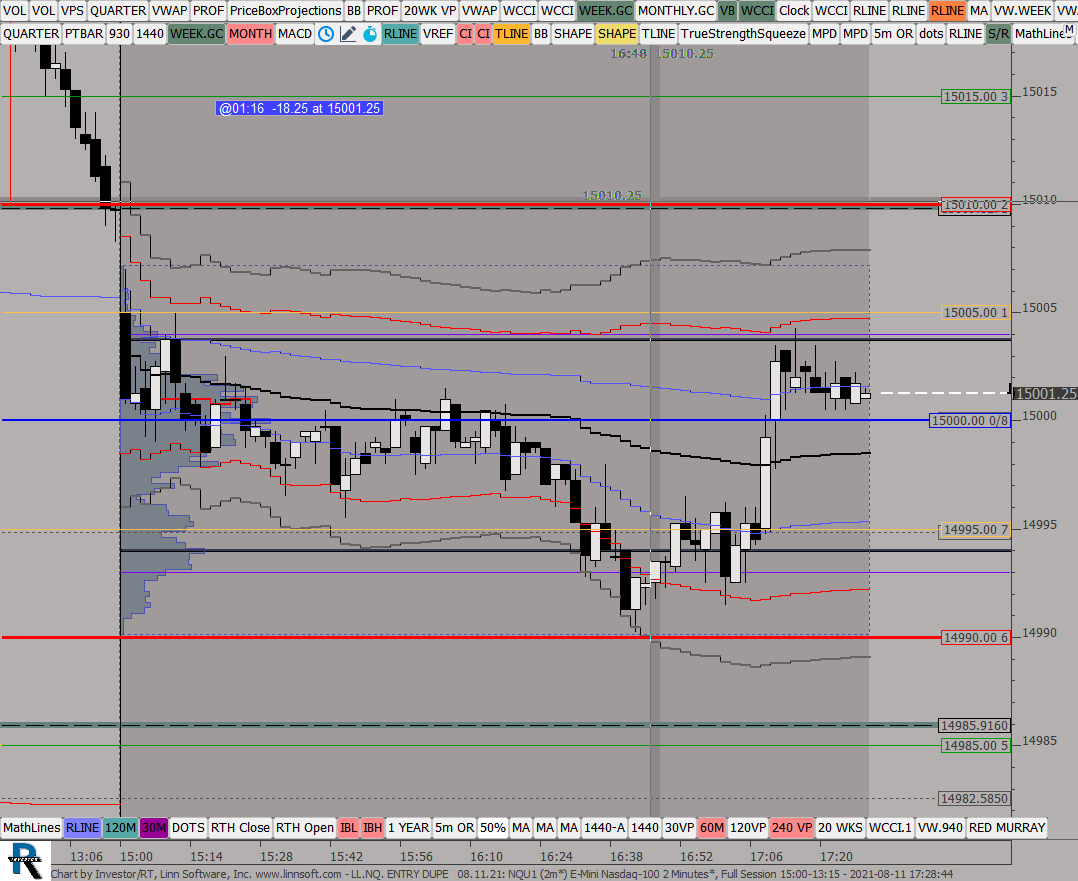 |
LLNQ ENTRY DUPE (NQU1) ES42 [totalcount]
4 years 11 months ago
This chart was uploaded by Investor/RT 14.2.6 showing symbol: NQU1. |
View |
 |
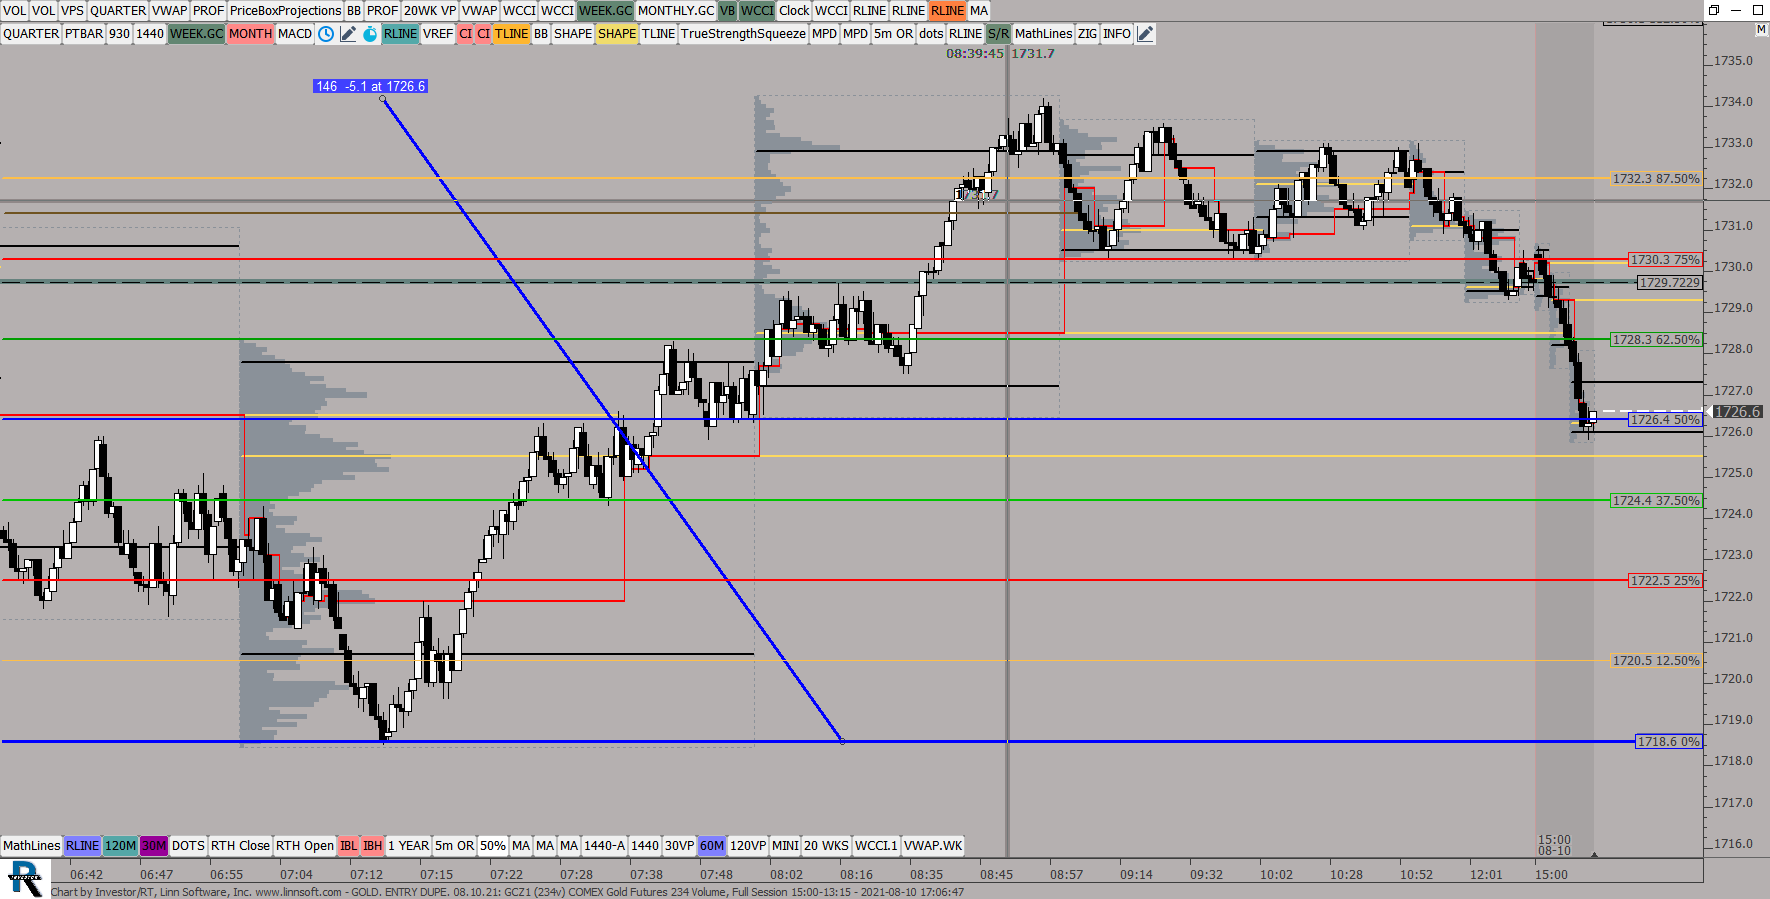
GOLDENTRY DUPE (GCZ1) ES42 [totalcount]
4 years 11 months ago
This chart was uploaded by Investor/RT 14.2.6 showing symbol: GCZ1. |
View |
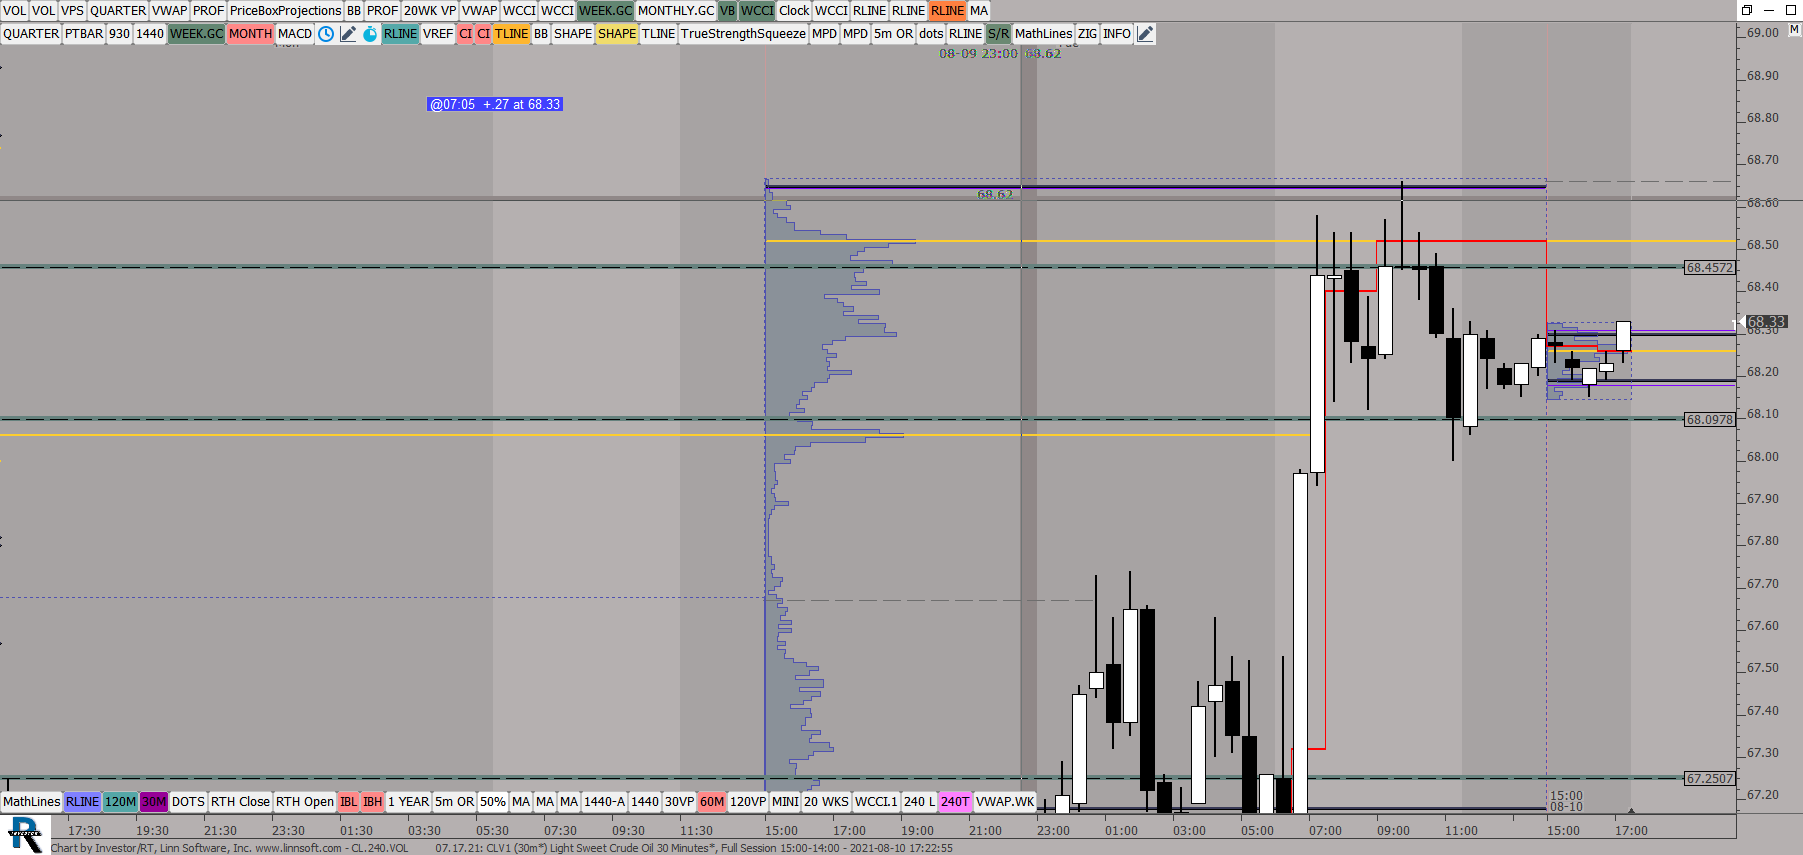 |
CL240VOL (CLV1) ES42 [totalcount]
4 years 11 months ago
This chart was uploaded by Investor/RT 14.2.6 showing symbol: CLV1. |
View |
 |
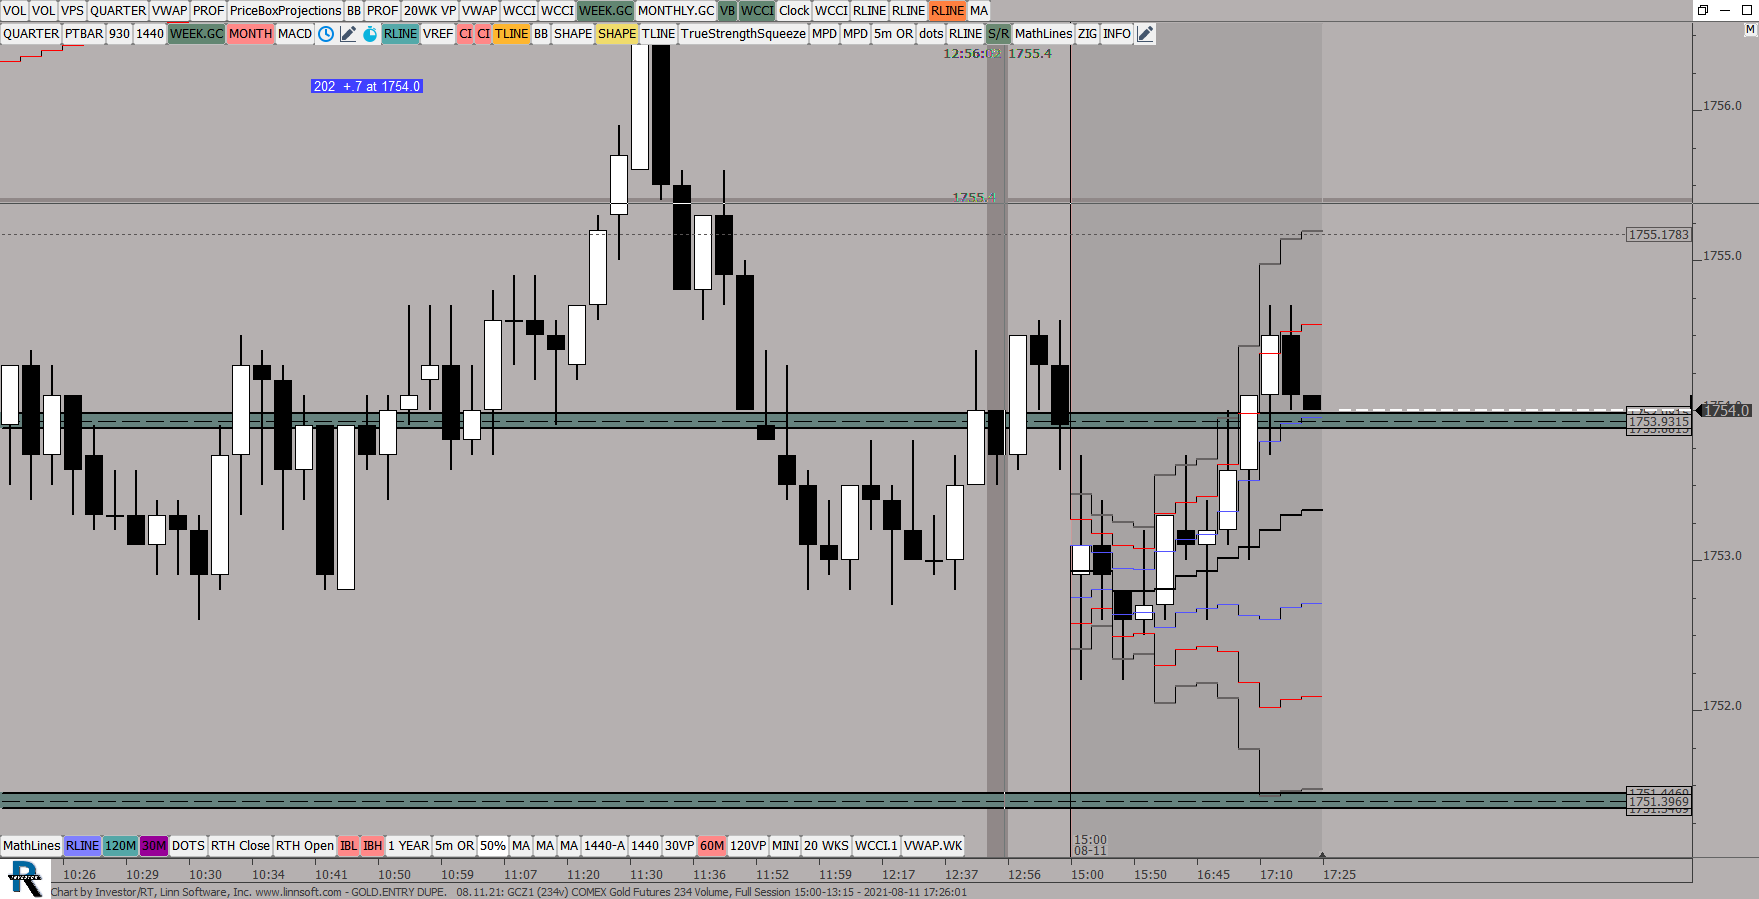
GOLD ENTRY DUPE (GCZ1) ES42 [totalcount]
4 years 11 months ago
This chart was uploaded by Investor/RT 14.2.6 showing symbol: GCZ1. |
View |
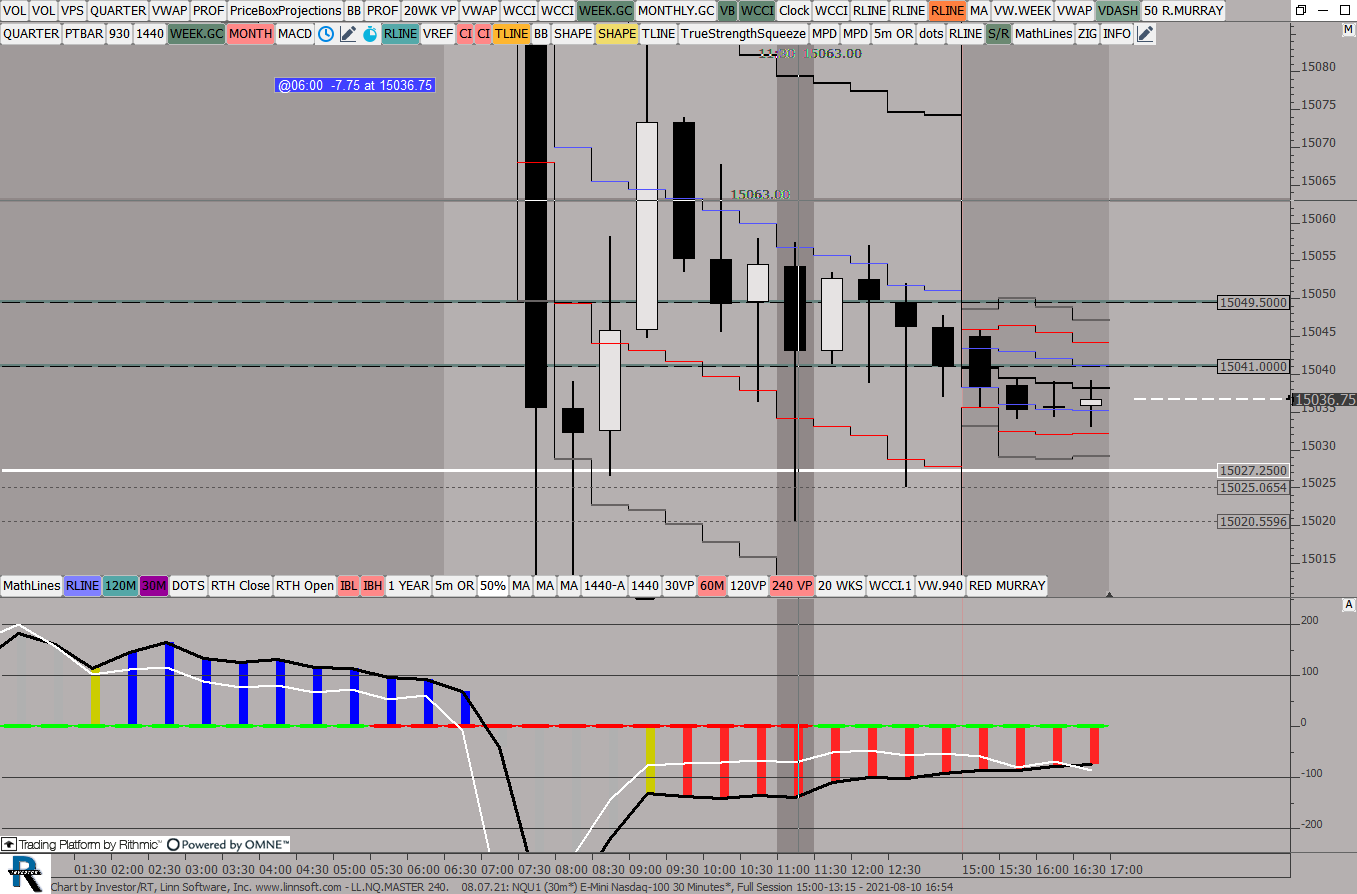 |
LLNQMASTER 240 (NQU1) ES42 [totalcount]
4 years 11 months ago
This chart was uploaded by Investor/RT 14.2.6 showing symbol: NQU1. |
View |
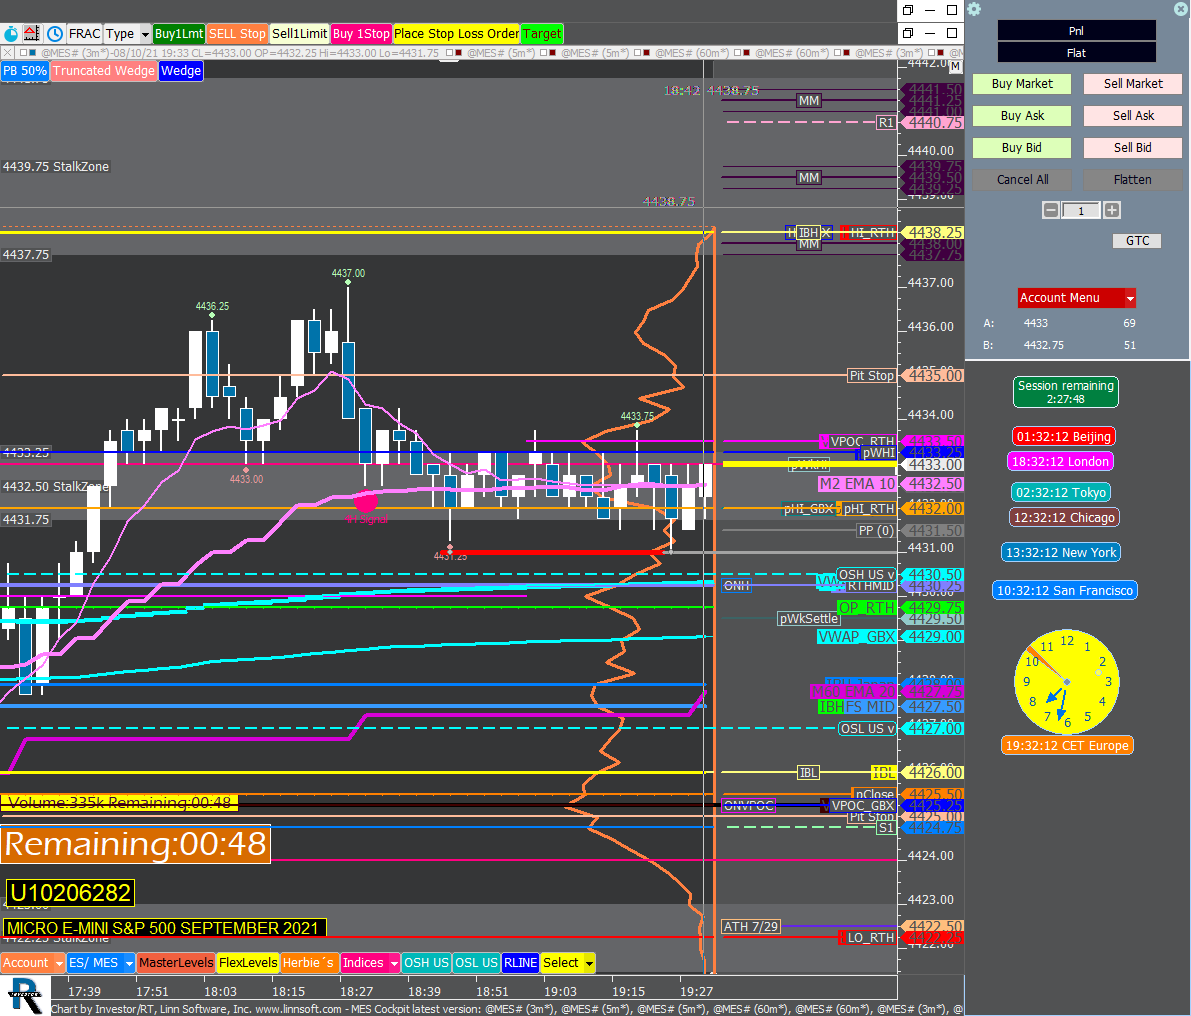 |
MES Cockpit latest version (@MES#) Herbert Ritsch [totalcount]
4 years 11 months ago
plotting lines. This chart was uploaded by Investor/RT 14.2.6 showing symbol: @MES#. |
View |
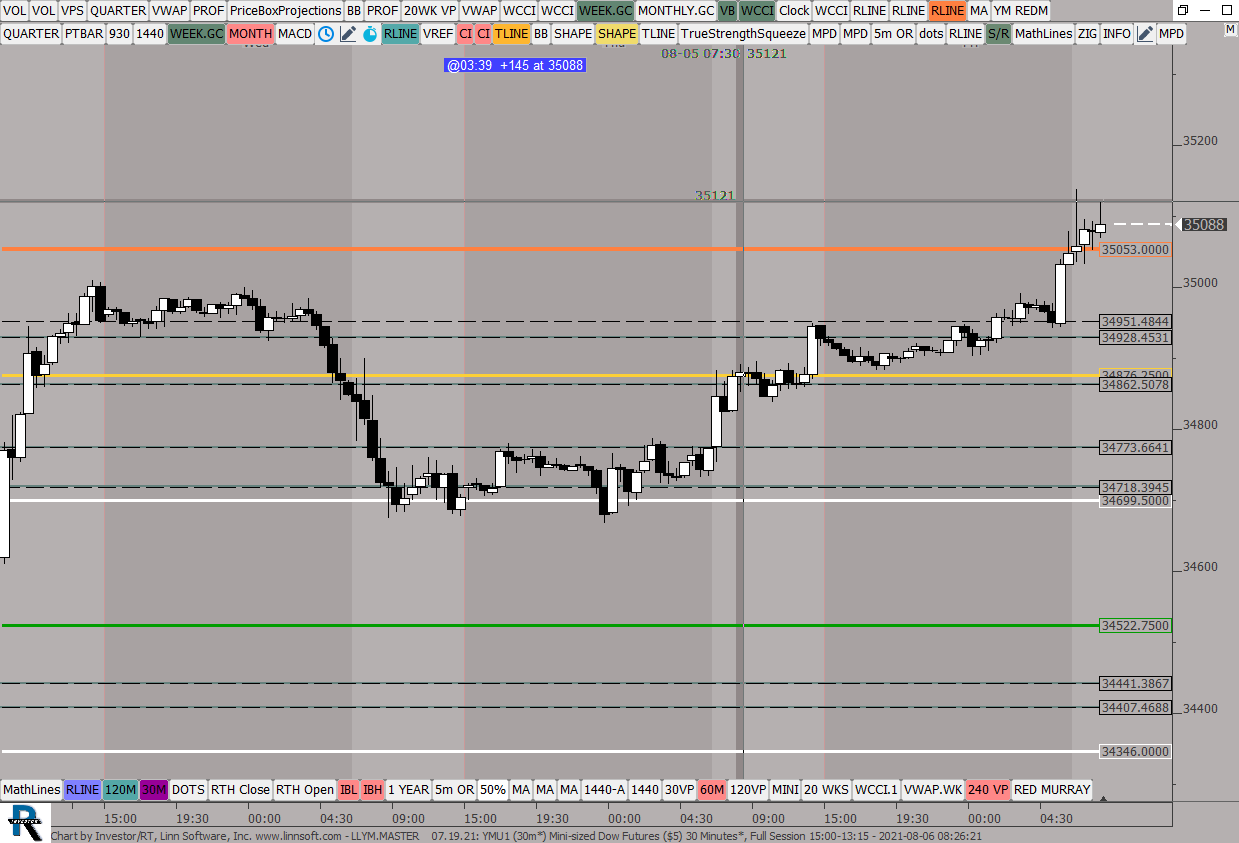 |
LLYMMASTER (YMU1) ES42 [totalcount]
4 years 11 months ago
This chart was uploaded by Investor/RT 14.2.6 showing symbol: YMU1. |
View |
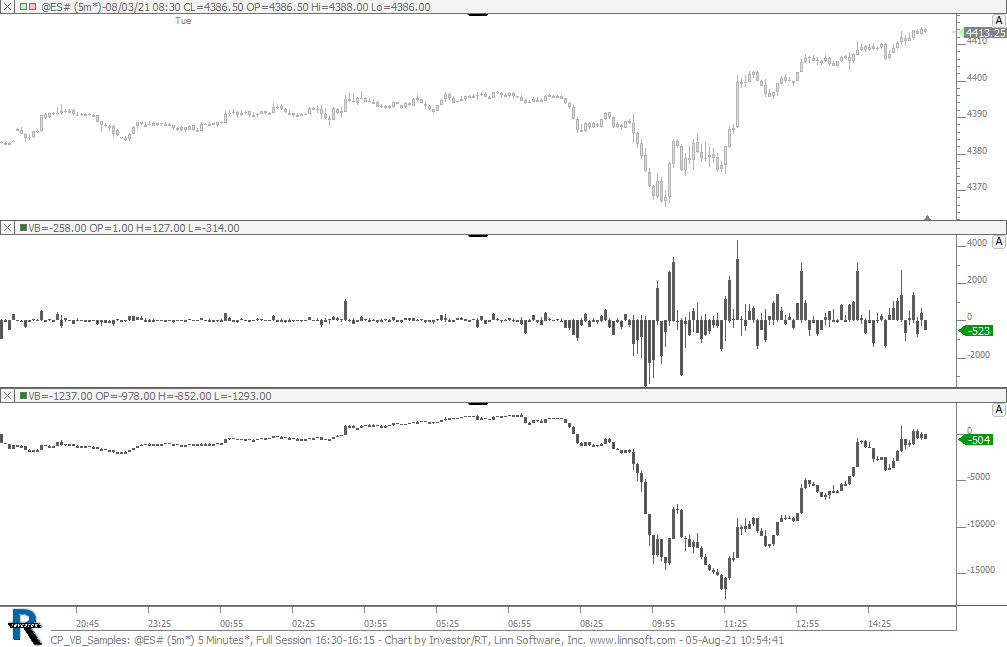 |
CP VB Samples (@ES#) cpayne [totalcount]
4 years 11 months ago
Volume Breakdown Examples. This chart was uploaded by Investor/RT 15.1.1 showing symbol: @ES#. |
View |
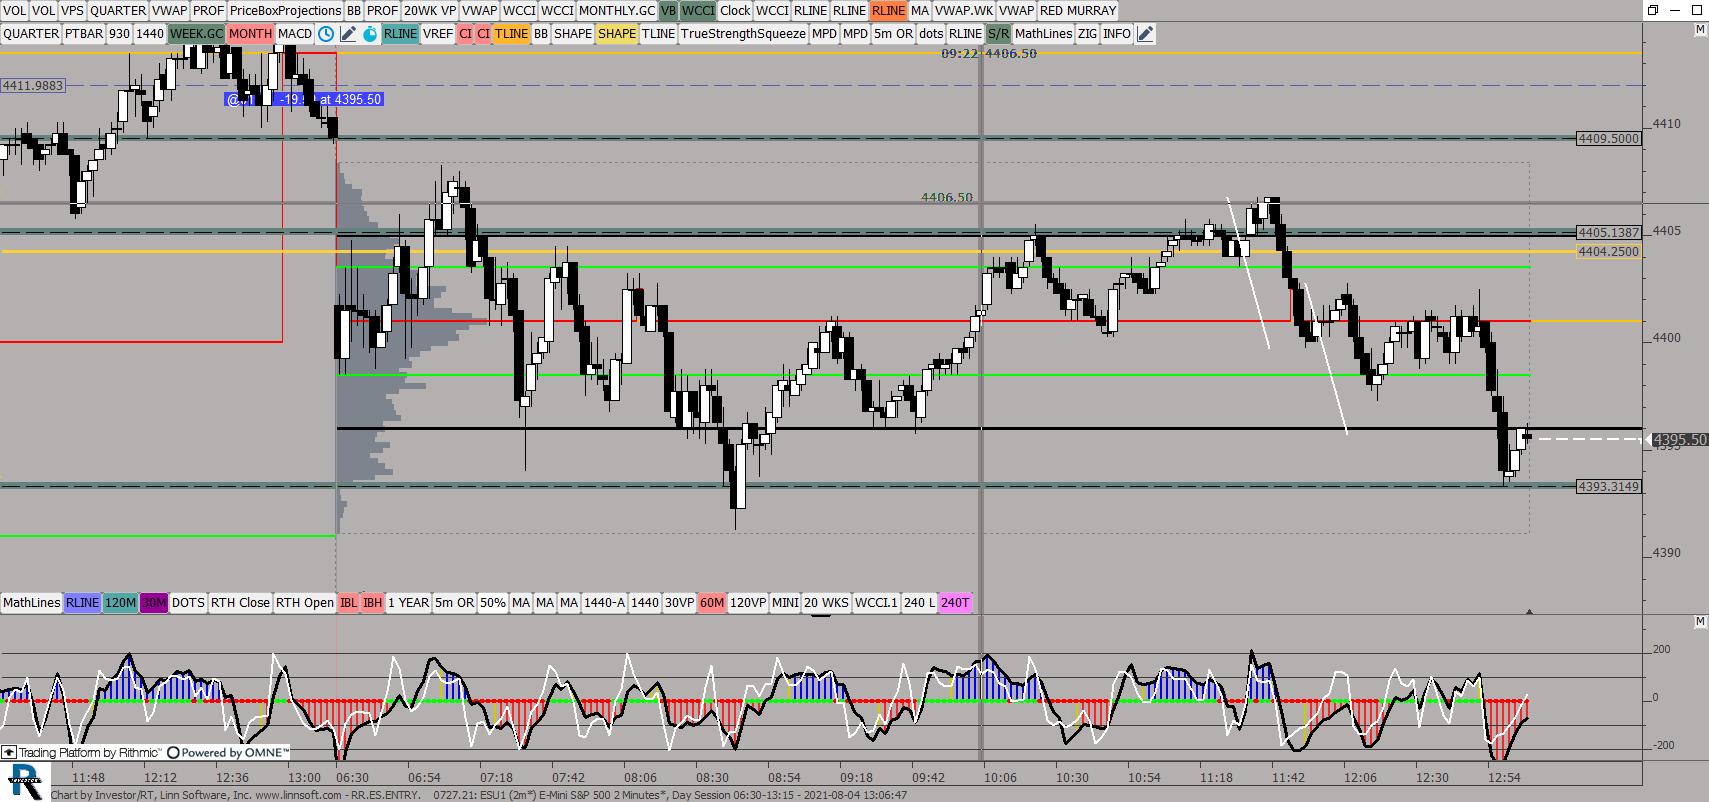 |
RRESENTRY (ESU1) ES42 [totalcount]
4 years 12 months ago
This chart was uploaded by Investor/RT 14.2.6 showing symbol: ESU1. |
View |
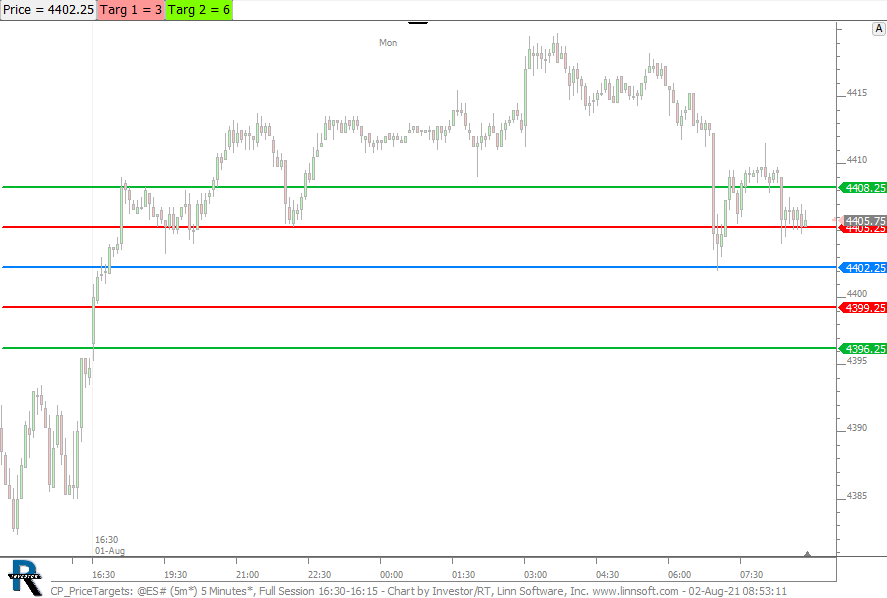 |
CP PriceTargets (@ES#) cpayne [totalcount]
4 years 12 months ago
Price Targets using C Buttons. This chart was uploaded by Investor/RT 15.1.1 showing symbol: @ES#. |
View |
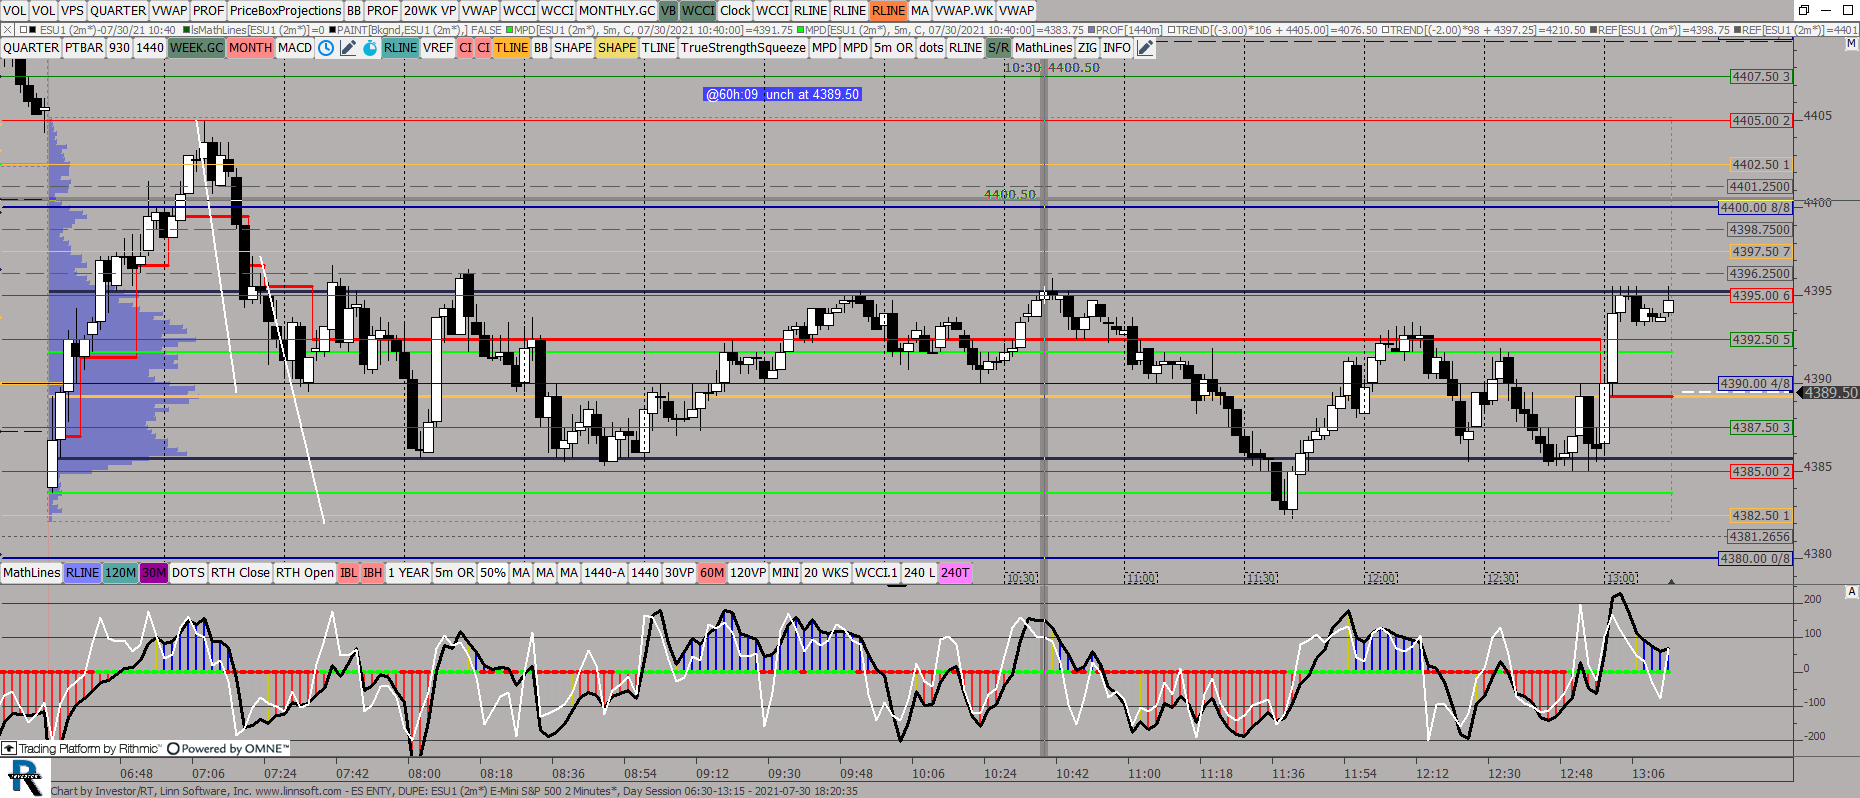 |
ES ENTY DUPE (ESU1) ES42 [totalcount]
5 years 2 hours ago
Murray Math Stock. This chart was uploaded by Investor/RT 14.2.6 showing symbol: ESU1. |
View |
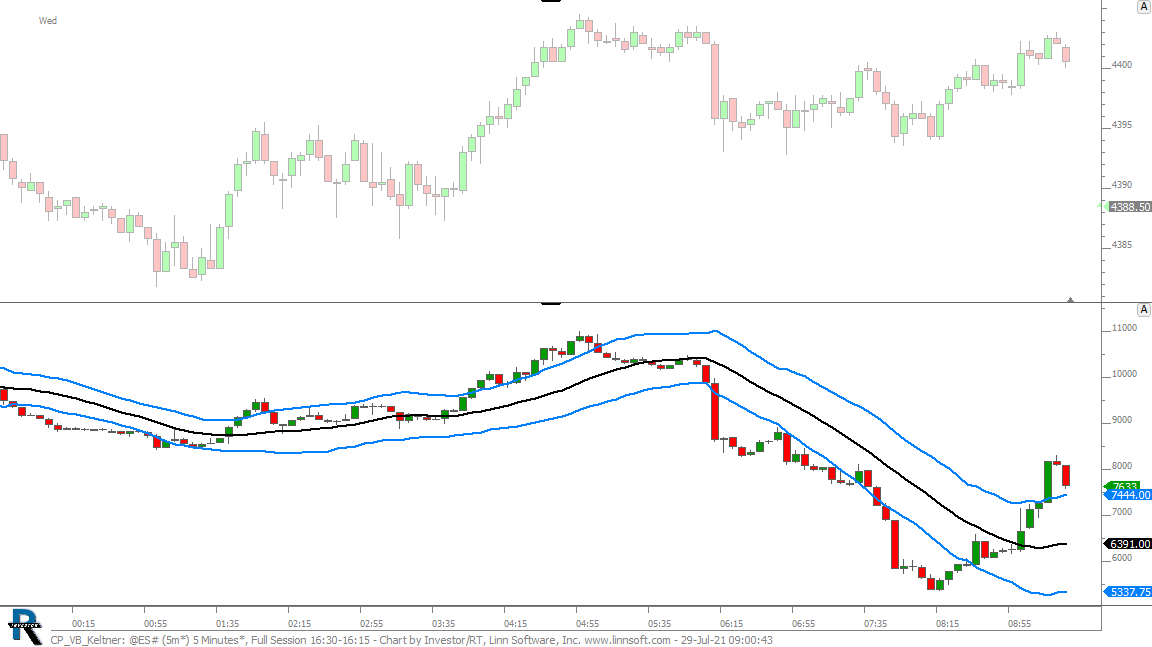 |
CP VB Keltner (@ES#) cpayne [totalcount]
5 years 1 day ago
Keltner Channels on cumulative delta using custom indicator. This chart was uploaded by Investor/RT 14.2.7 showing symbol: @ES#. |
View |
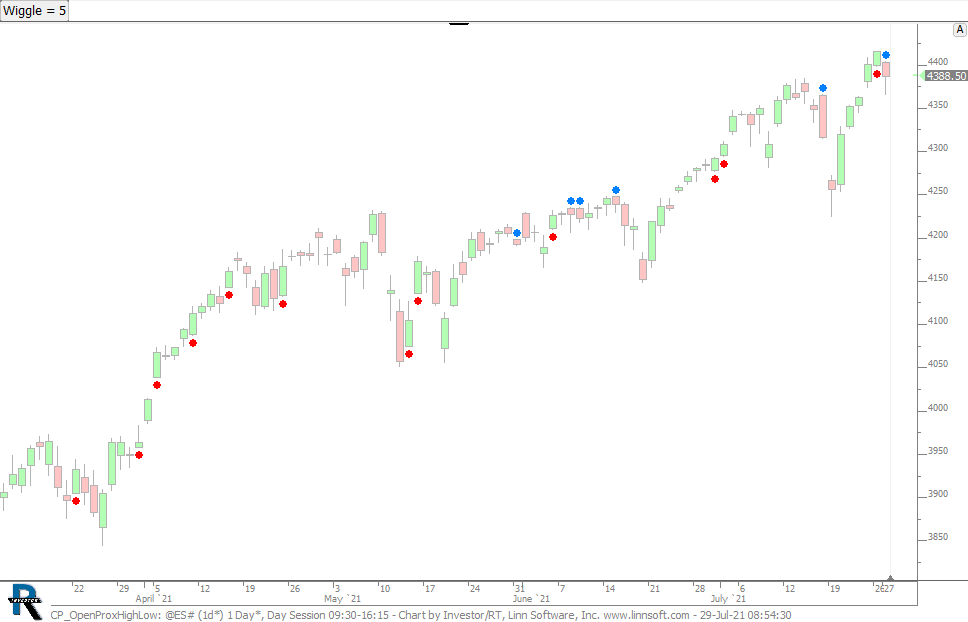 |
CP OpenProxHighLow (@ES#) cpayne [totalcount]
5 years 1 day ago
Open close to high or low. This chart was uploaded by Investor/RT 14.2.7 showing symbol: @ES#. |
View |
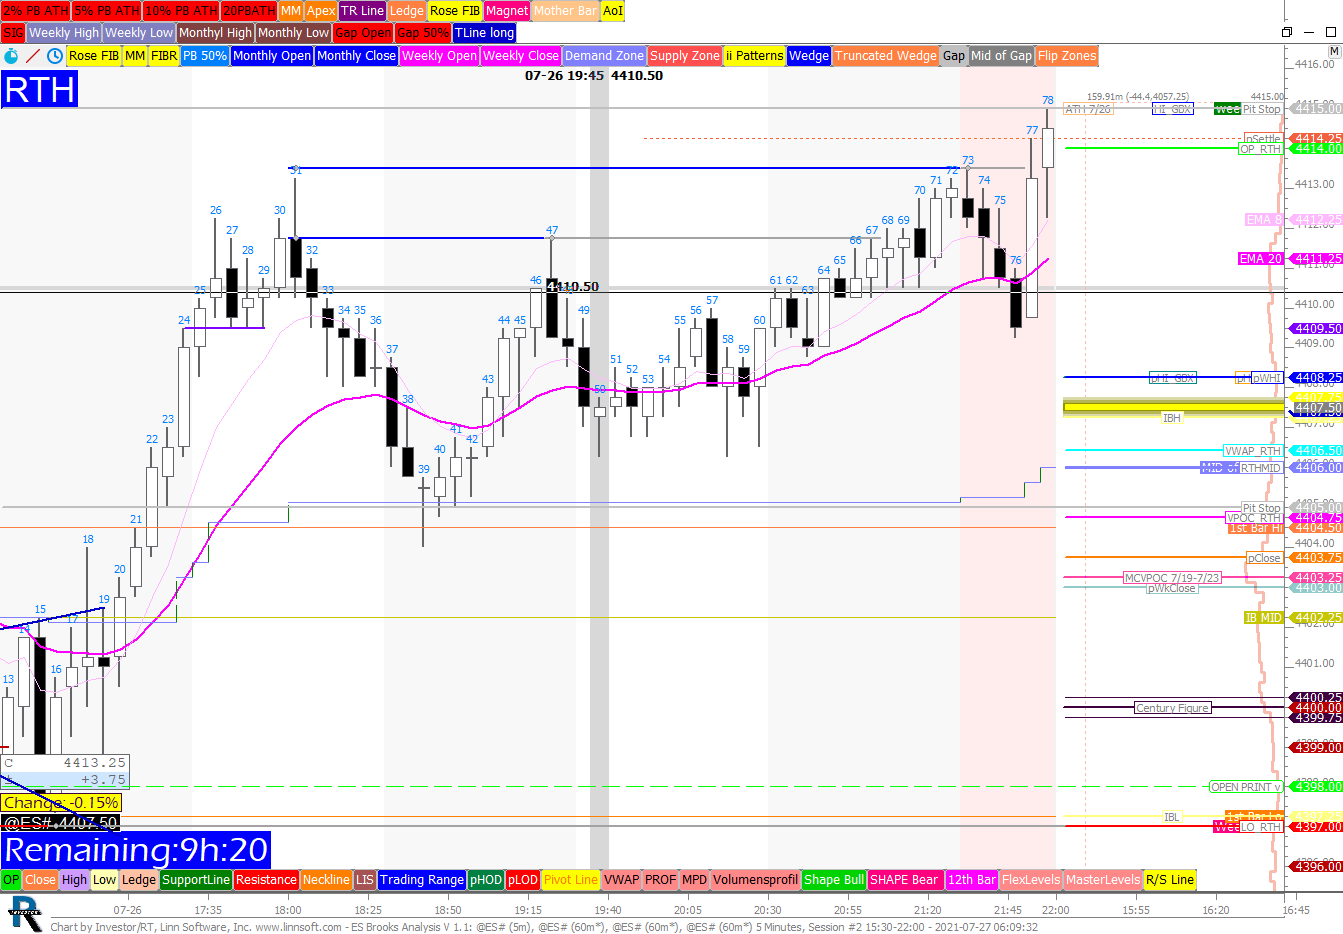 |
ES Brooks Analysis V 11 (@ES#) Herbert Ritsch [totalcount]
5 years 3 days ago
Hello, for some reason I "lost" the lines on the chart, when plotting trend lines etc. |
View |