 |
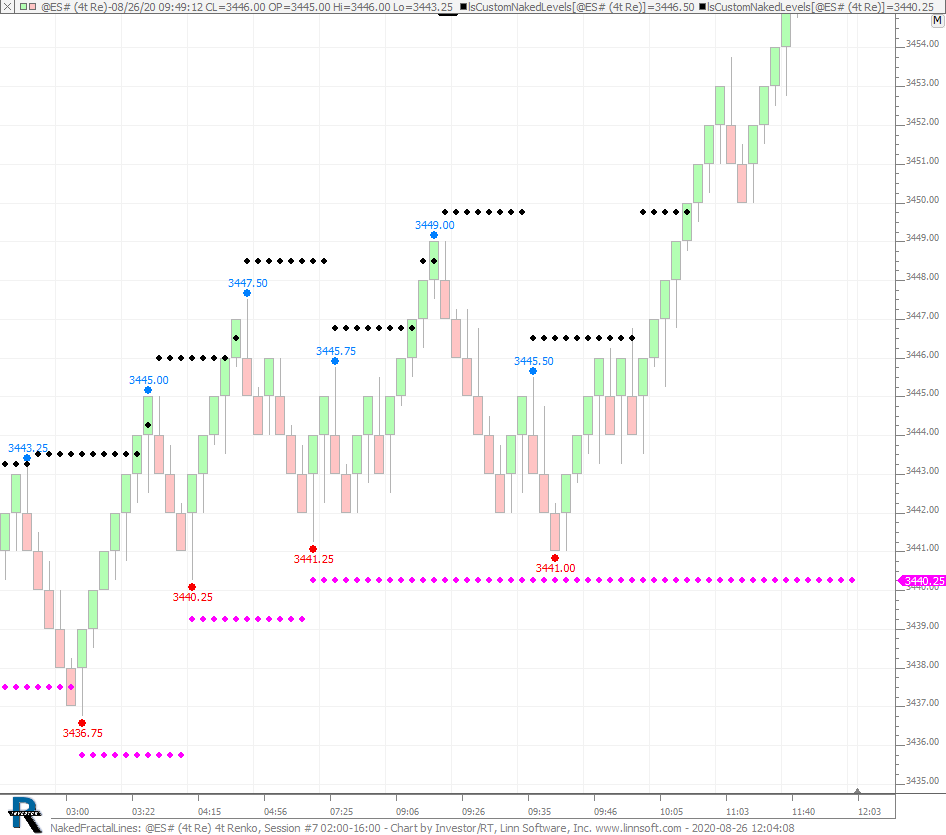
NakedFractalLines (@ES#) william-linn [totalcount]
5 years 3 months ago
Sample Chart for CustomNakedLevels RTX Extension. This chart was uploaded by Investor/RT 14.1.5 showing symbol: @ES#. |
View |
 |
ESDAY BARS02b (GCH1) ES42 [totalcount]
4 years 11 months ago
This chart was uploaded by Investor/RT 14.2.5 showing symbol: GCH1. |
View |
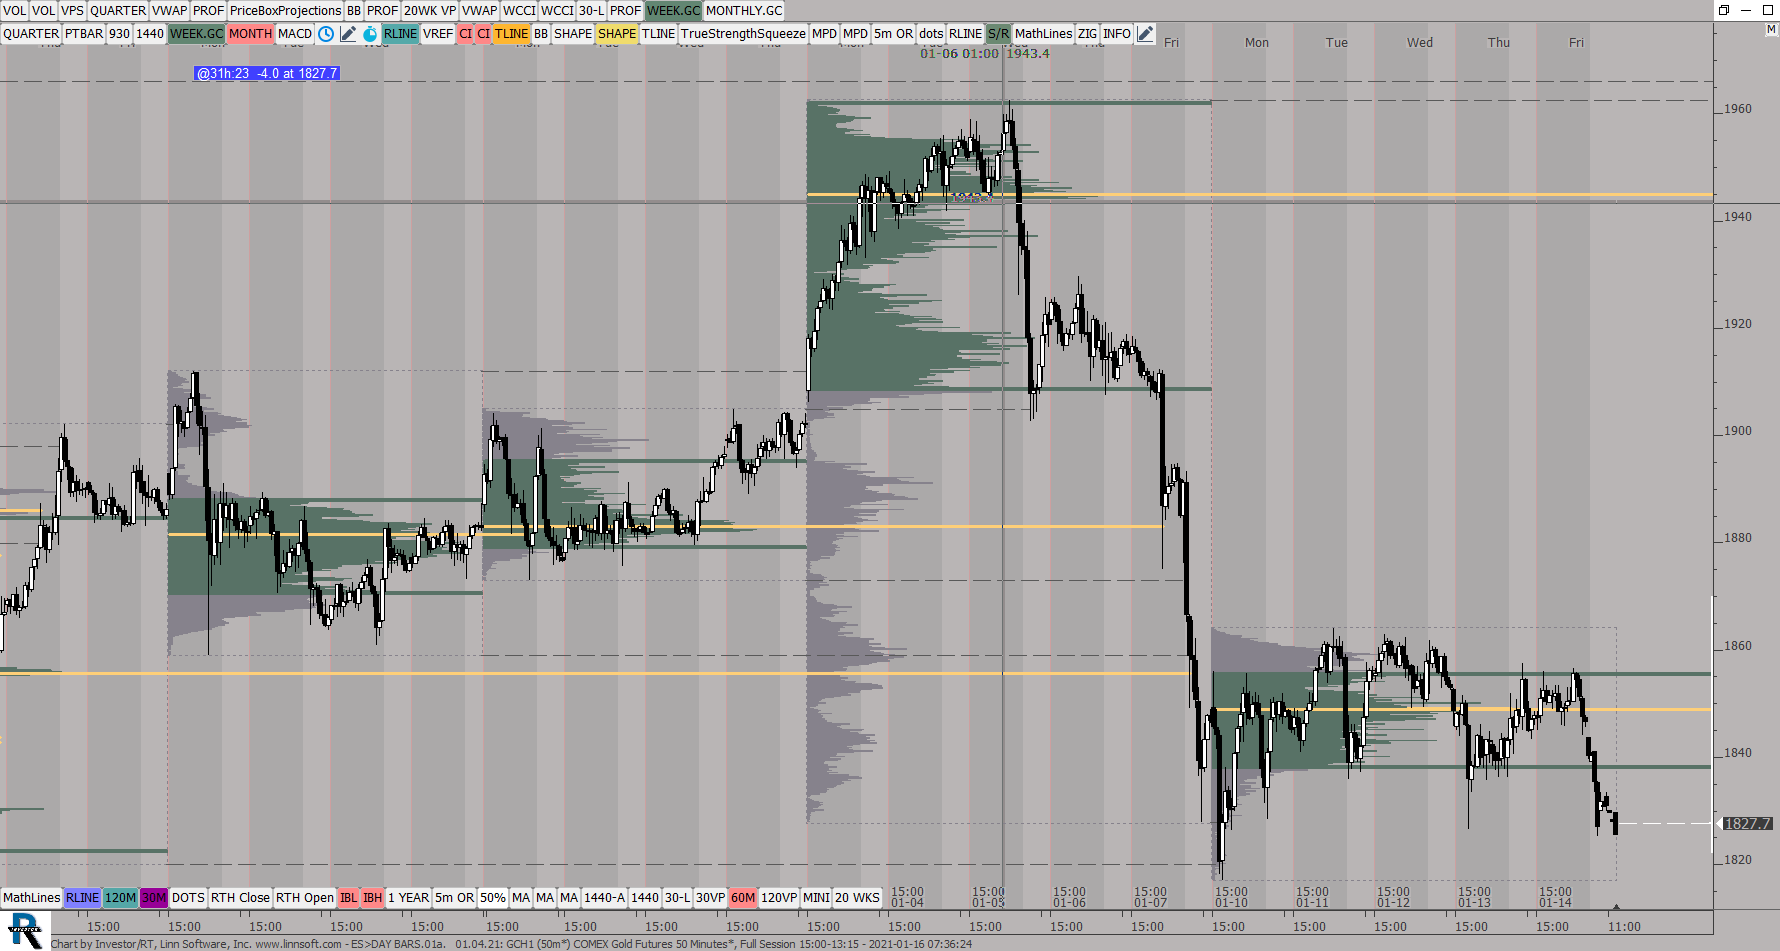 |
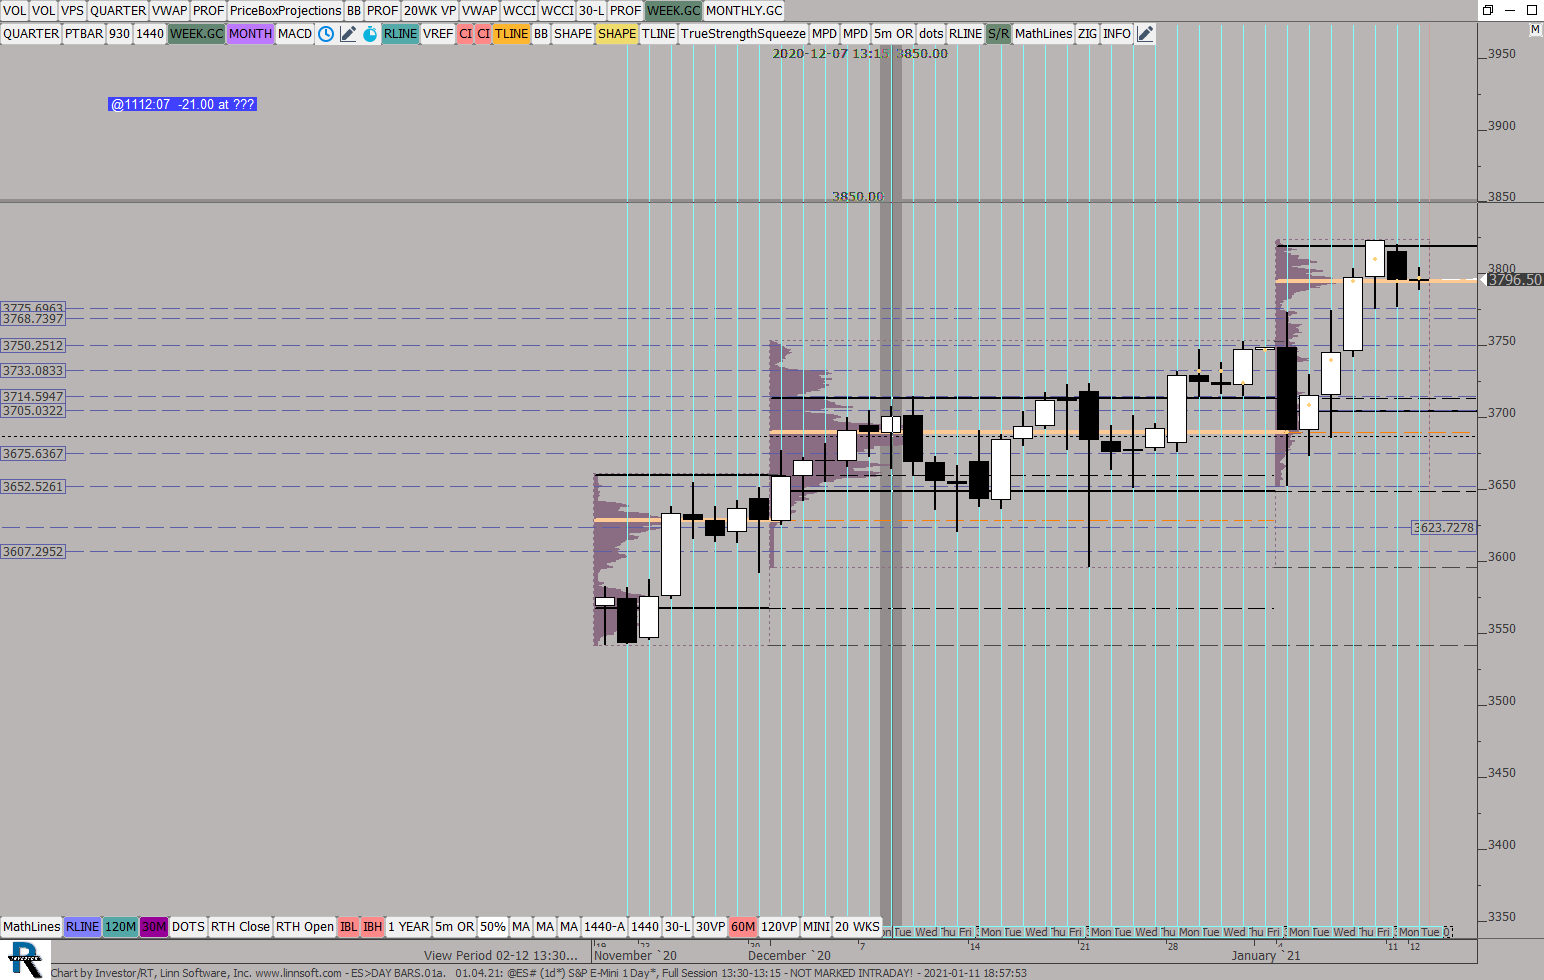
ESDAY BARS01a (GCH1) ES42 [totalcount]
4 years 11 months ago
This chart was uploaded by Investor/RT 14.2.5 showing symbol: GCH1. |
View |
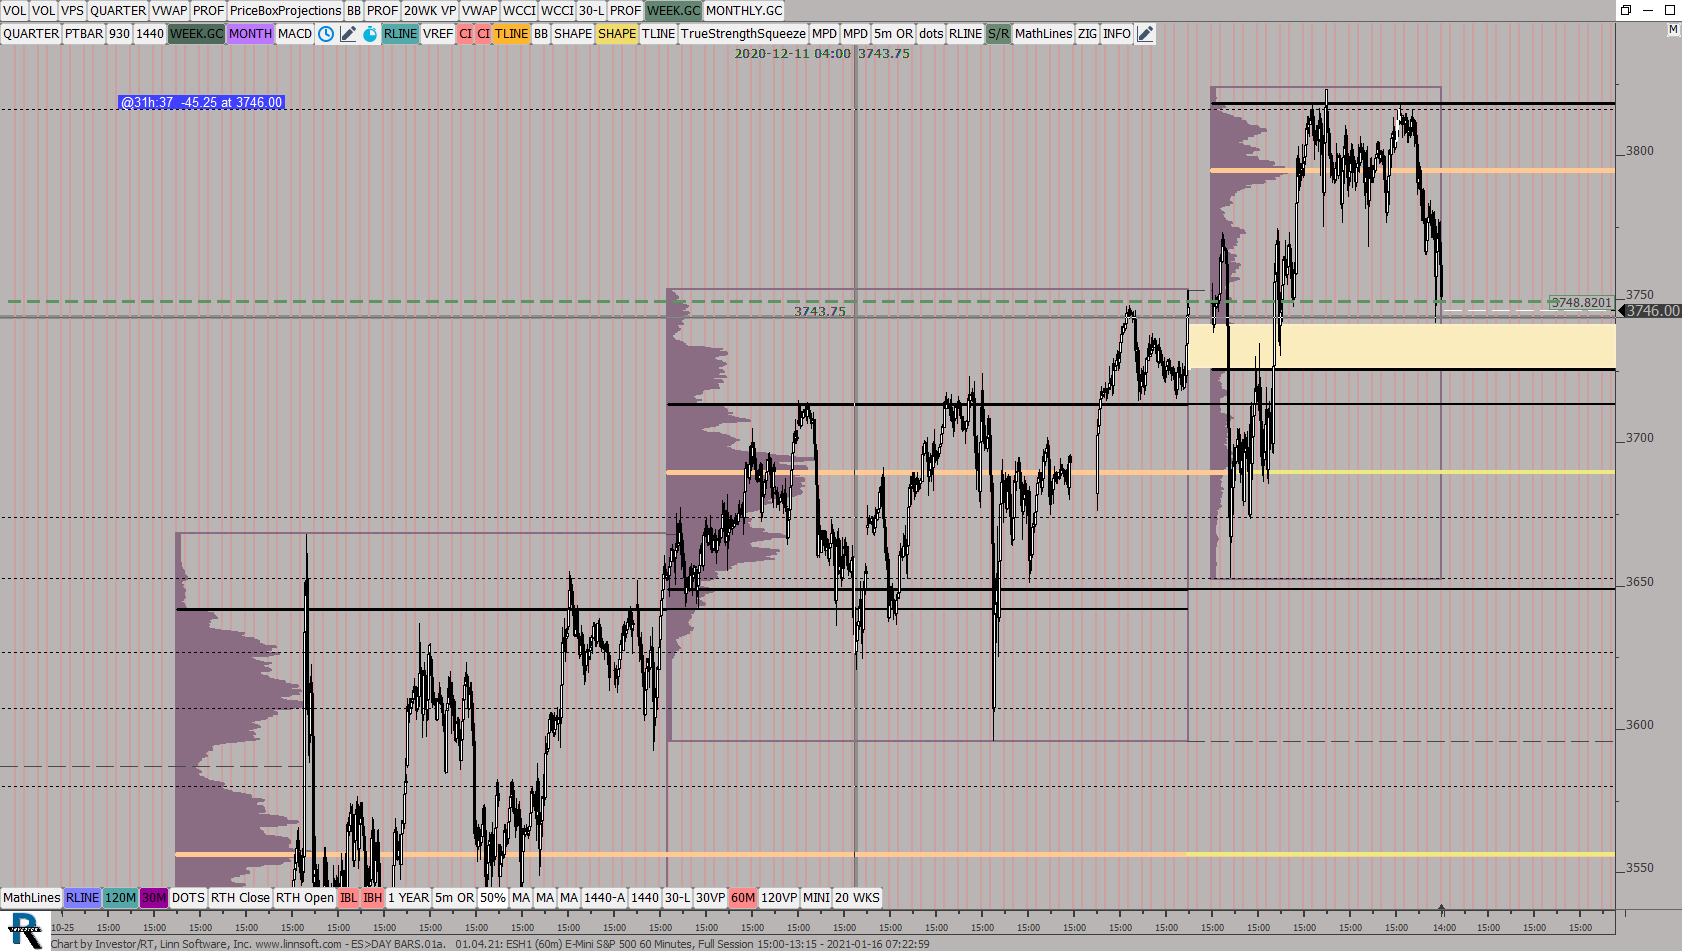 |
ESDAY BARS01a (ESH1) ES42 [totalcount]
4 years 11 months ago
This chart was uploaded by Investor/RT 14.2.5 showing symbol: ESH1. |
View |
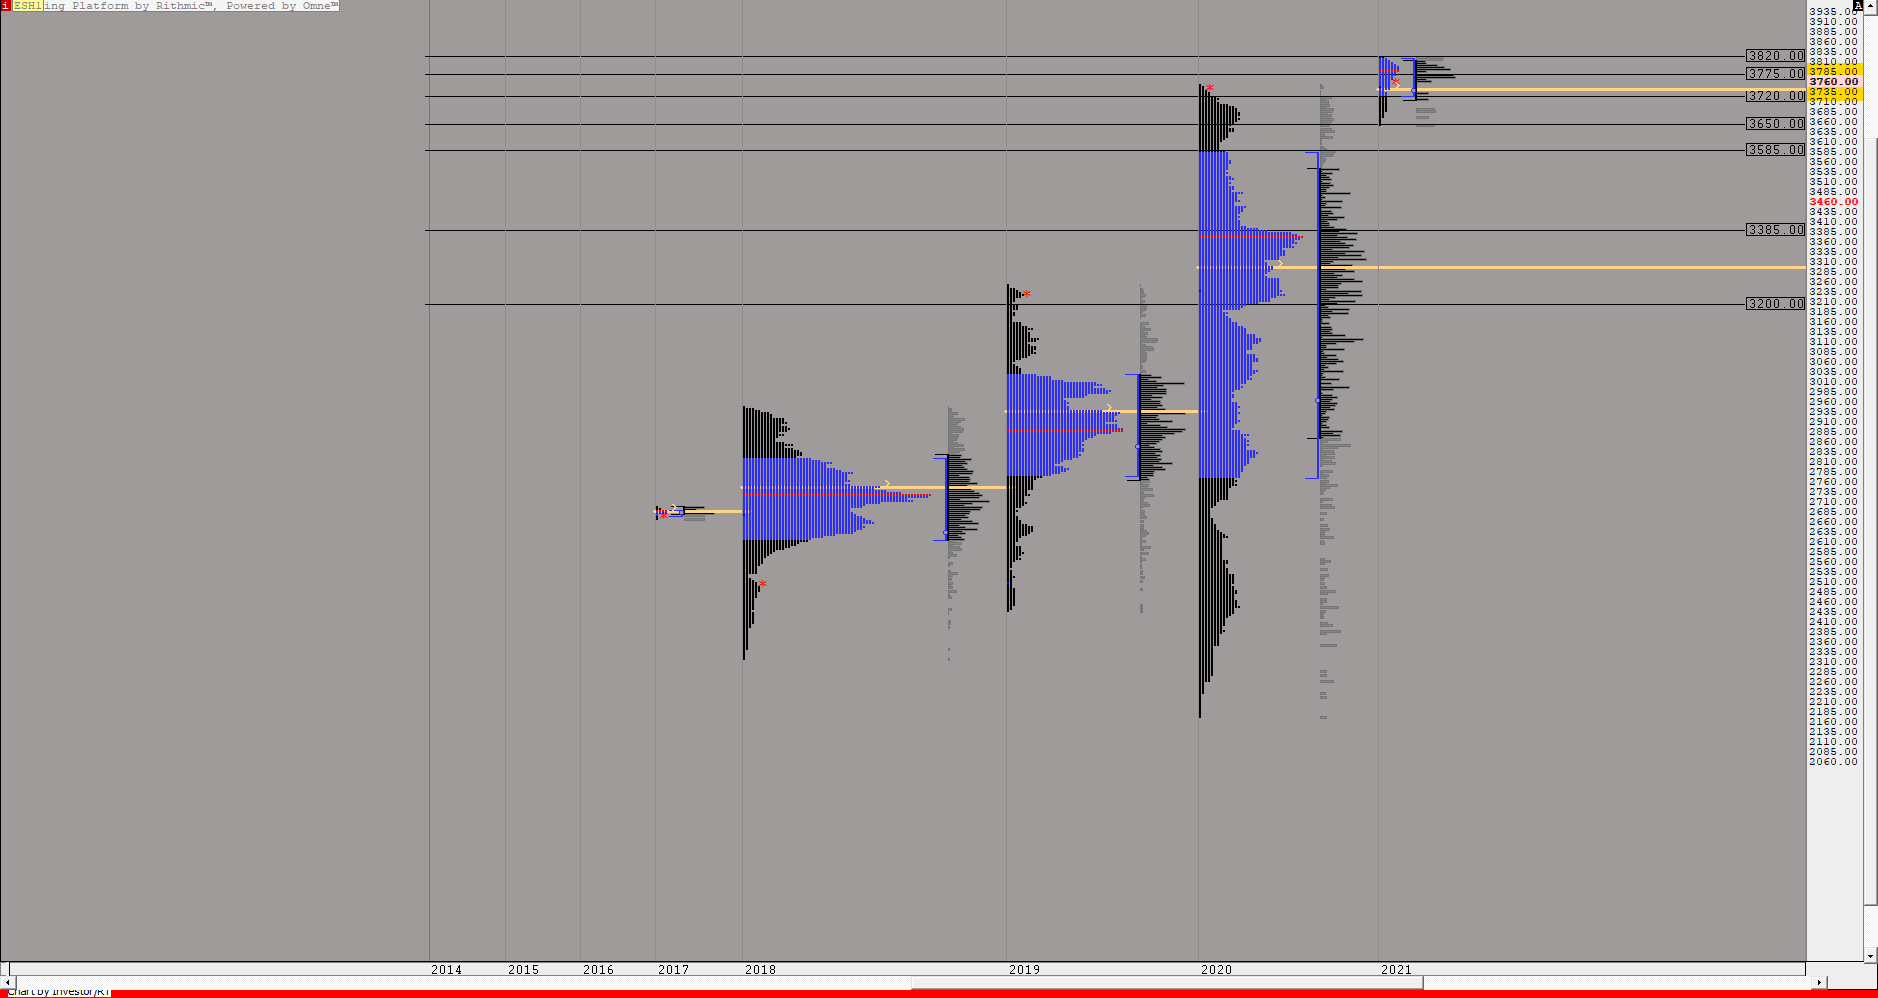 |
MP YEARLYINDEXES02a (ESH1) ES42 [totalcount]
4 years 11 months ago
This chart was uploaded by Investor/RT 14.2.5 showing symbol: ESH1. |
View |
 |
MP YEARLYINDEXES02 12 29 (ESH1) ES42 [totalcount]
4 years 11 months ago
This chart was uploaded by Investor/RT 14.2.5 showing symbol: ESH1. |
View |
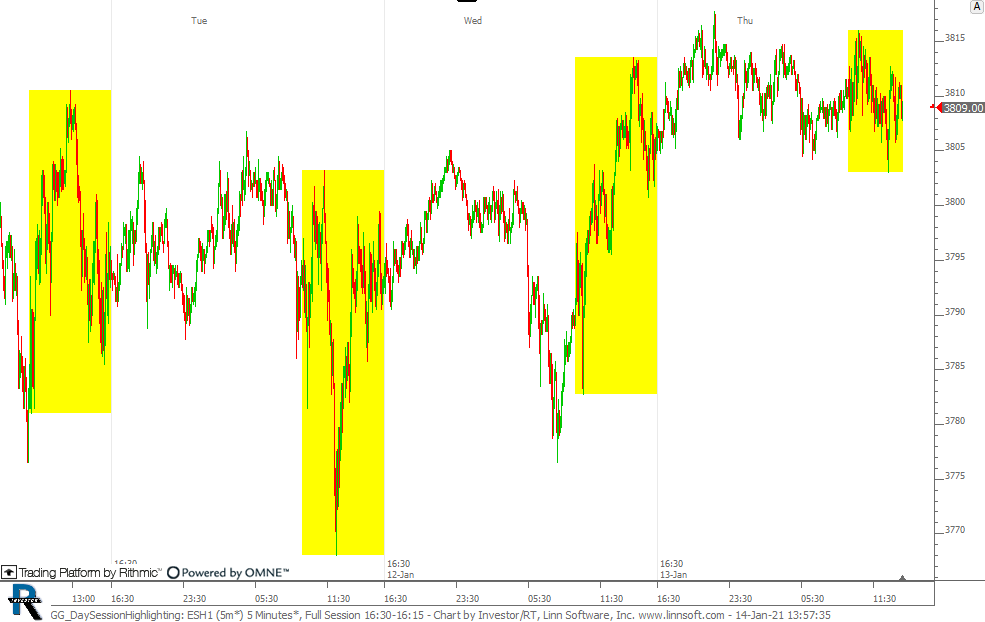 |
GG DaySessionHighlighting (ESH1) cpayne [totalcount]
4 years 11 months ago
Chart highlights the day session range in yellow. This chart was uploaded by Investor/RT 14.2.6 showing symbol: ESH1. |
View |
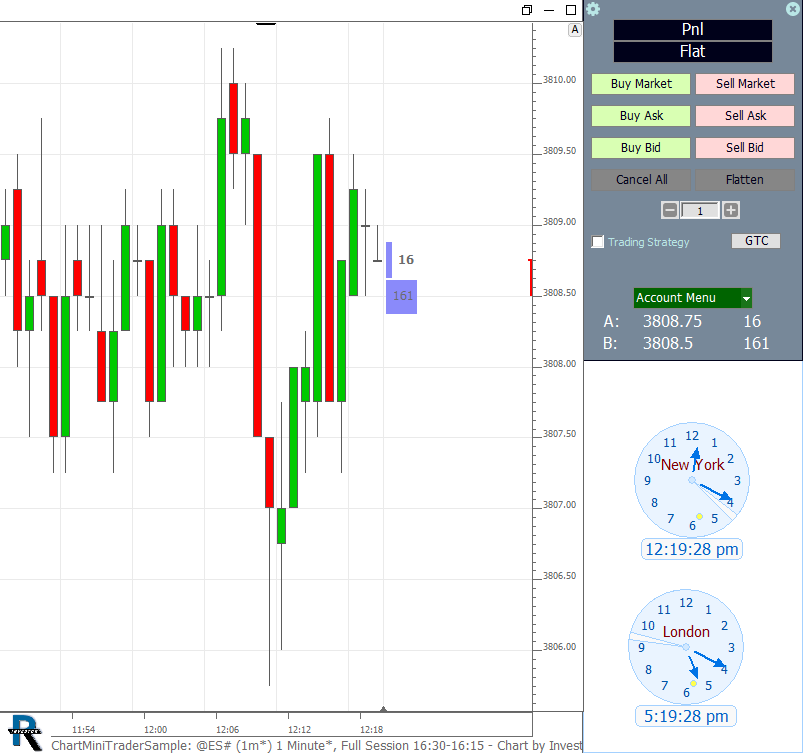 |
ChartMiniTraderSample (@ES#) william-linn [totalcount]
4 years 11 months ago
ChartMiniTrader RTX Sample Chart. This chart was uploaded by Investor/RT 14.2.6 showing symbol: @ES#. |
View |
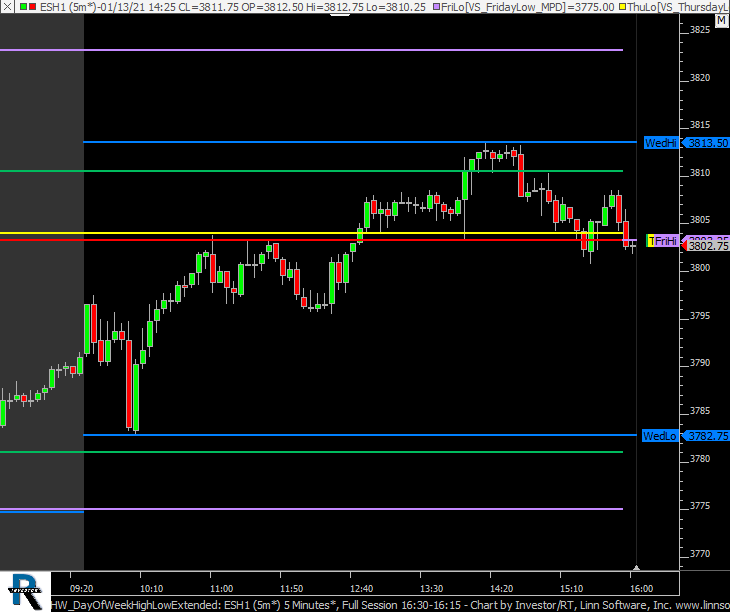 |
HW DayOfWeekHighLowExtended (ESH1) cpayne [totalcount]
4 years 11 months ago
The day session high and low of each day of the week is extended through the week until it resets on same day of week on following week. |
View |
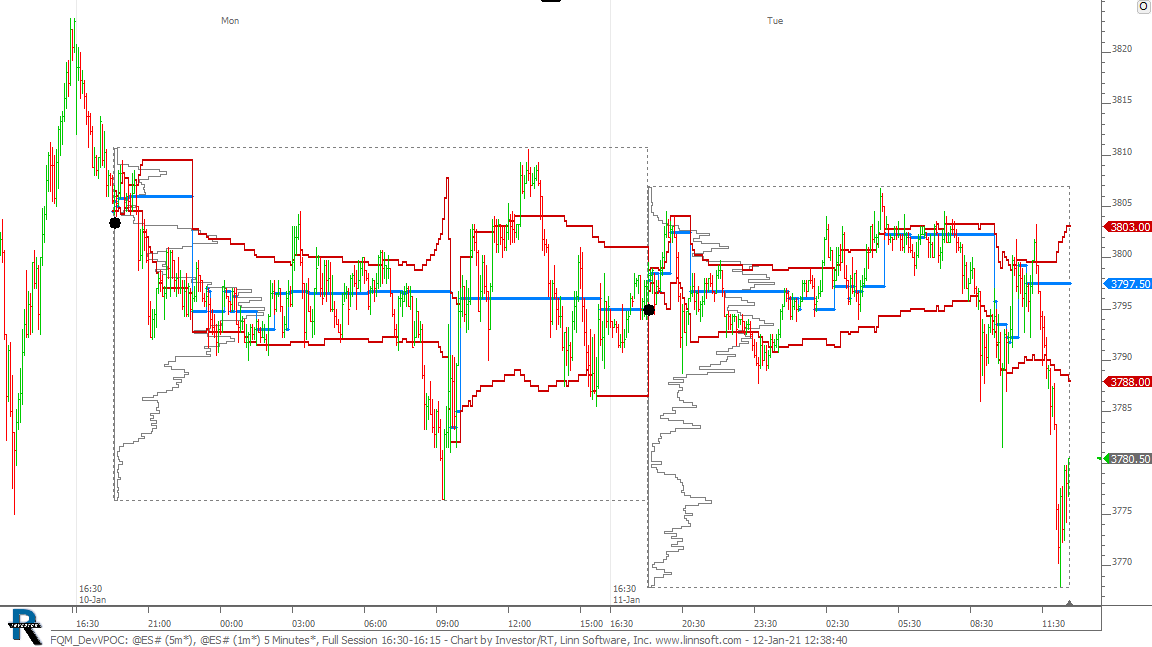 |
FQM DevVPOC (@ES#) cpayne [totalcount]
4 years 11 months ago
This chart was uploaded by Investor/RT 14.2.6 showing symbol: @ES#. |
View |
 |
ESDAY BARS01a (@ES#) ES42 [totalcount]
4 years 11 months ago
This chart was uploaded by Investor/RT 14.2.5 showing symbol: @ES#. |
View |
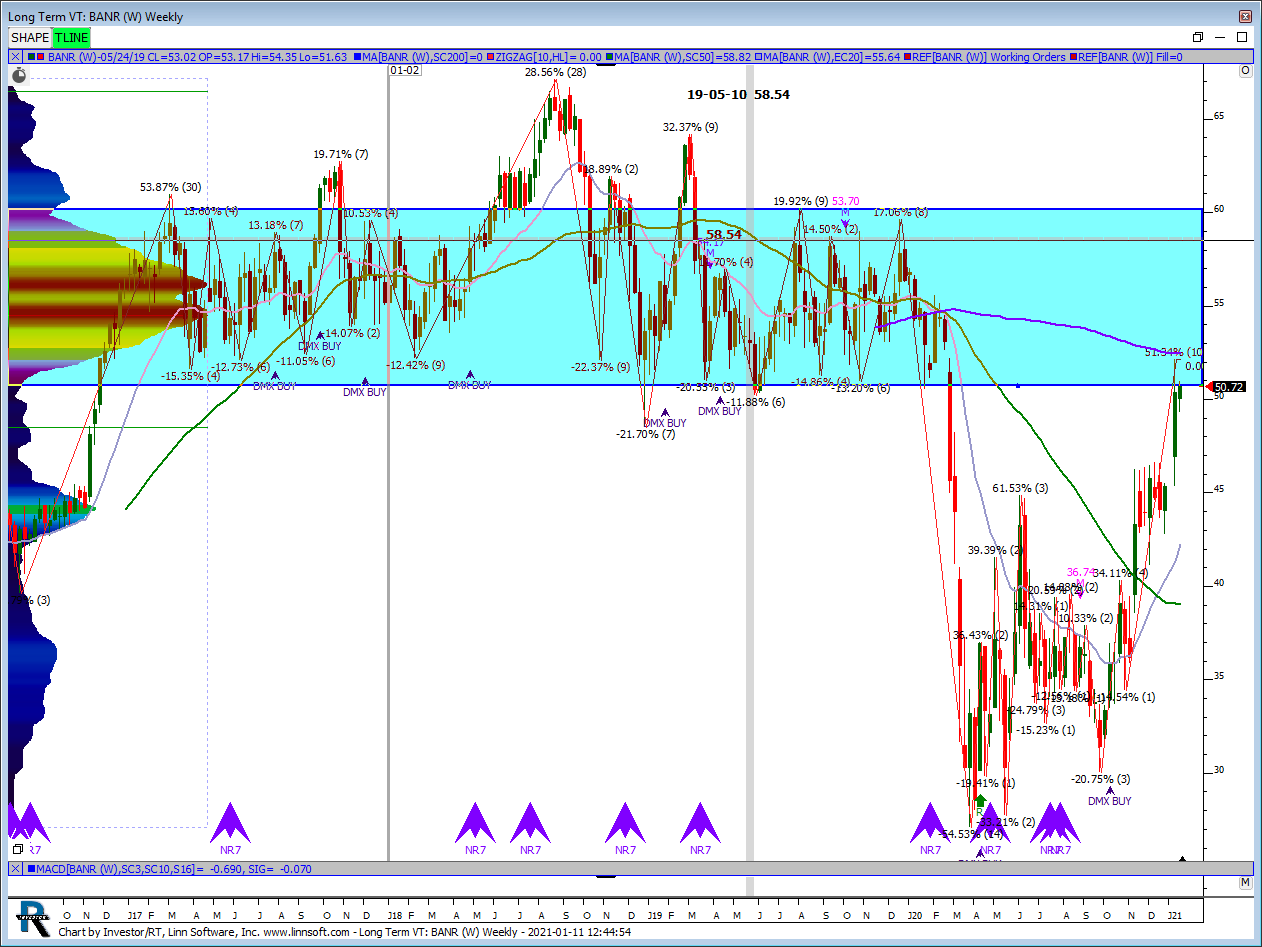 |
Long Term VT (BANR) justin-detray [totalcount]
4 years 11 months ago
BANR. This chart was uploaded by Investor/RT 13.7.10 showing symbol: BANR. |
View |
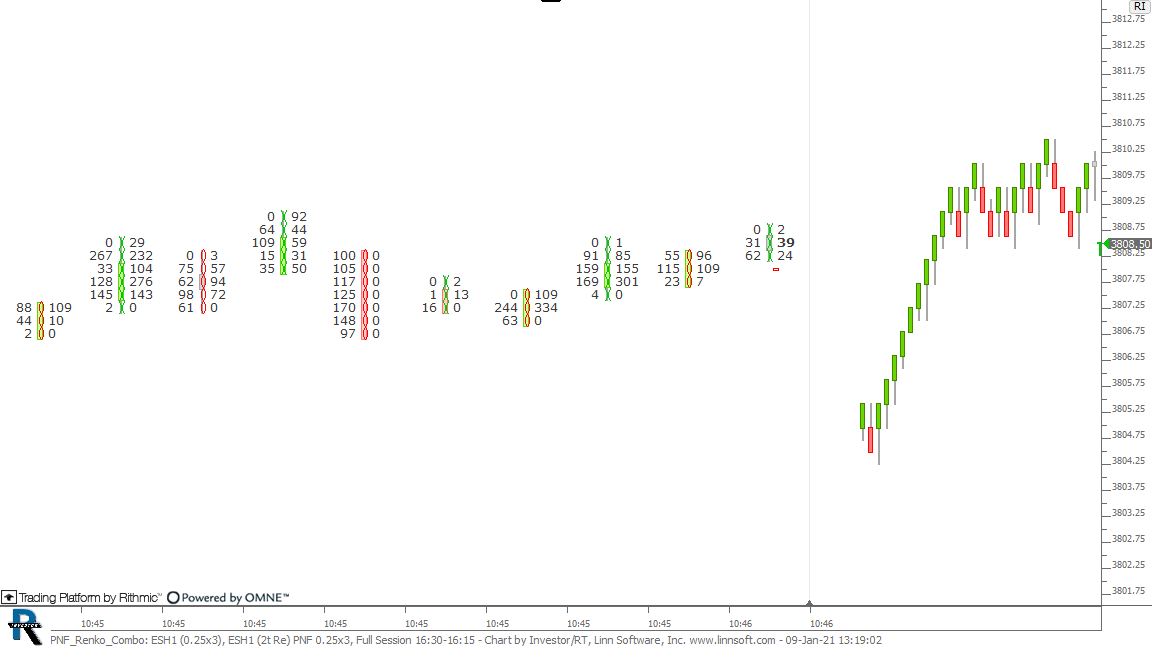 |
PNF Renko Combo (ESH1) cpayne [totalcount]
4 years 11 months ago
This chart was uploaded by Investor/RT 14.2.6 showing symbol: ESH1. |
View |
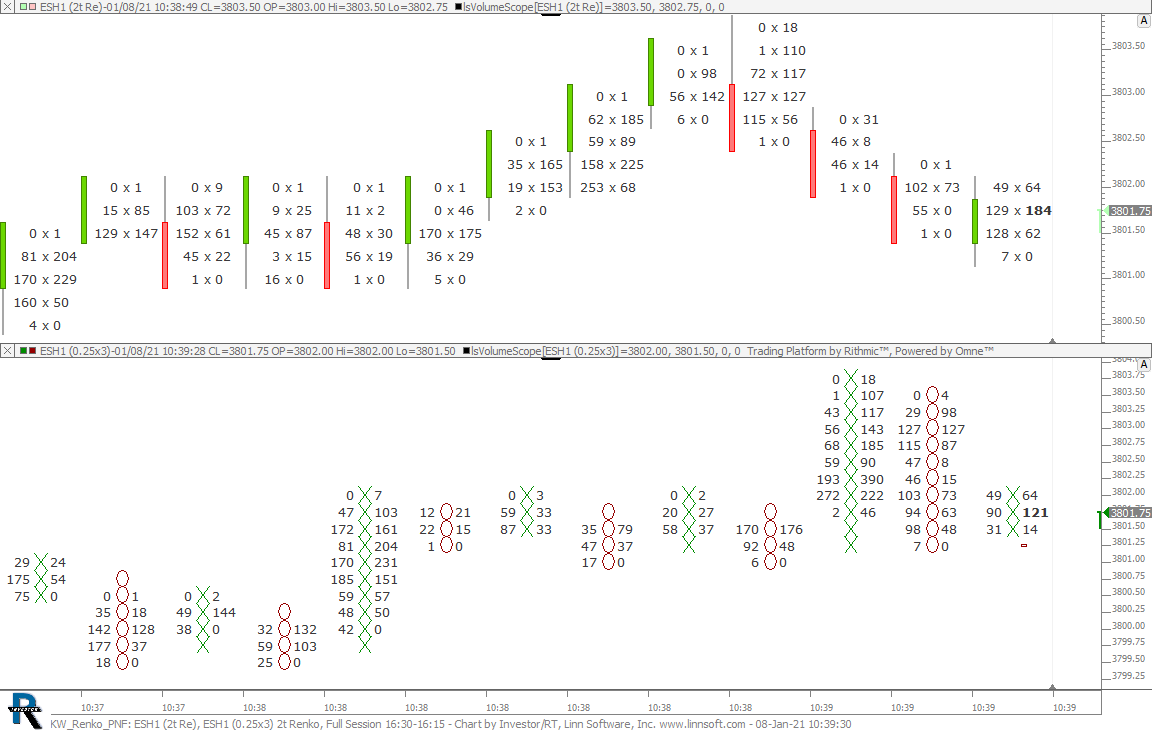 |
KW Renko PNF (ESH1) cpayne [totalcount]
4 years 11 months ago
Renko mixed with PNF. This chart was uploaded by Investor/RT 14.2.6 showing symbol: ESH1. |
View |
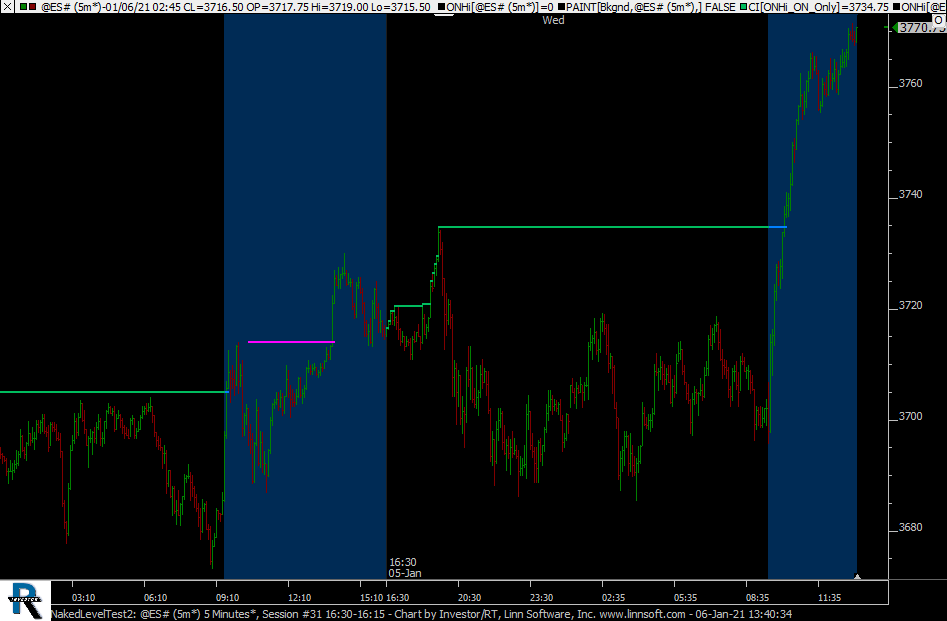 |
NakedLevelTest2 (@ES#) cpayne [totalcount]
4 years 11 months ago
This chart was uploaded by Investor/RT 14.2.6 showing symbol: @ES#. |
View |
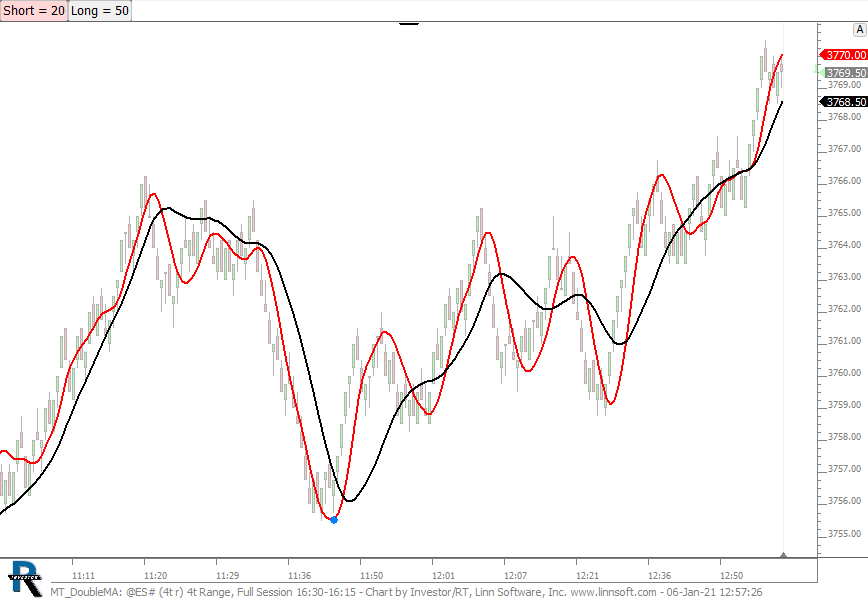 |
MT DoubleMA (@ES#) cpayne [totalcount]
4 years 11 months ago
This chart was uploaded by Investor/RT 14.2.6 showing symbol: @ES#. |
View |
|
|
ClearChart (@ES#) cpayne [totalcount]
4 years 11 months ago
This chart was uploaded by Investor/RT 14.2.6 showing symbol: @ES#. |
View |
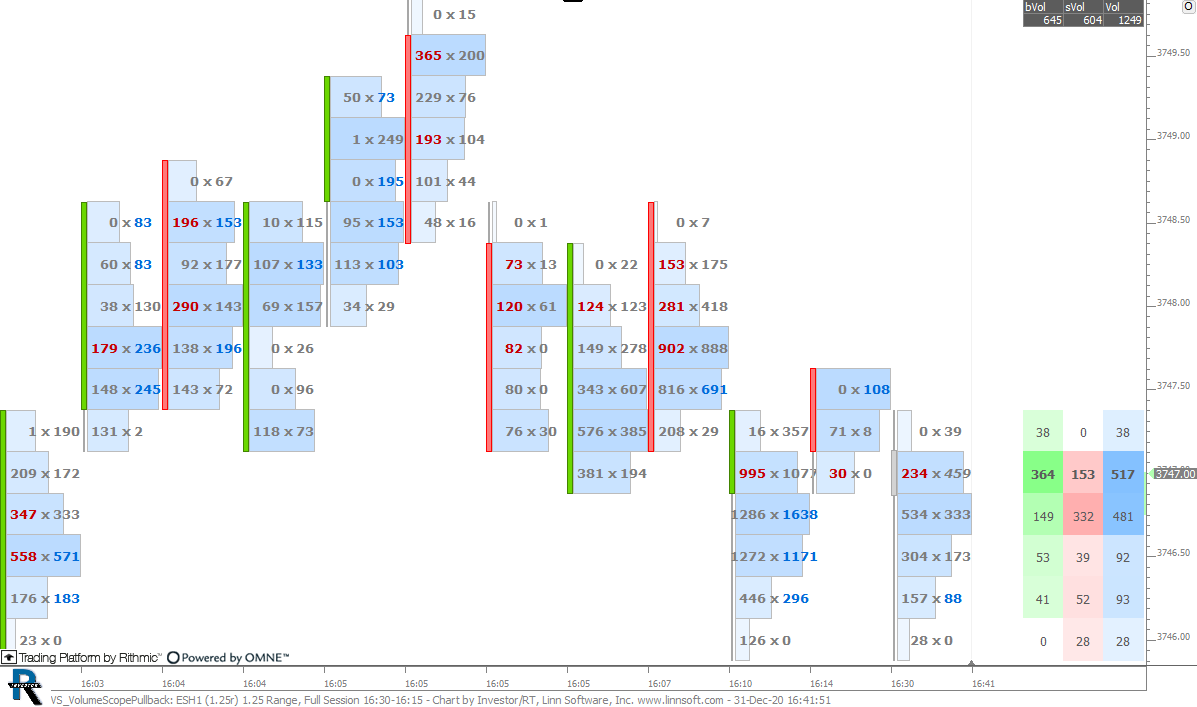 |
VS VolumeScopePullback (ESH1) cpayne [totalcount]
4 years 11 months ago
This chart was uploaded by Investor/RT 14.2.5 showing symbol: ESH1. |
View |
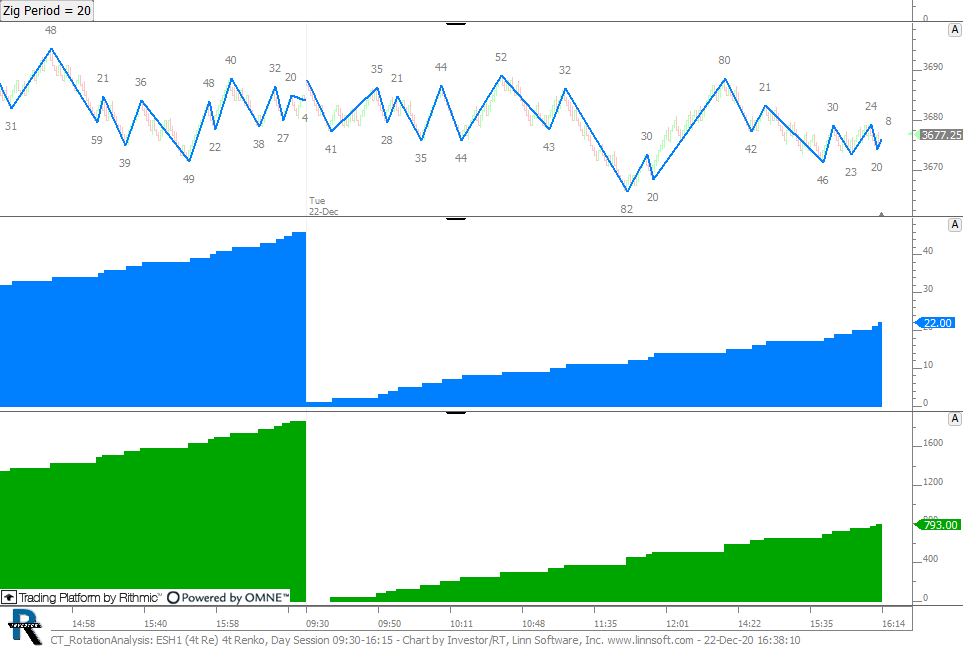 |
CT RotationAnalysis (ESH1) cpayne [totalcount]
4 years 12 months ago
This chart was uploaded by Investor/RT 14.2.5 showing symbol: ESH1. |
View |
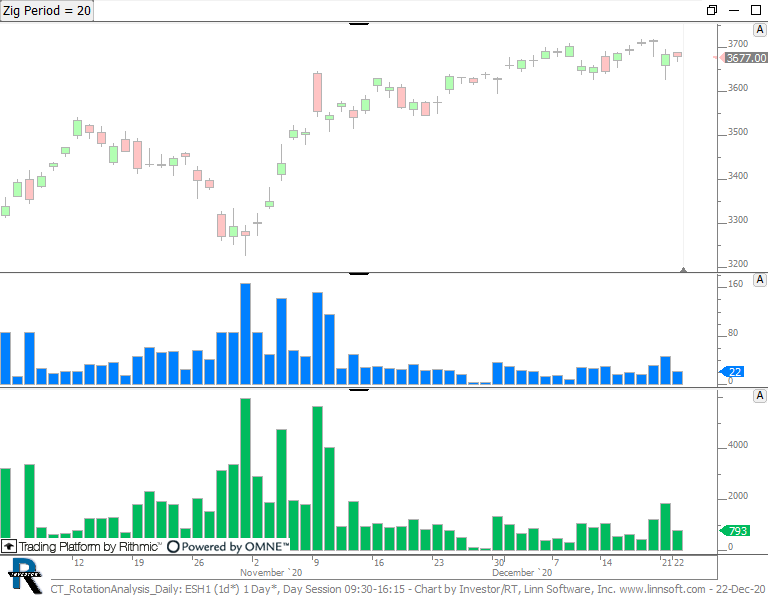 |
CT RotationAnalysis Daily (ESH1) cpayne [totalcount]
4 years 12 months ago
This chart was uploaded by Investor/RT 14.2.5 showing symbol: ESH1. |
View |
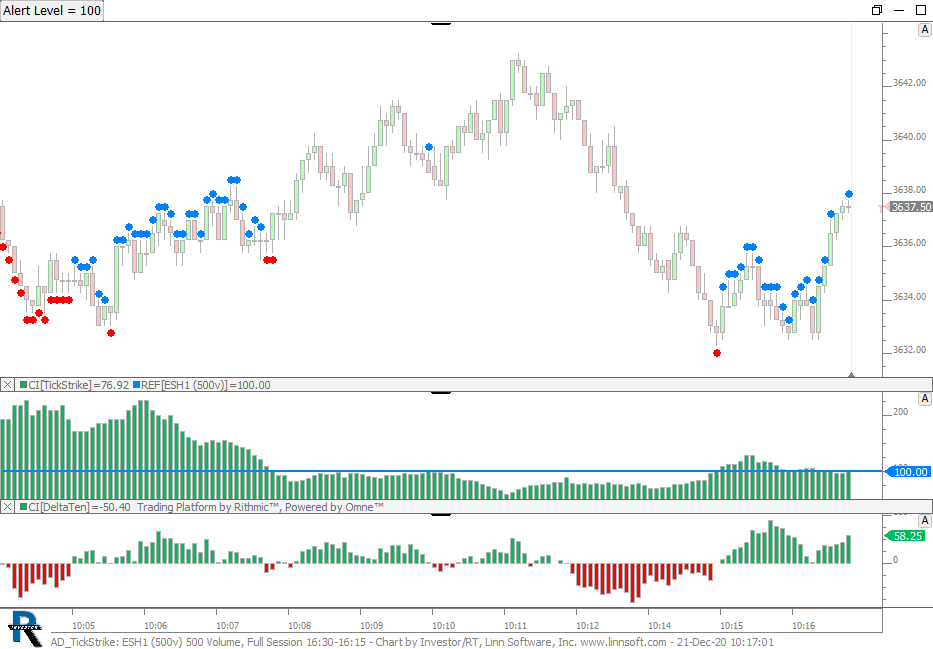 |
AD TickStrike (ESH1) cpayne [totalcount]
4 years 12 months ago
This chart was uploaded by Investor/RT 14.2.5 showing symbol: ESH1. |
View |
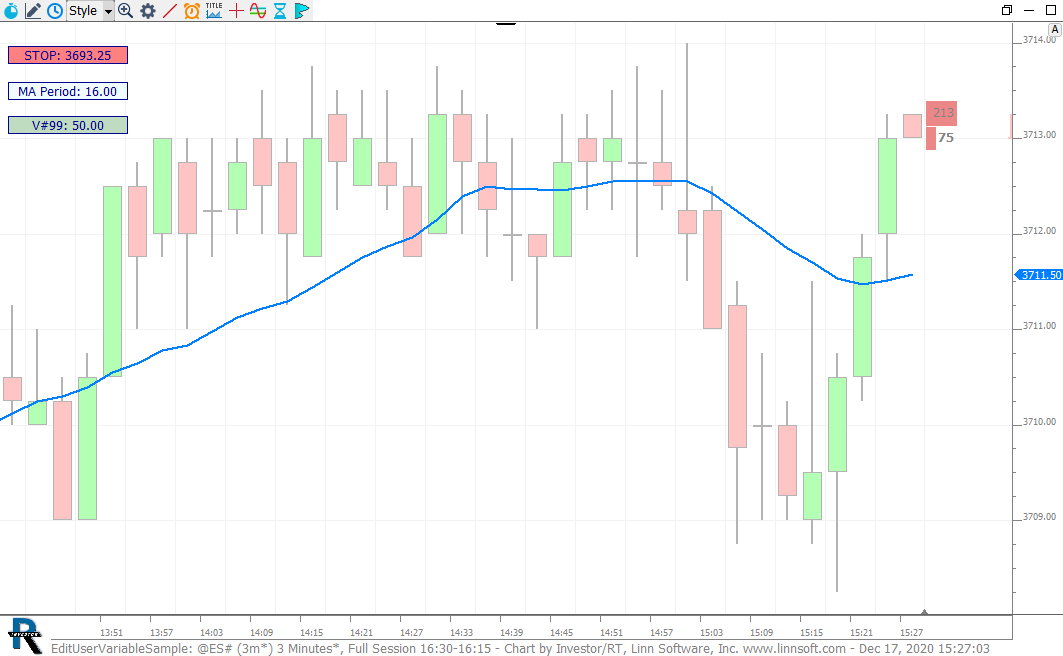 |
EditUserVariableSample william-linn [totalcount]
5 years 2 days ago
EditUserVariable RTX Sample Chart. |
View |
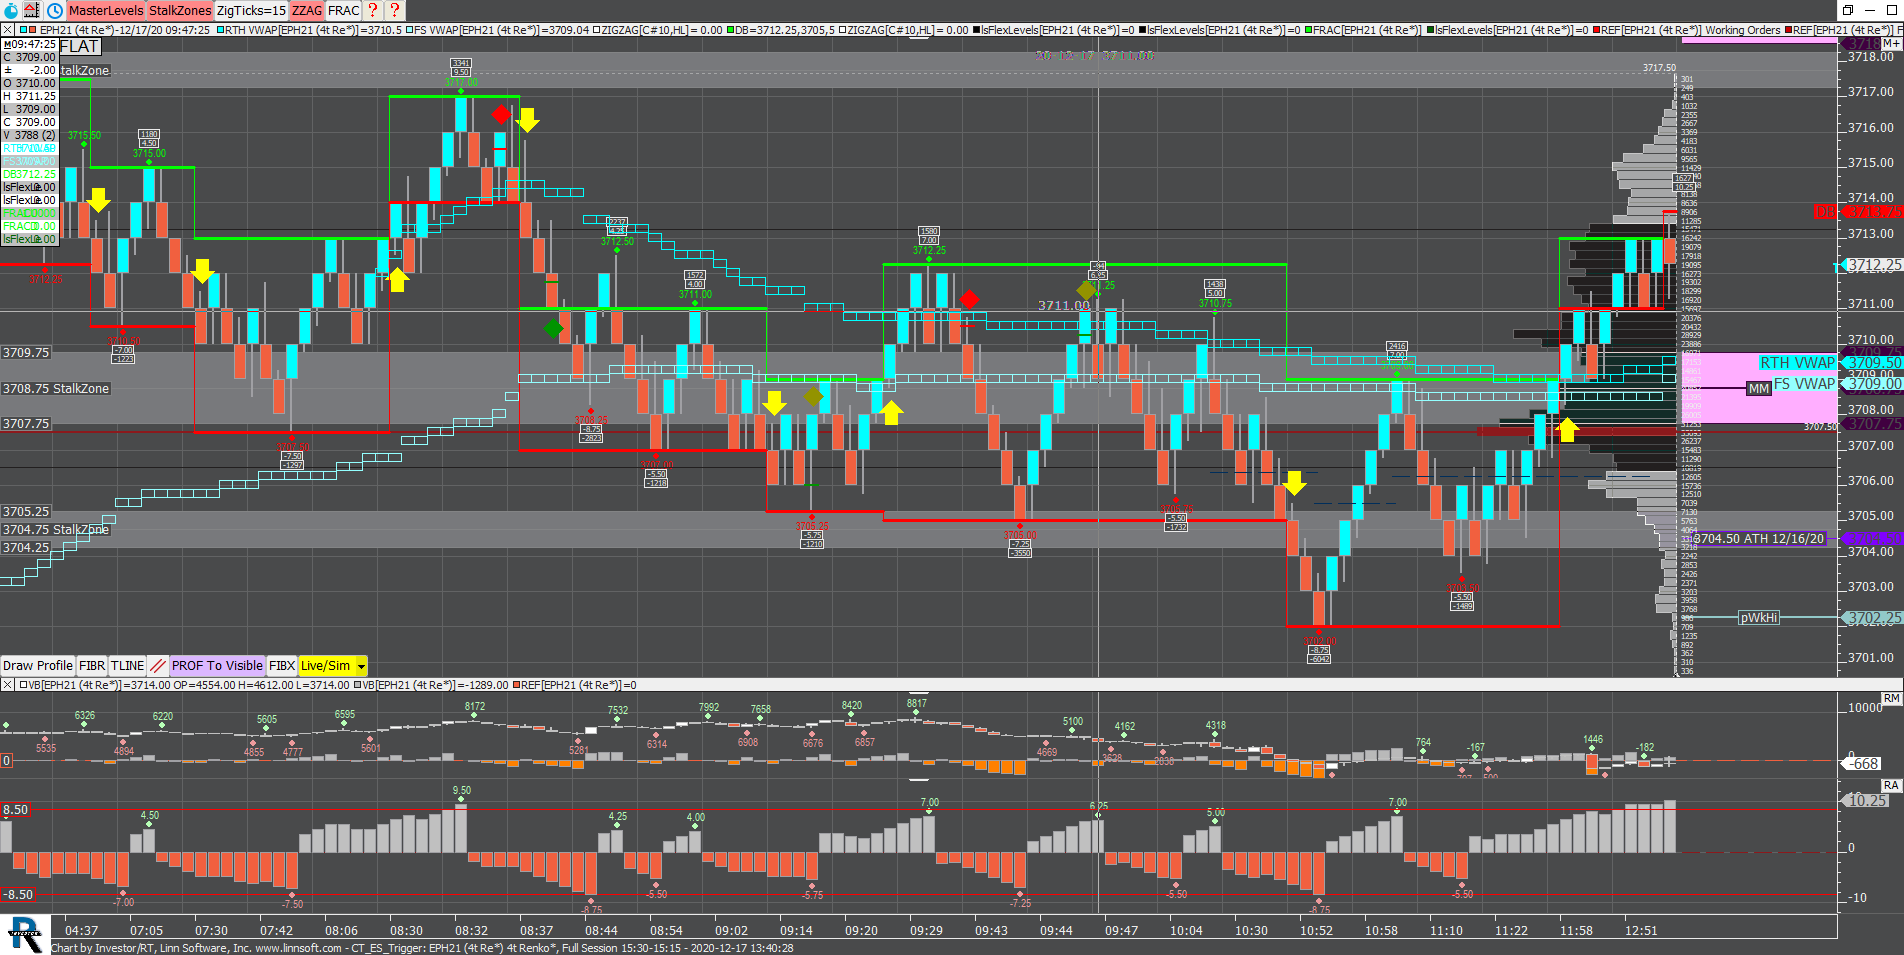 |
CT ES Trigger (EPH21) Robert Smith [totalcount]
5 years 2 days ago
This chart was uploaded by Investor/RT 14.2.5 showing symbol: EPH21. |
View |
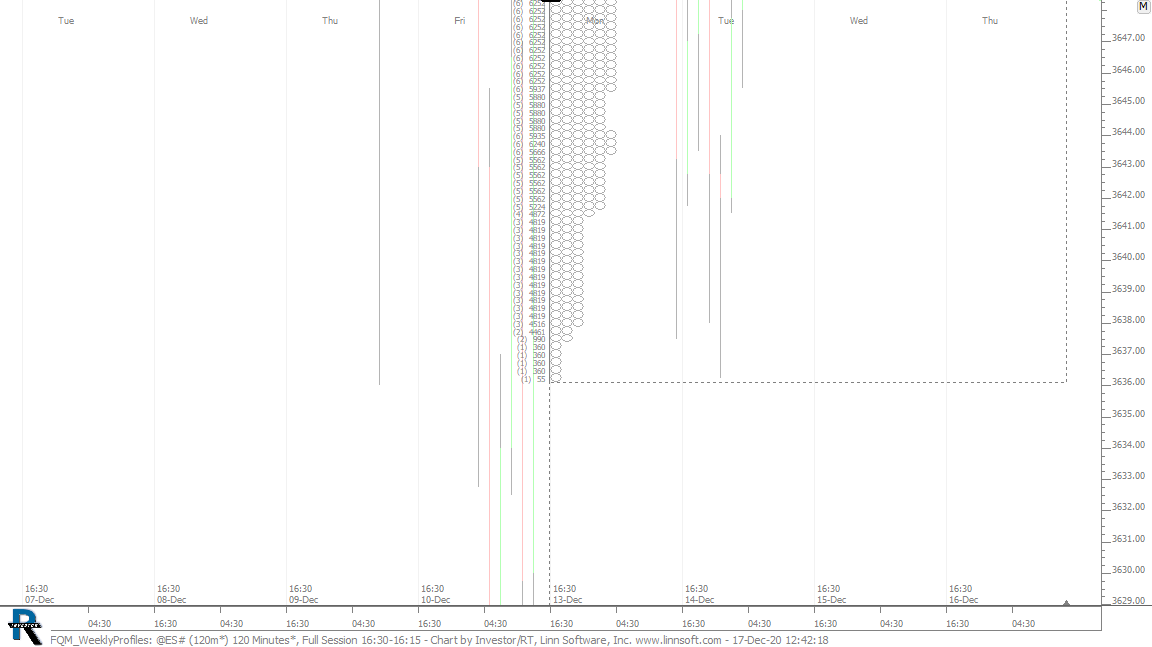 |
FQM WeeklyProfiles (@ES#) cpayne [totalcount]
5 years 2 days ago
Weekly Profiles - 120 Minute TPOs. This chart was uploaded by Investor/RT 14.2.5 showing symbol: @ES#. |
View |
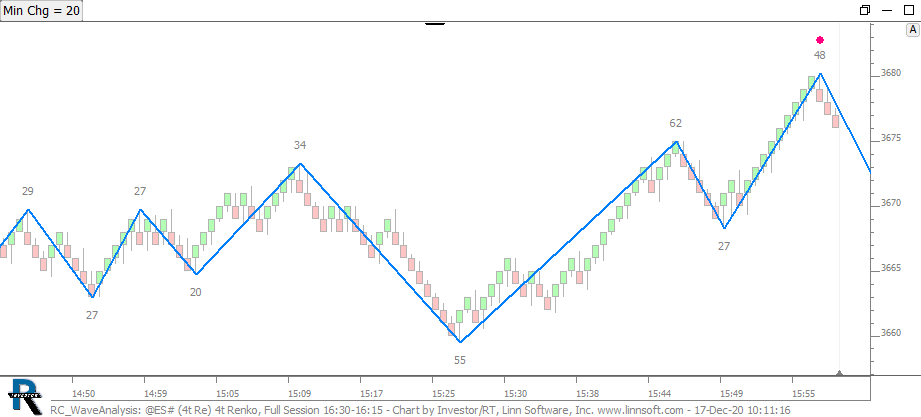 |
RC WaveAnalysis (@ES#) cpayne [totalcount]
5 years 2 days ago
Wave Study. This chart was uploaded by Investor/RT 14.2.5 showing symbol: @ES#. |
View |