 |
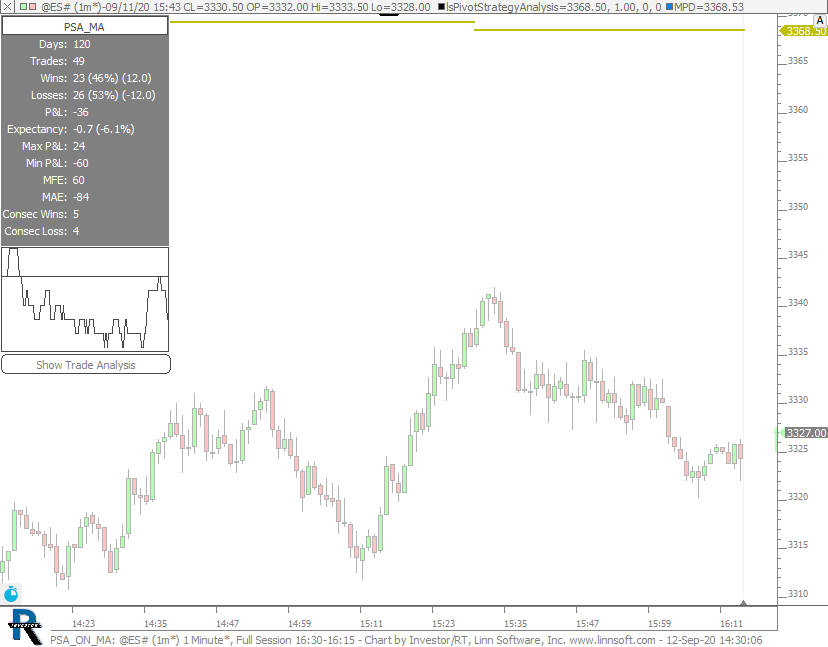
PSA ON MA (@ES#) cpayne [totalcount]
5 years 3 months ago
PSA on touch of 60-min 100-period MA. This chart was uploaded by Investor/RT 14.1.6 showing symbol: @ES#. |
View |
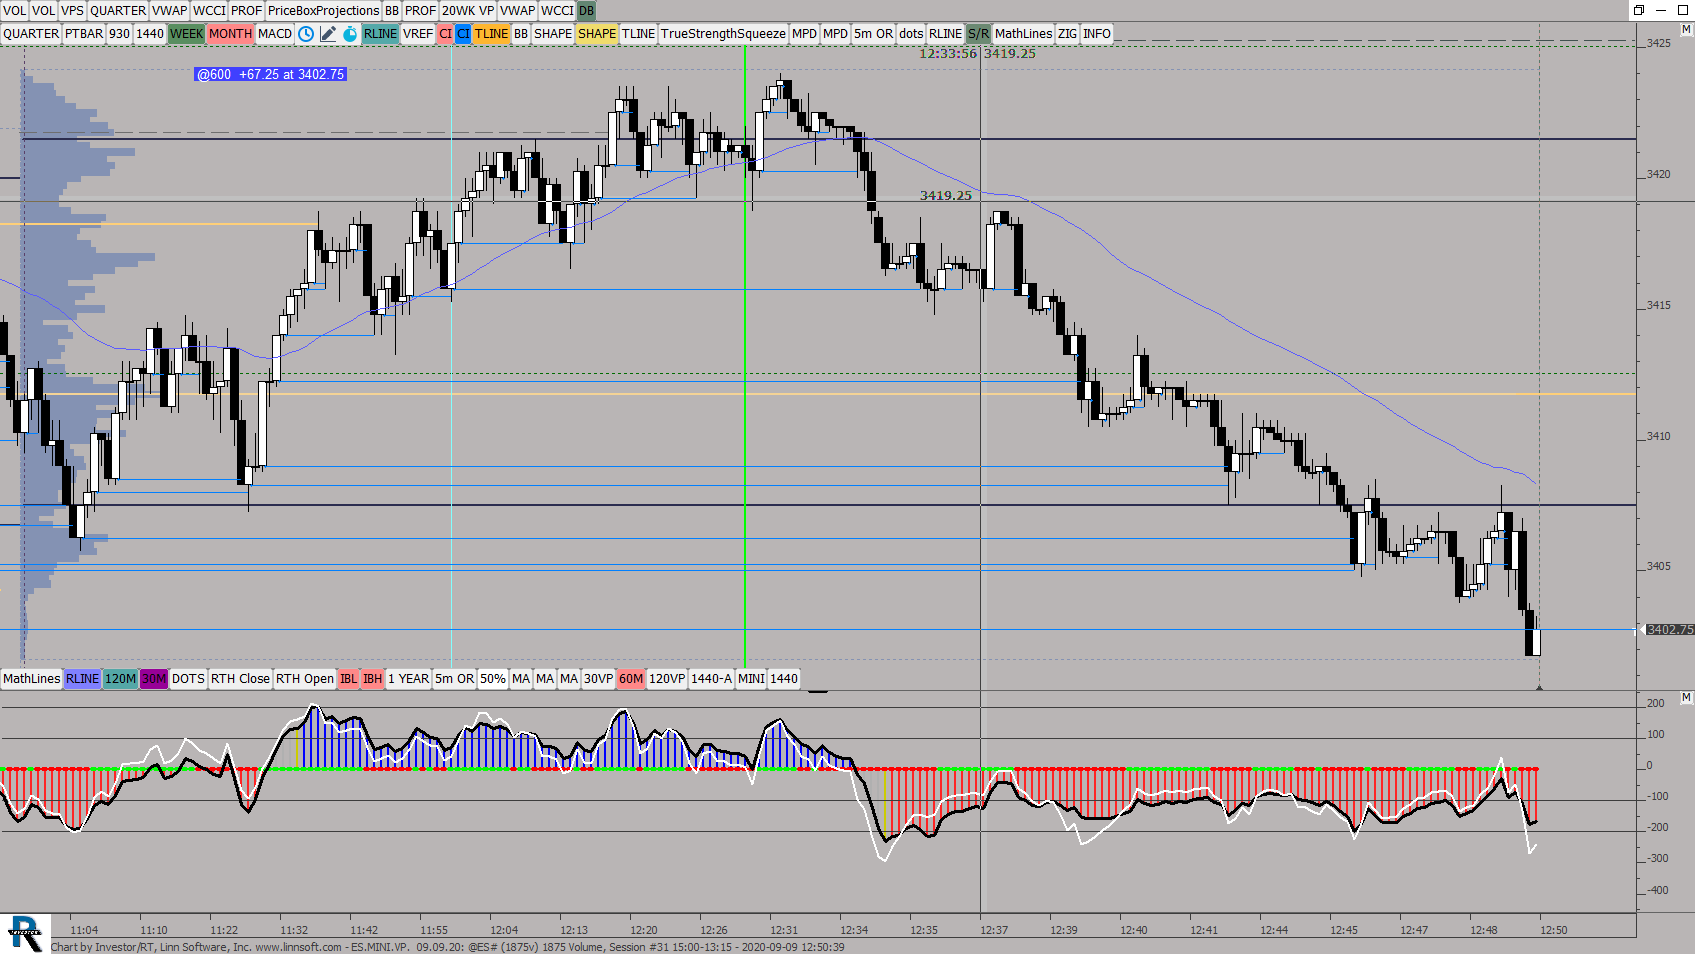 |
ESMINIVP (@ES#) ES42 [totalcount]
5 years 3 months ago
120 MIN Candles. This chart was uploaded by Investor/RT 13.6.3 showing symbol: @ES#. |
View |
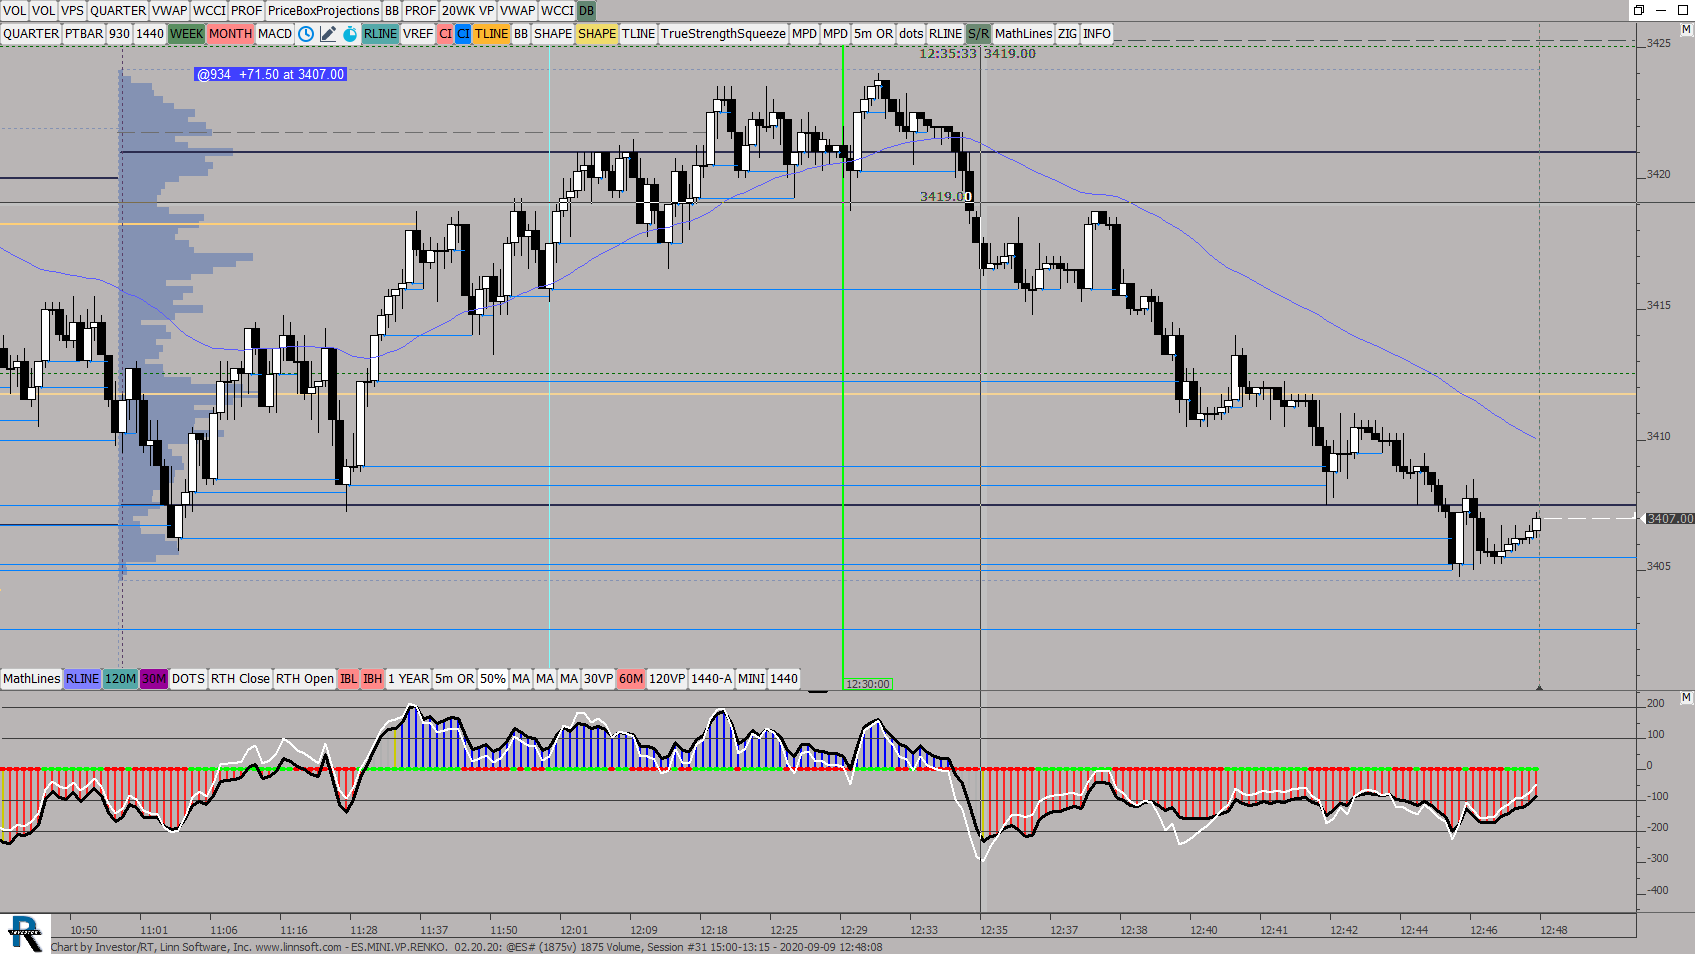 |
ESMINIVPRENKO (@ES#) ES42 [totalcount]
5 years 3 months ago
This chart was uploaded by Investor/RT 13.7.1 showing symbol: @ES#. |
View |
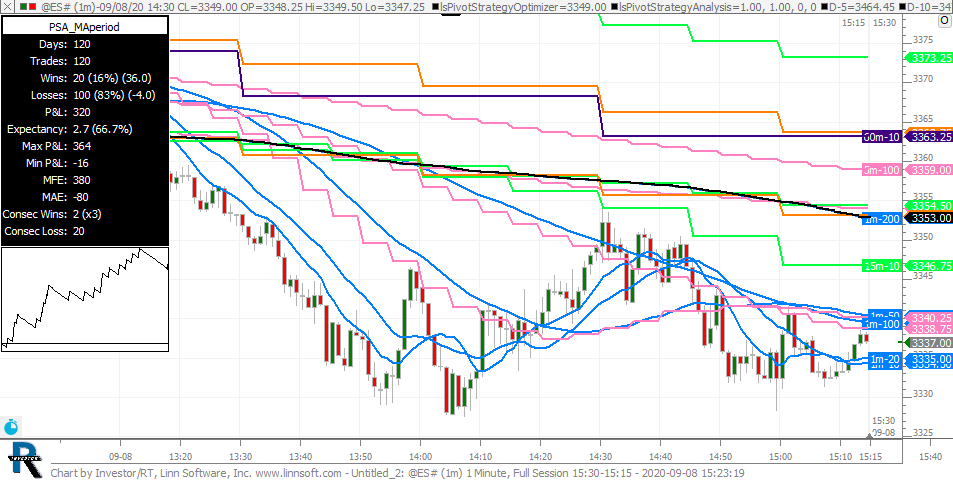 |
Untitled 2 (@ES#) 2 Ray Mami1 [totalcount]
5 years 3 months ago
PSA with custom MPD indicator and variables. This chart was uploaded by Investor/RT 14.1.5 showing symbol: @ES#. |
View |
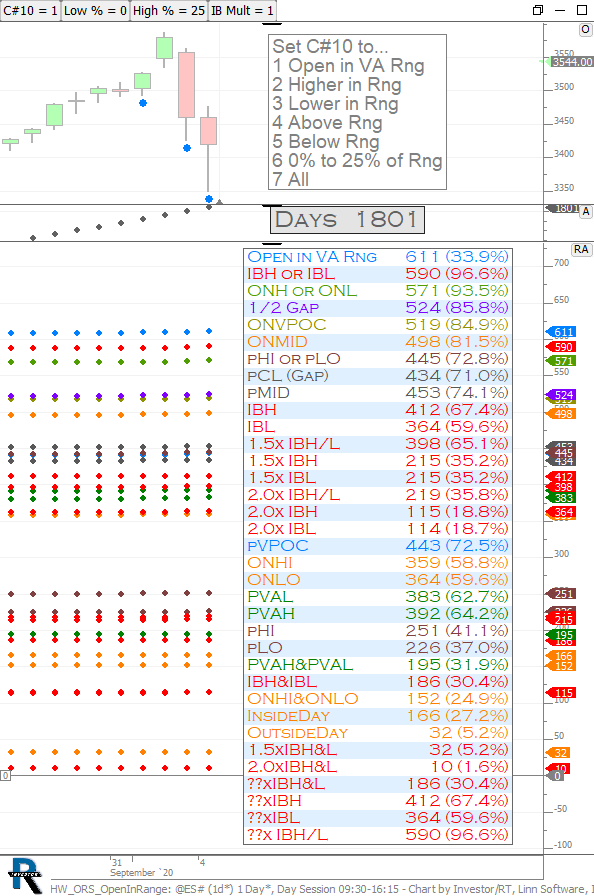 |
HW ORS OpenInRange (@ES#) cpayne [totalcount]
5 years 3 months ago
Homework - Open In Range Statistics. This chart was uploaded by Investor/RT 14.1.5 showing symbol: @ES#. |
View |
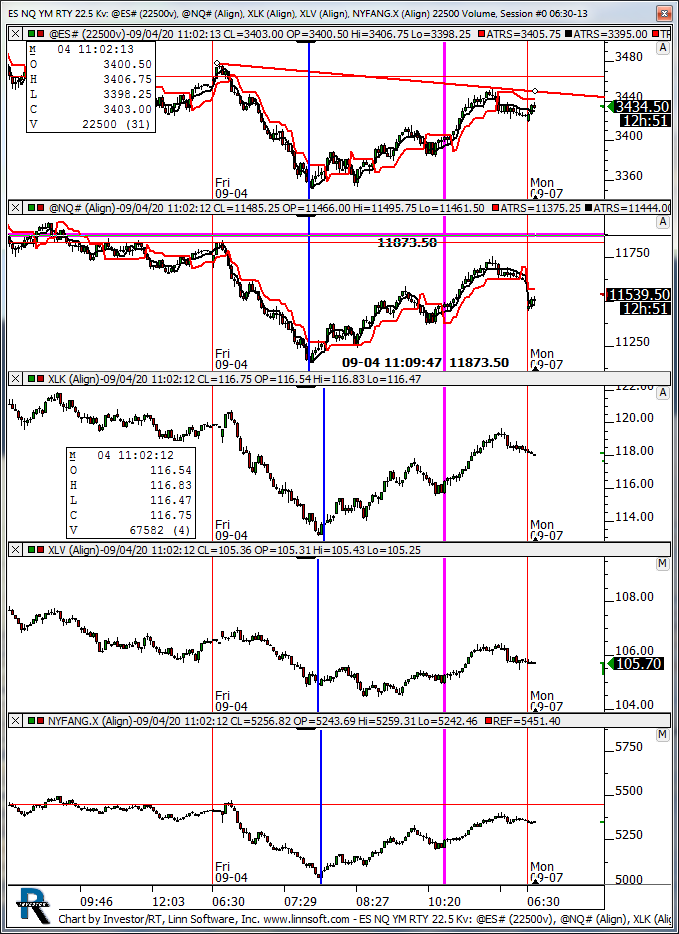 |
ES NQ YM RTY 225 Kv (@ES#) kencassorla [totalcount]
5 years 3 months ago
indexes. This chart was uploaded by Investor/RT 13.6.15 showing symbol: @ES#. |
View |
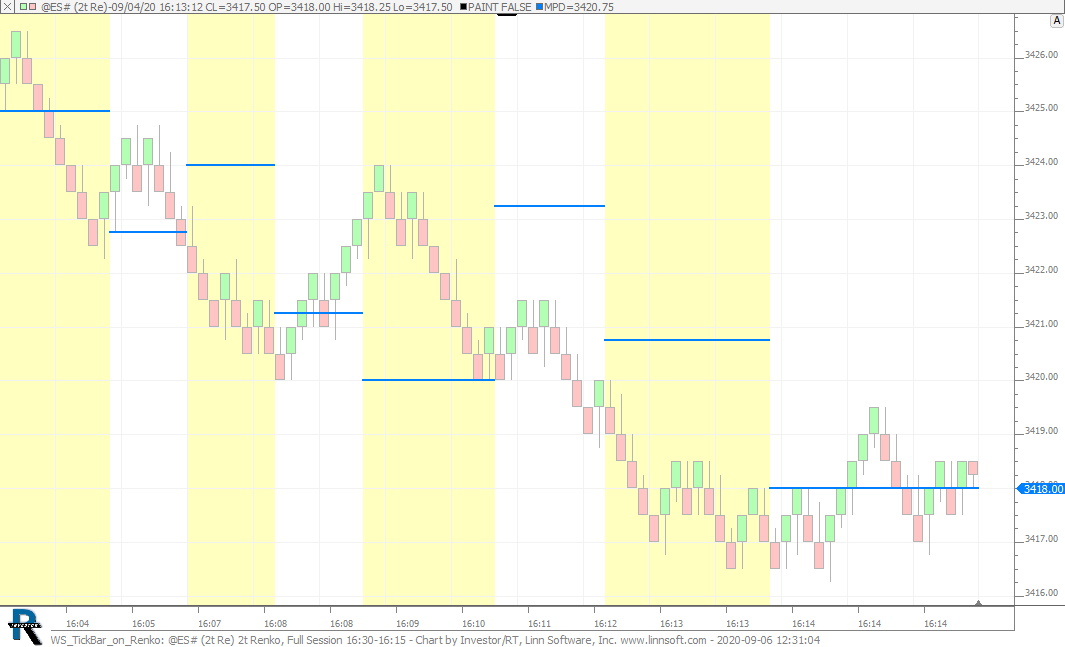 |
WS TickBar on Renko (@ES#) cpayne [totalcount]
5 years 3 months ago
2000 Tickbar POC on a 3t 2t Renko Chart. PaintBar background represents alternating 2000 tickbars. This chart was uploaded by Investor/RT 14.1.5 showing symbol: @ES#. |
View |
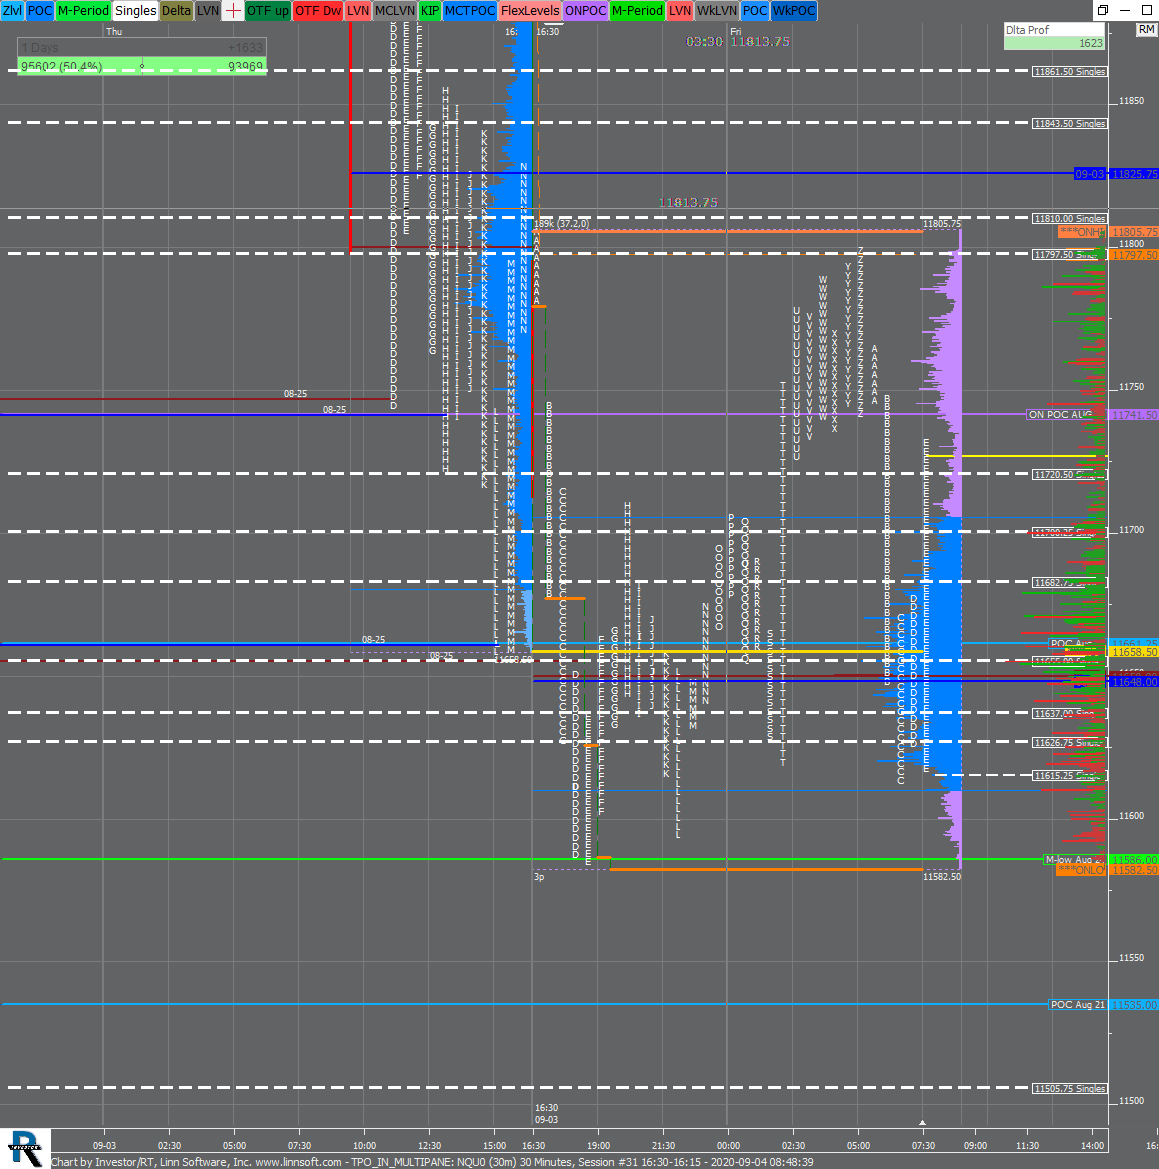 |
TPO IN MULTIPANE (NQU0) Benoit Doyle [totalcount]
5 years 3 months ago
This chart was uploaded by Investor/RT 14.1.5 showing symbol: NQU0. |
View |
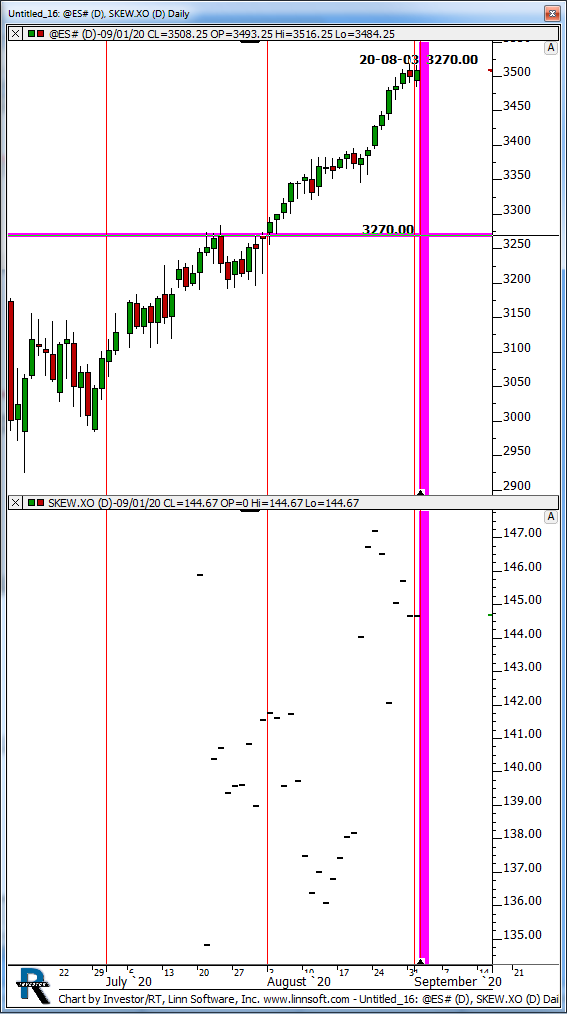 |
Untitled 16 (@ES#) kencassorla [totalcount]
5 years 3 months ago
SKEW.XO. This chart was uploaded by Investor/RT 13.7.1 showing symbol: @ES#. |
View |
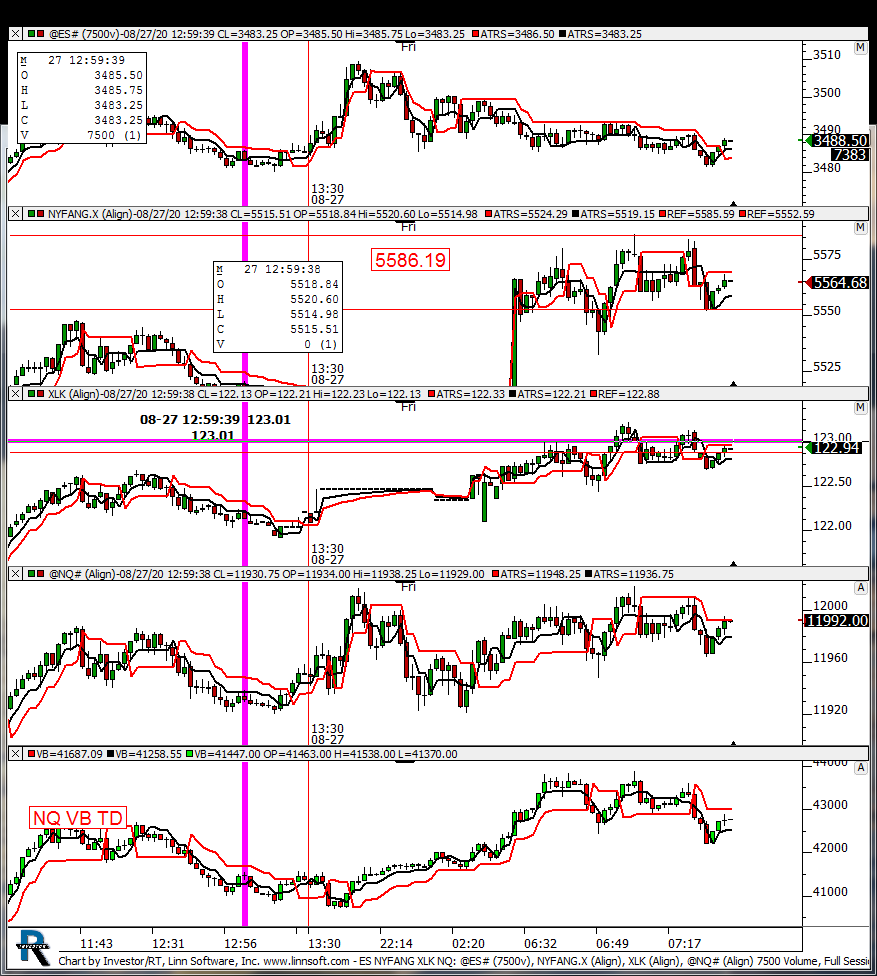 |
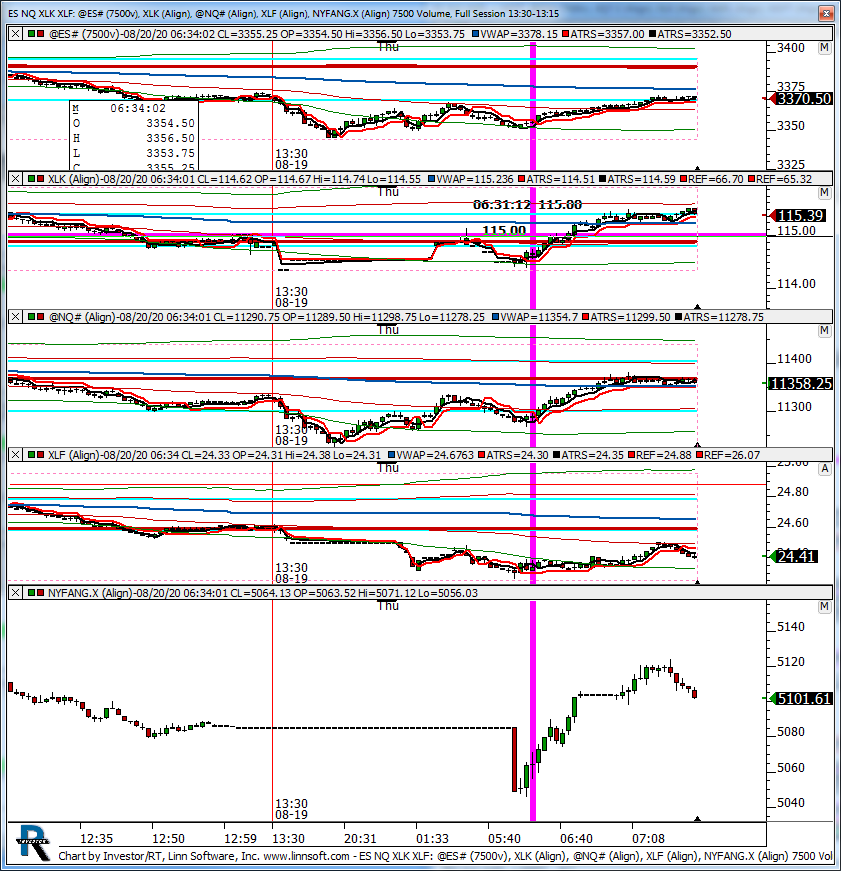
ES NYFANG XLK NQ (@ES#) kencassorla [totalcount]
5 years 3 months ago
fang. This chart was uploaded by Investor/RT 13.7.1 showing symbol: @ES#. |
View |
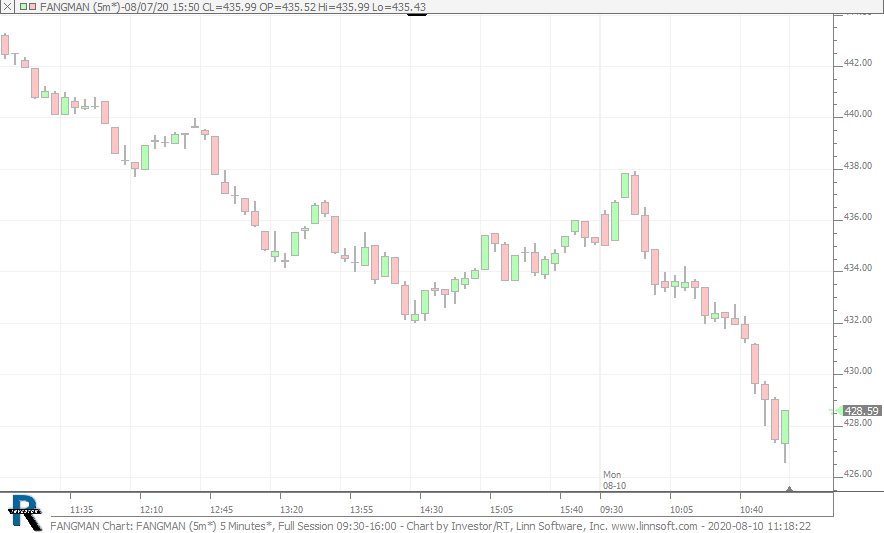 |
FANGMAN Chart (FANGMAN) cpayne [totalcount]
5 years 4 months ago
This chart was uploaded by Investor/RT 14 showing symbol: FANGMAN, a custom instrument that calculates the weighted sum of seven FANG stocks. |
View |
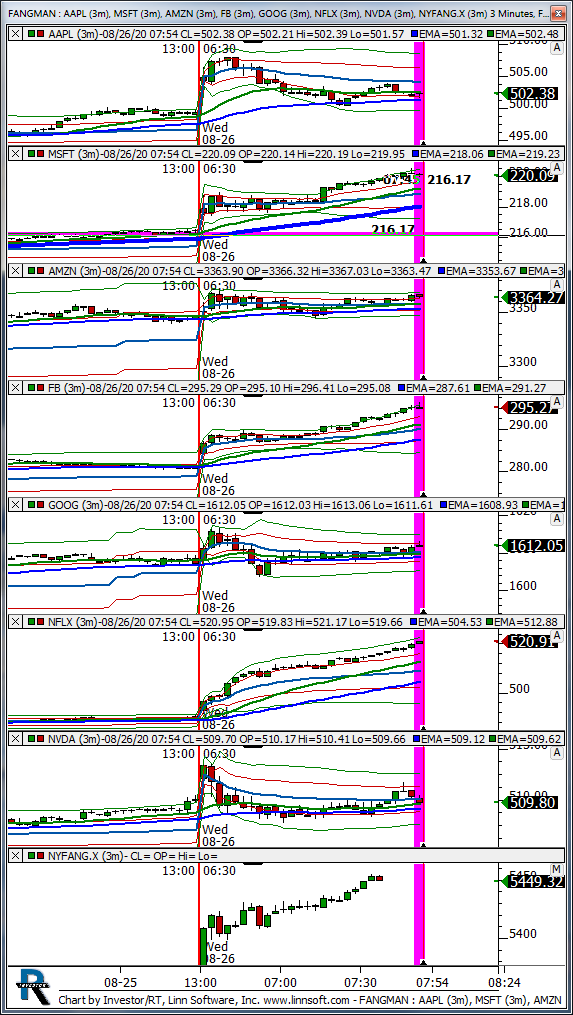 |
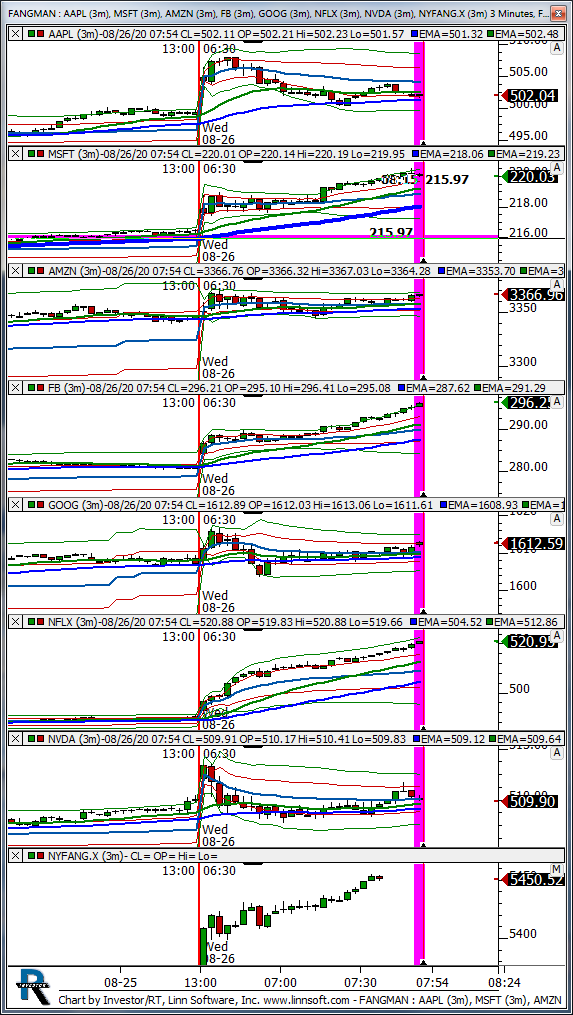
FANGMAN (AAPL) kencassorla [totalcount]
5 years 3 months ago
fang. This chart was uploaded by Investor/RT 13.7.1 showing symbol: AAPL. |
View |
 |
FANGMAN (AAPL) kencassorla [totalcount]
5 years 3 months ago
fang. This chart was uploaded by Investor/RT 13.7.1 showing symbol: AAPL. |
View |
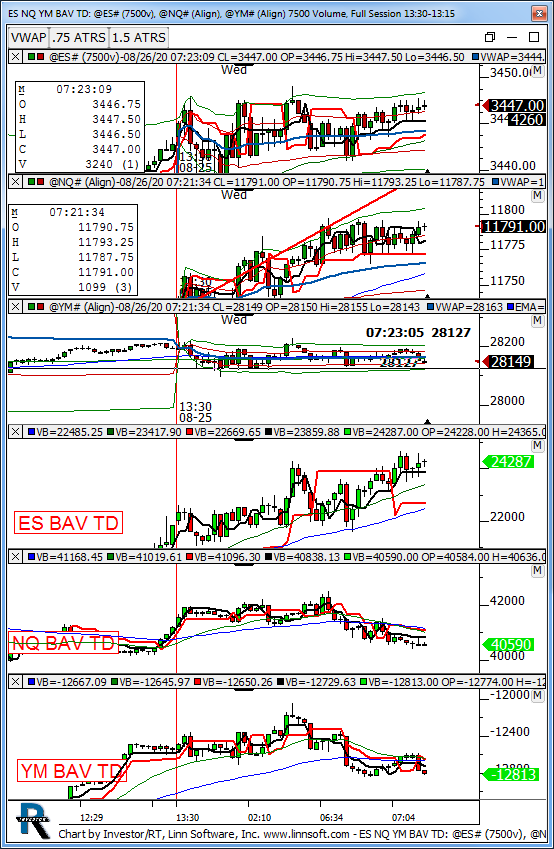 |
ES NQ YM BAV TD (@ES#) kencassorla [totalcount]
5 years 3 months ago
indexes. This chart was uploaded by Investor/RT 13.6.3 showing symbol: @ES#. |
View |
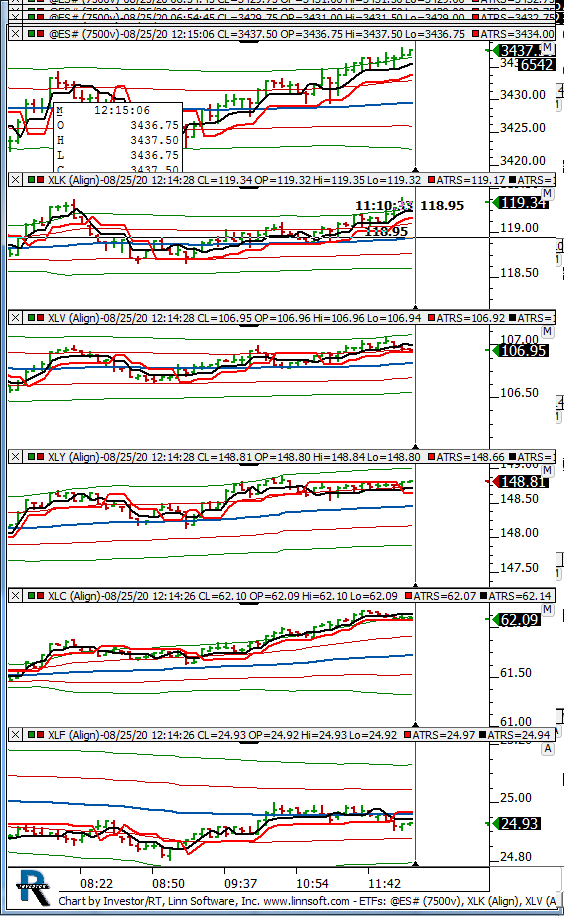 |
ETFs (@ES#) kencassorla [totalcount]
5 years 3 months ago
etf. This chart was uploaded by Investor/RT 13.6.15 showing symbol: @ES#. |
View |
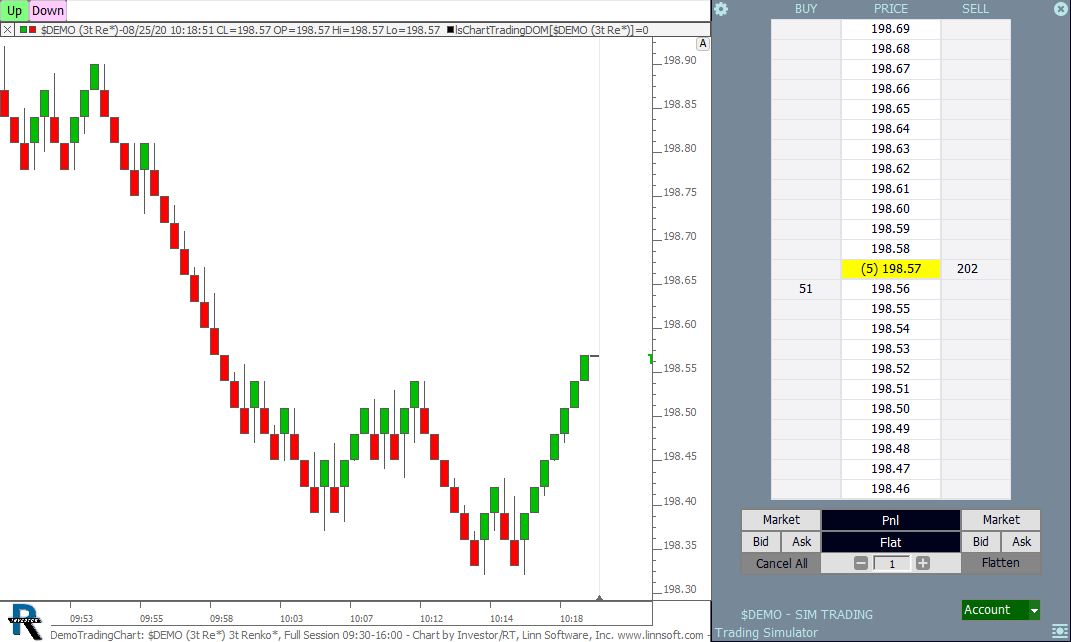 |
DemoTradingChart ($DEMO) cpayne [totalcount]
5 years 3 months ago
Set DemoTickRate to 0 and fully control the $DEMO symbol from buttons at top of chart. Great for testing trading strategies in sim mode. |
View |
 |
ES NQ XLK XLF (@ES#) kencassorla [totalcount]
5 years 4 months ago
xlk xlf. This chart was uploaded by Investor/RT 13.5.15 showing symbol: @ES#. |
View |
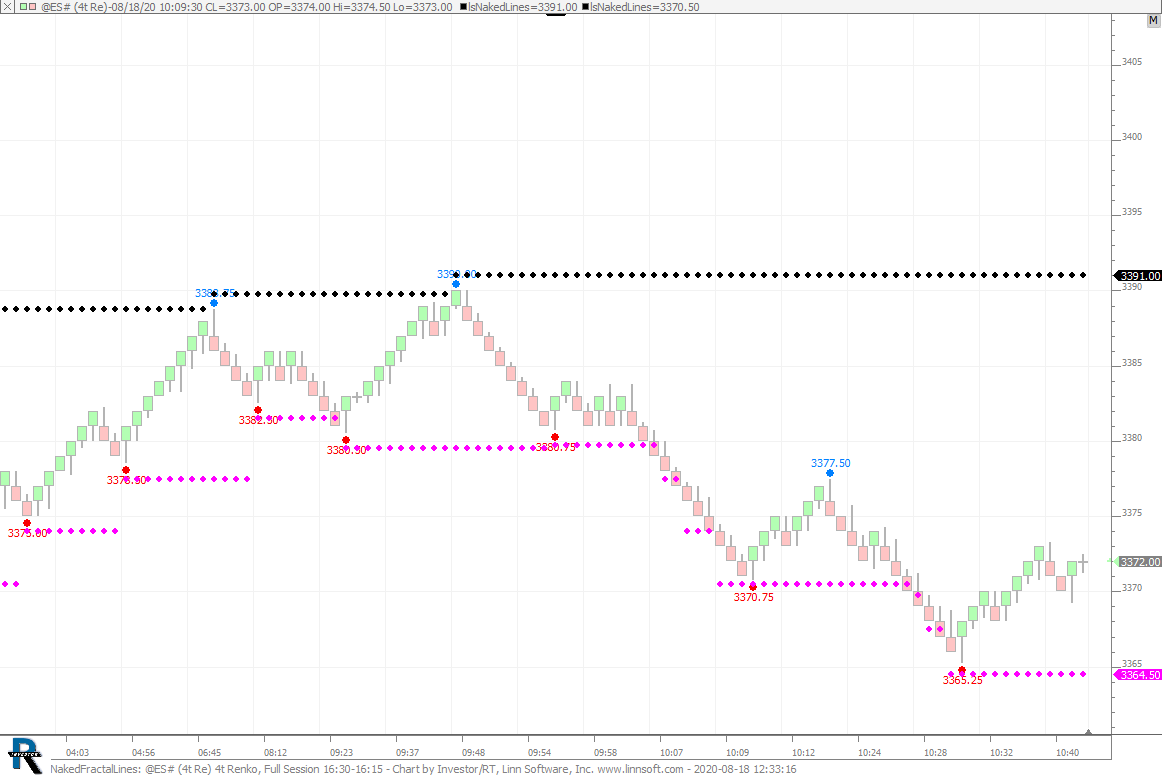 |
NakedFractalLines (@ES#) cpayne [totalcount]
5 years 4 months ago
This chart was uploaded by Investor/RT 14.1.5 showing symbol: @ES#. |
View |
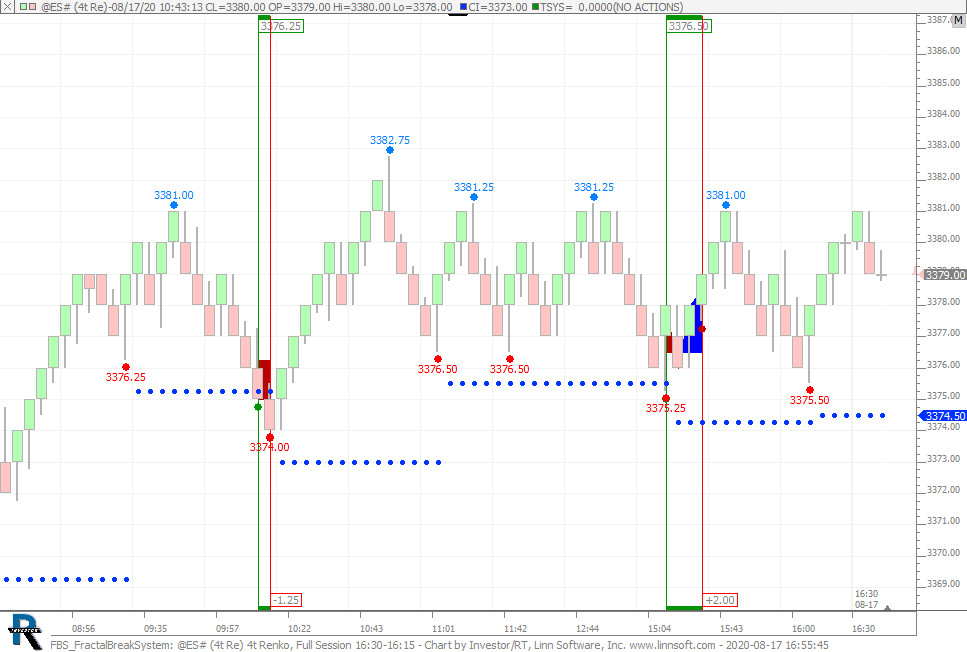 |
FBS FractalBreakSystem (@ES#) cpayne [totalcount]
5 years 4 months ago
This chart was uploaded by Investor/RT 14.1.5 showing symbol: @ES#. |
View |
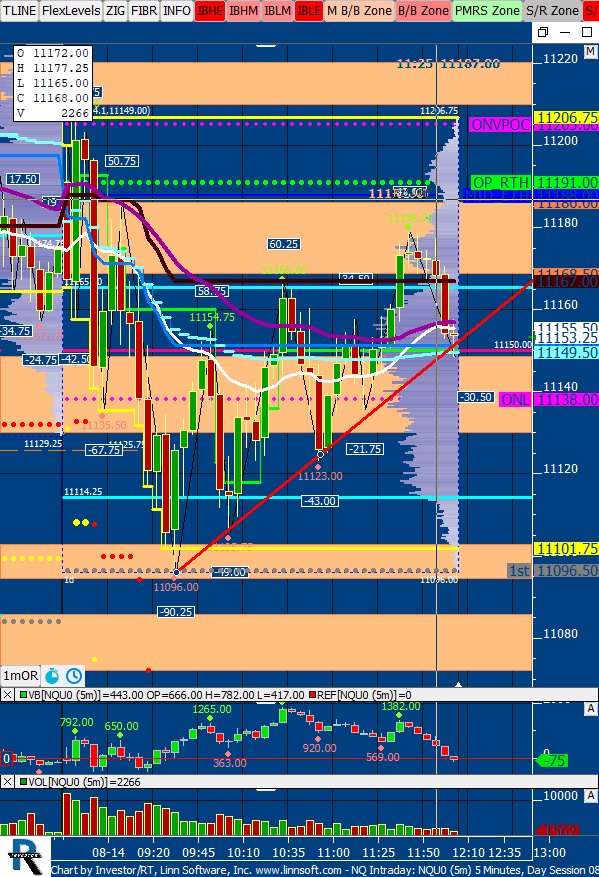 |
NQ Intraday (NQU0) scottz46 [totalcount]
5 years 4 months ago
This chart was uploaded by Investor/RT 14.1.4 showing symbol: NQU0. |
View |
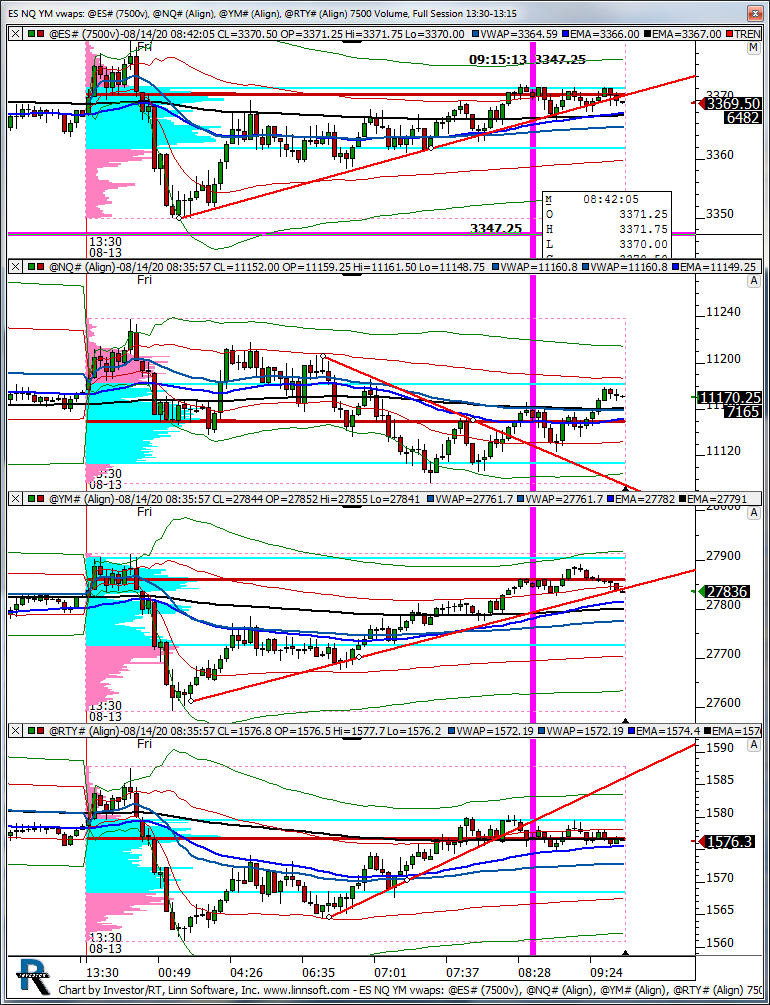 |
ES NQ YM vwaps (@ES#) kencassorla [totalcount]
5 years 4 months ago
poc. This chart was uploaded by Investor/RT 13.6.15 showing symbol: @ES#. |
View |
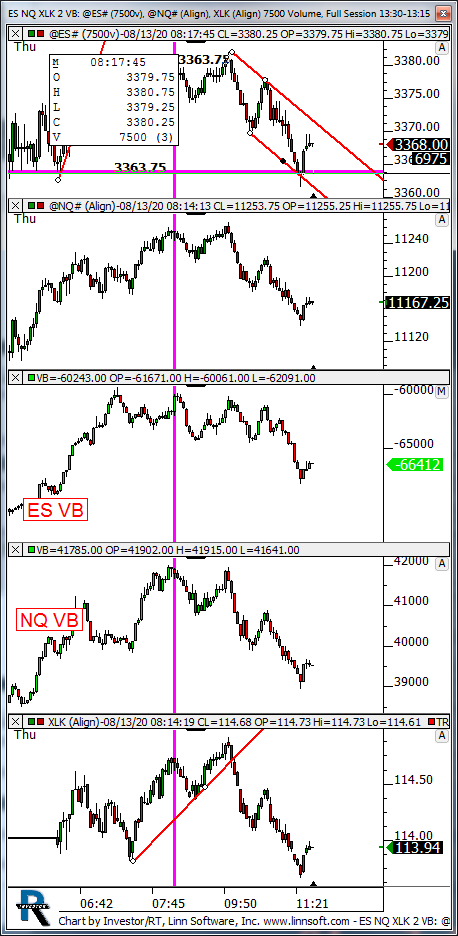 |
ES NQ XLK 2 VB (@ES#) kencassorla [totalcount]
5 years 4 months ago
nq etc. This chart was uploaded by Investor/RT 13.6.15 showing symbol: @ES#. |
View |
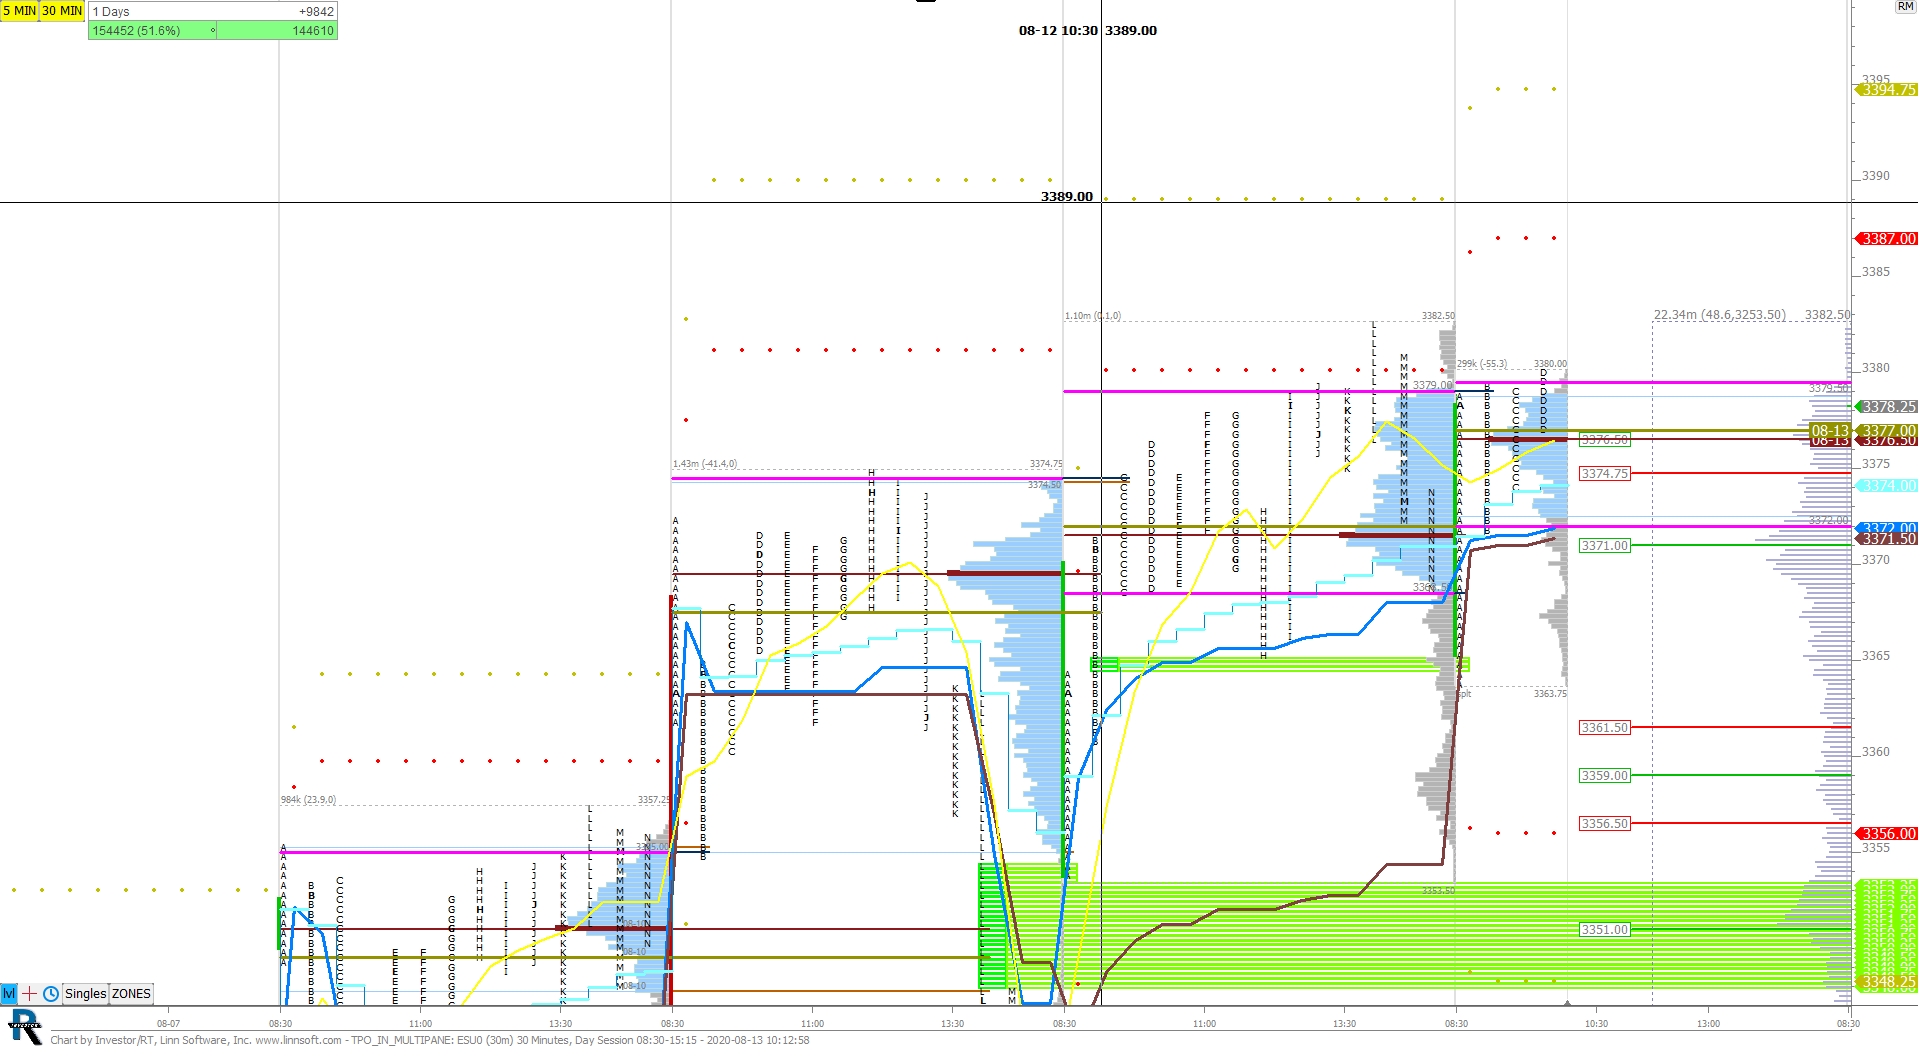 |
TPO IN MULTIPANE (ESU0) scottz46 [totalcount]
5 years 4 months ago
This chart was uploaded by Investor/RT 14.1.1 showing symbol: ESU0. |
View |
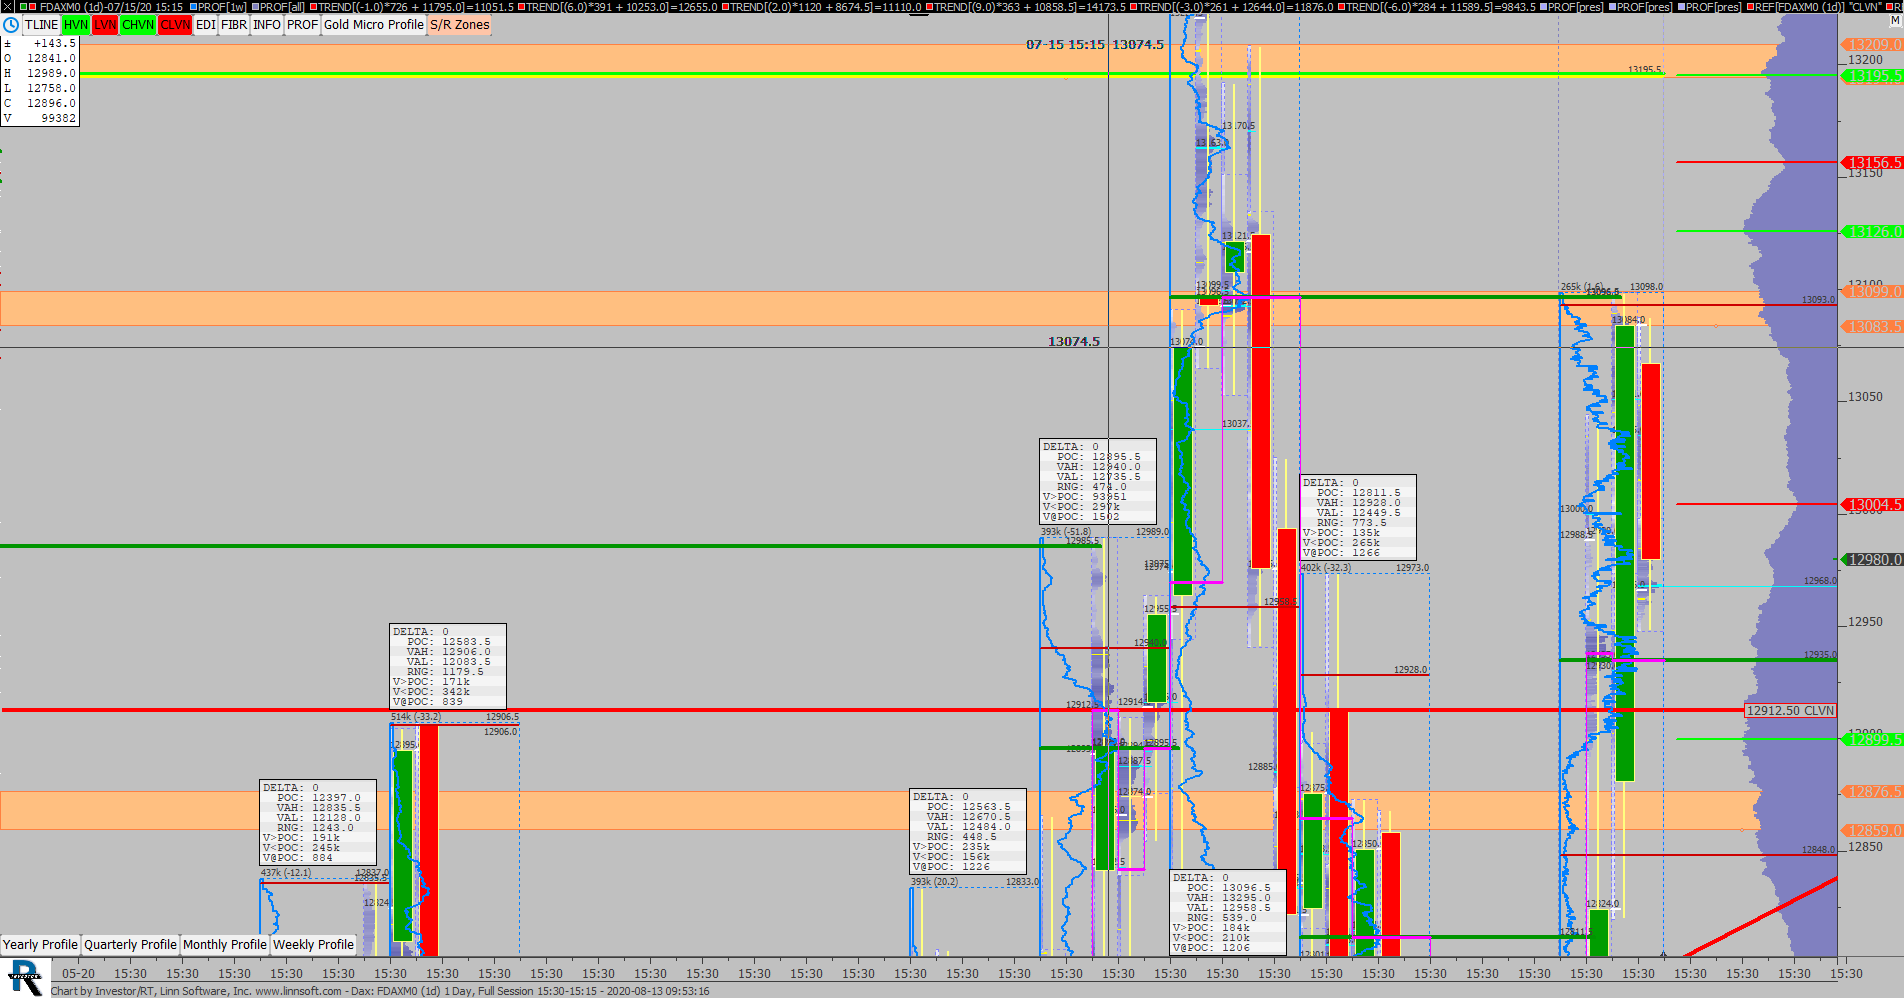 |
Dax (FDAXM0) scottz46 [totalcount]
5 years 4 months ago
This chart was uploaded by Investor/RT 13.6.15 showing symbol: FDAXM0. |
View |
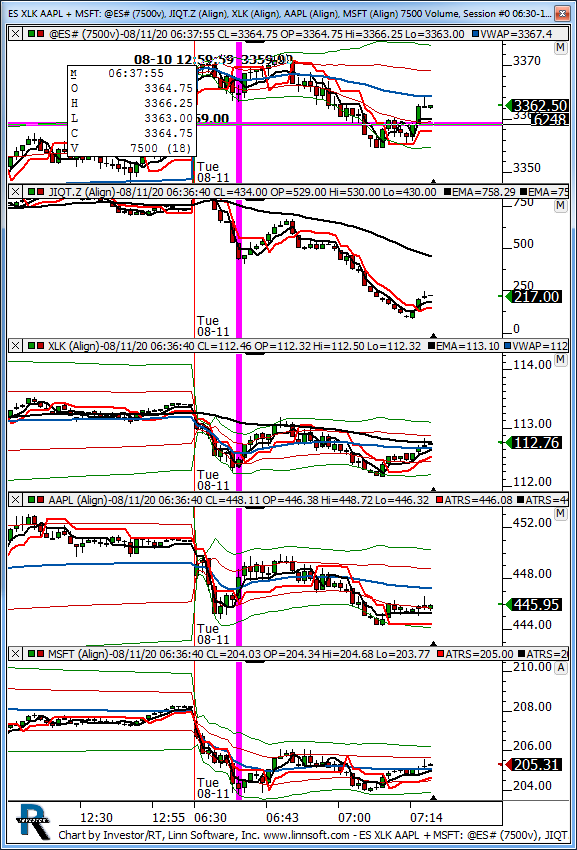 |
ES XLK AAPL MSFT (@ES#) kencassorla [totalcount]
5 years 4 months ago
etf. This chart was uploaded by Investor/RT 13.6.15 showing symbol: @ES#. |
View |