 |
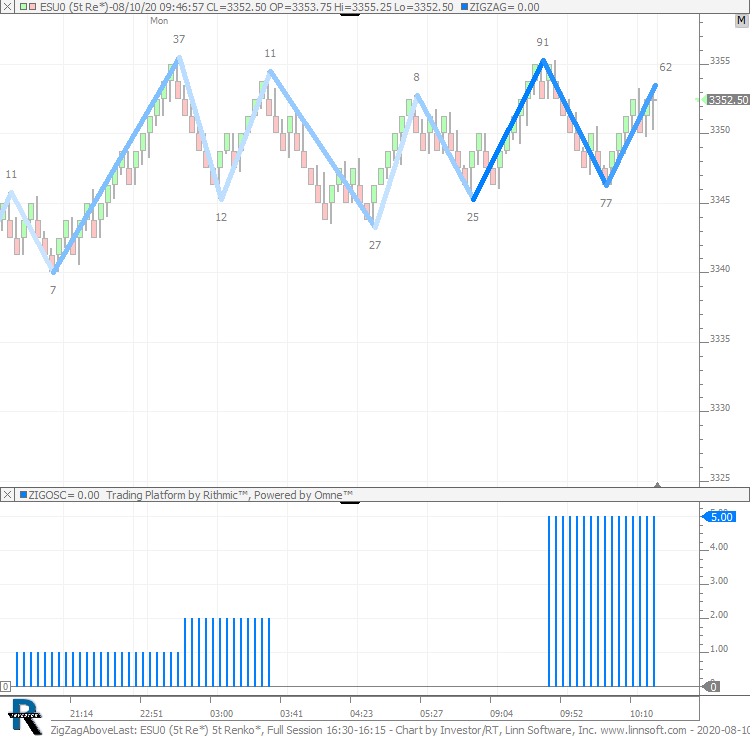
ZigZagAboveLast (ESU0) cpayne [totalcount]
5 years 4 months ago
Above Last - ZZO. This chart was uploaded by Investor/RT 14.1.3 showing symbol: ESU0. |
View |
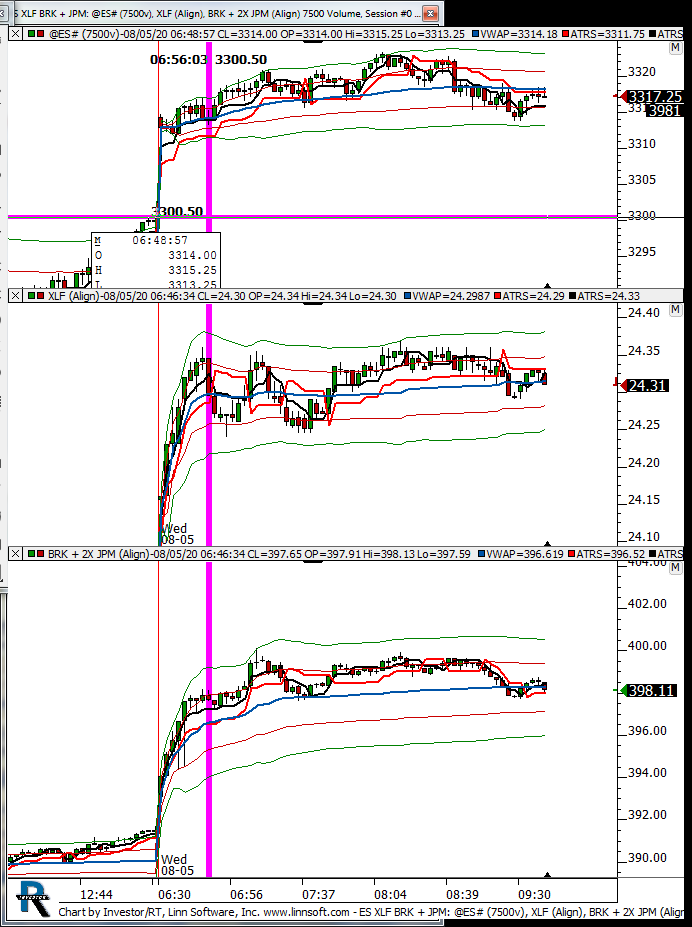 |
ES XLF BRK JPM (@ES#) kencassorla [totalcount]
5 years 4 months ago
xlf. This chart was uploaded by Investor/RT 13.6.15 showing symbol: @ES#. |
View |
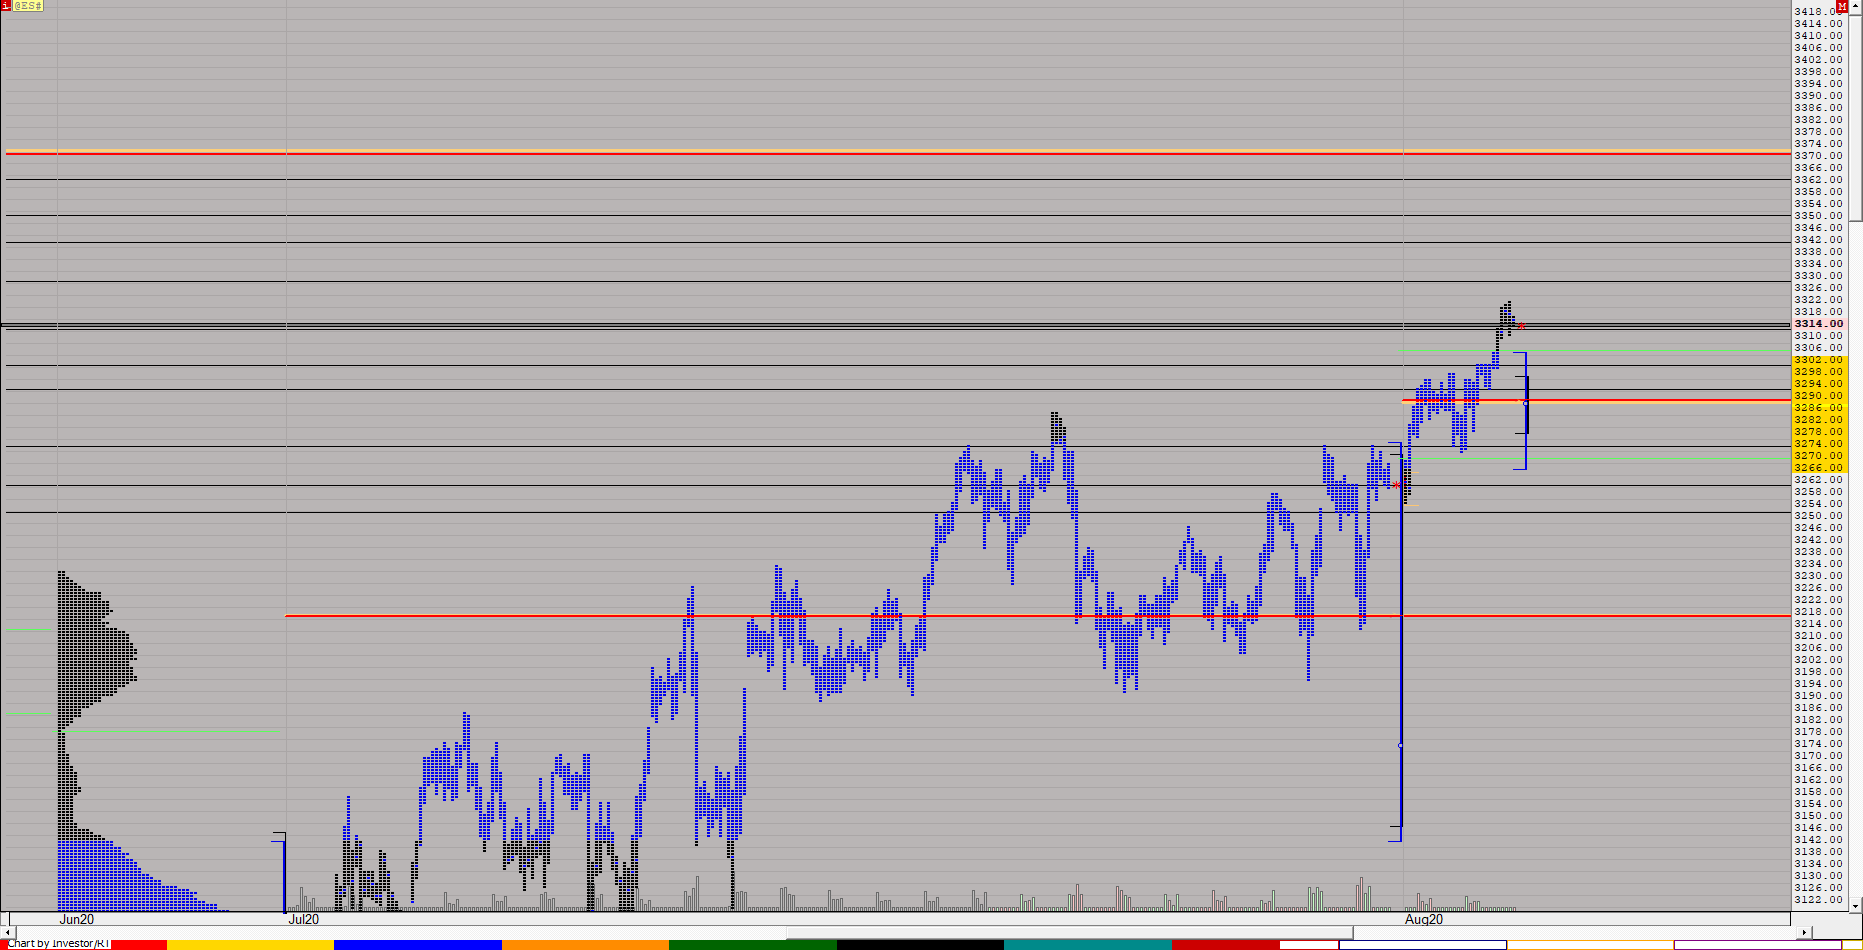 |
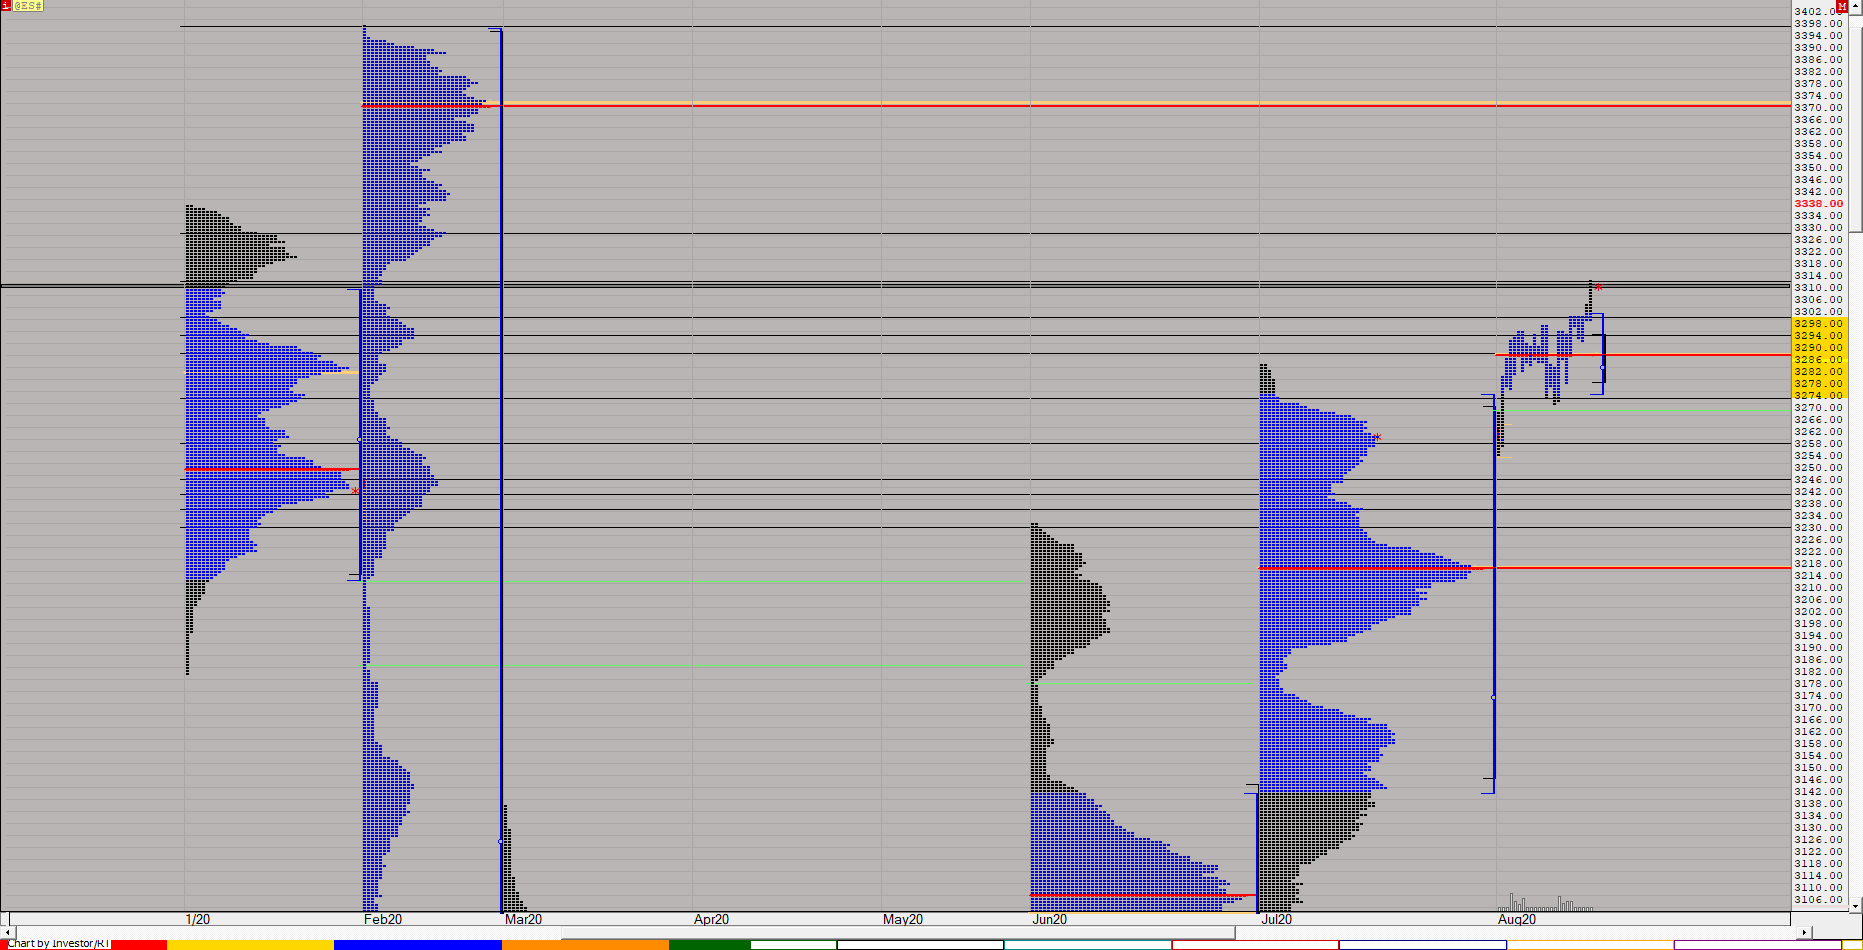
ESTPOMONTHLYa (@ES#) ES42 [totalcount]
5 years 4 months ago
Monthly Ptofiles 2 hour Candles. This chart was uploaded by Investor/RT 13.6.15 showing symbol: @ES#. |
View |
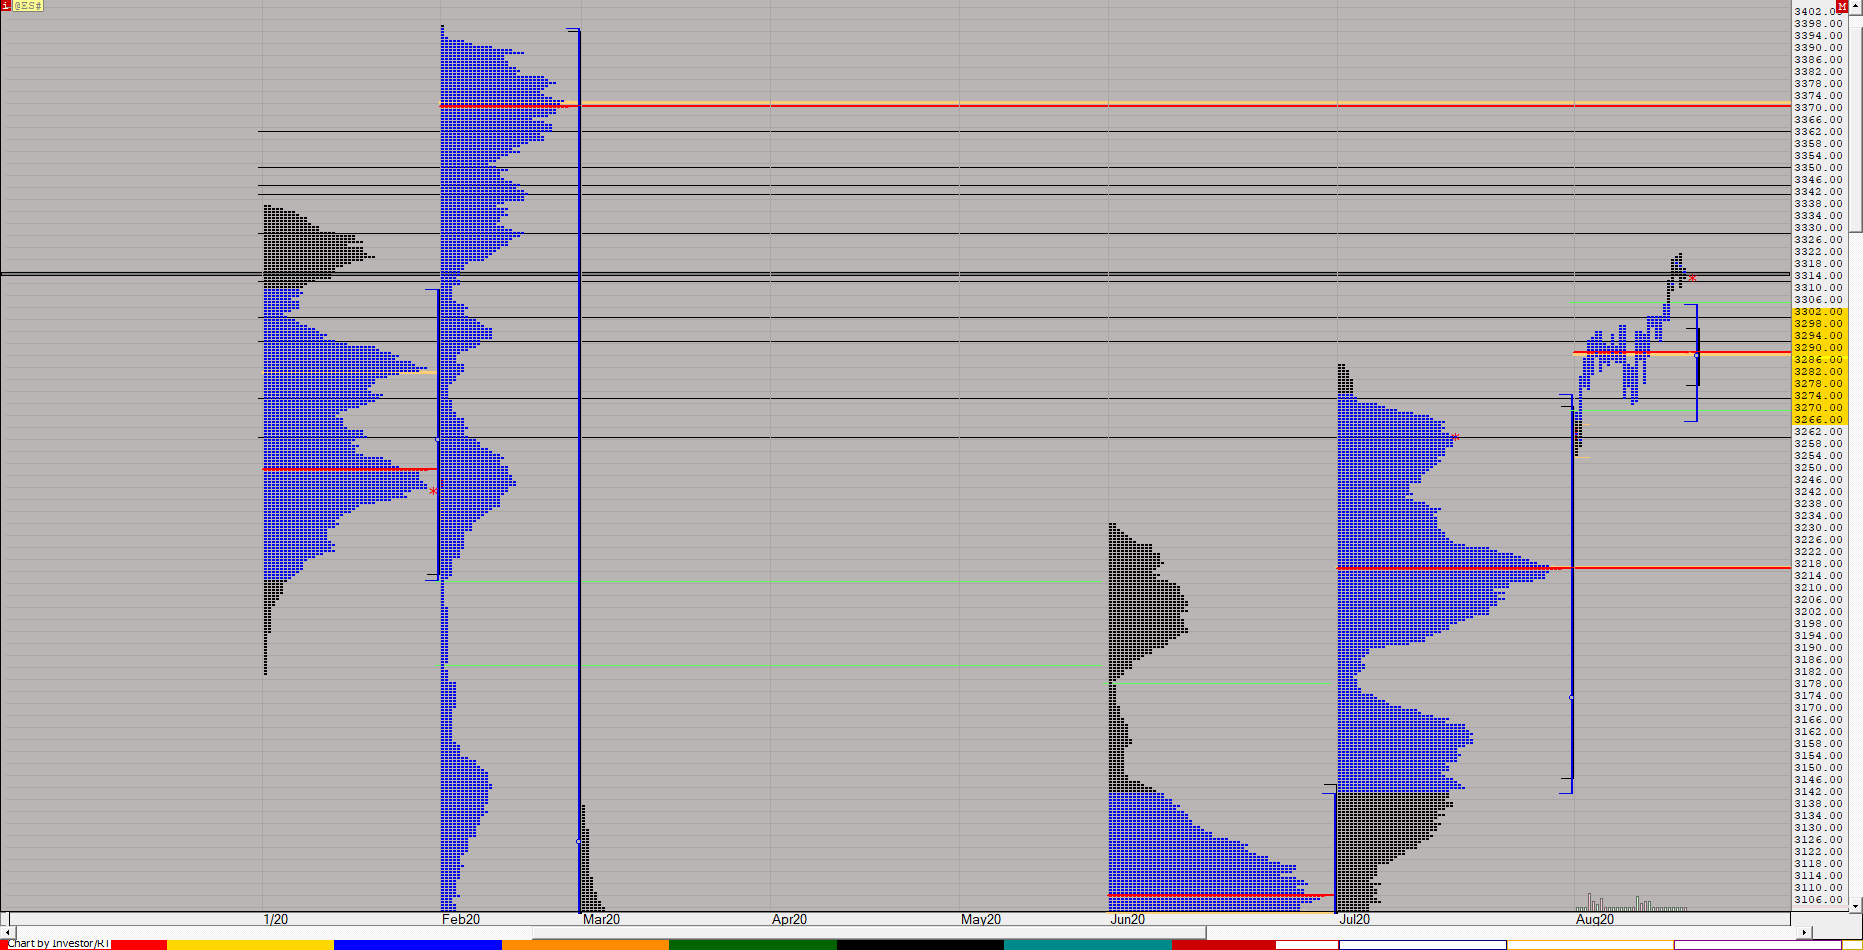 |
ESTPOMONTHLY (@ES#) ES42 [totalcount]
5 years 4 months ago
This chart was uploaded by Investor/RT 13.6.3 showing symbol: @ES#. |
View |
 |
ES 60M (@ES#) ES42 [totalcount]
5 years 4 months ago
Monthly Ptofiles 2 hour Candles. This chart was uploaded by Investor/RT 13.6.15 showing symbol: @ES#. |
View |
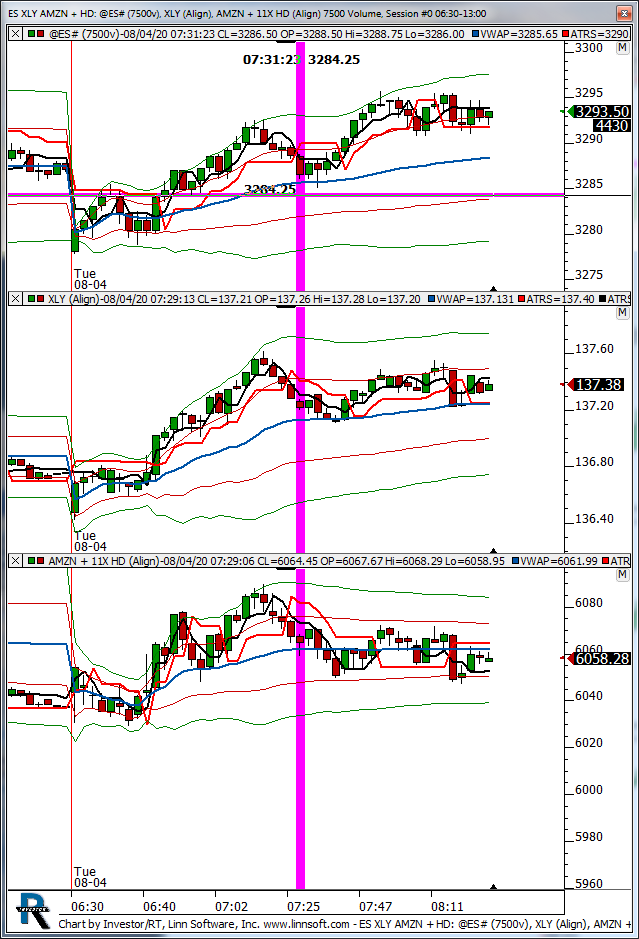 |
ES XLY AMZN HD (@ES#) kencassorla [totalcount]
5 years 4 months ago
xly. This chart was uploaded by Investor/RT 13.6.15 showing symbol: @ES#. |
View |
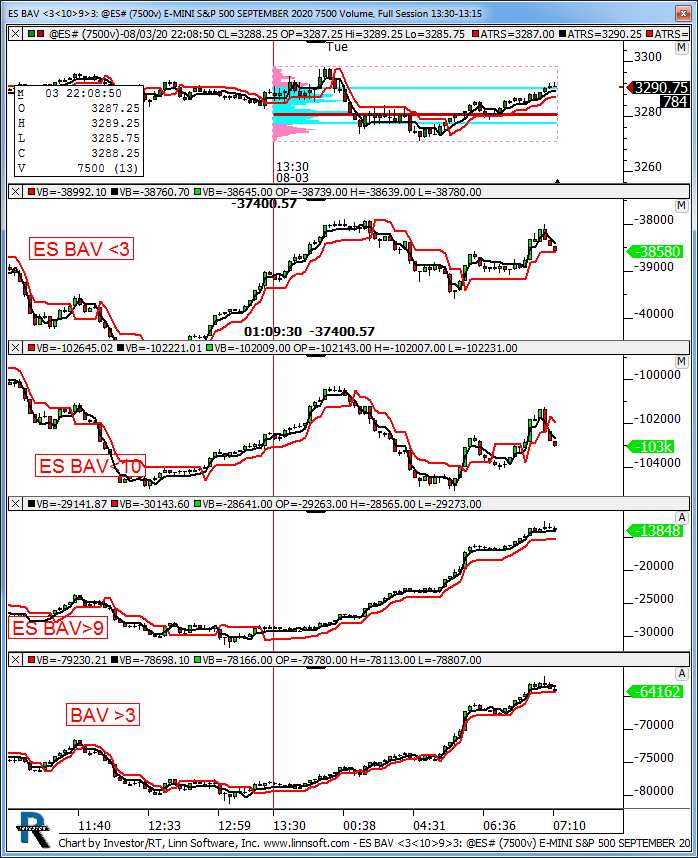 |
ES BAV 31093 (@ES#) kencassorla [totalcount]
5 years 4 months ago
subs. This chart was uploaded by Investor/RT 13.6.15 showing symbol: @ES#. |
View |
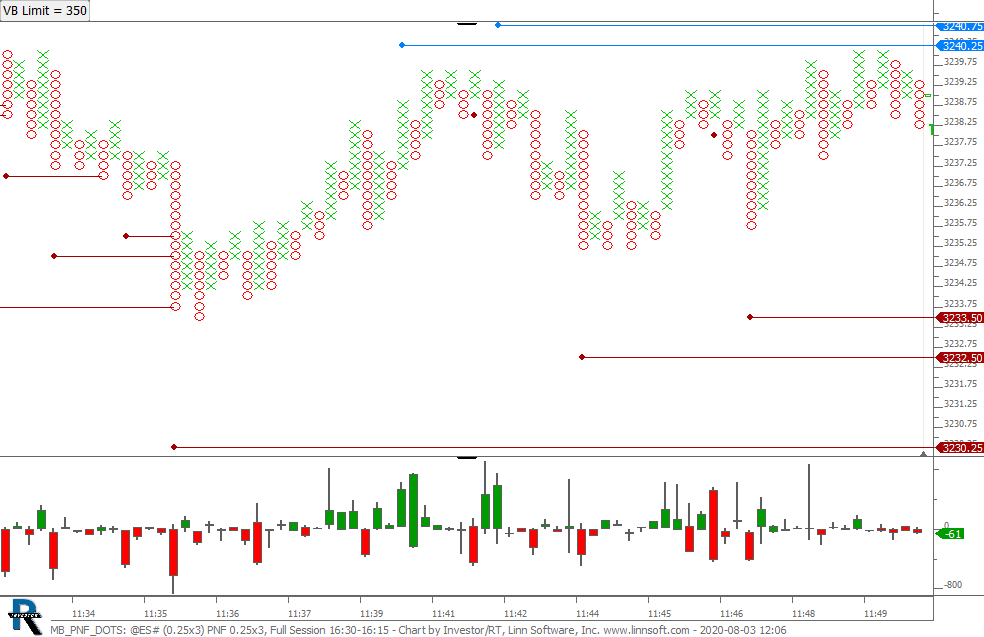 |
MB PNF DOTS (@ES#) cpayne [totalcount]
5 years 4 months ago
This chart was uploaded by Investor/RT 14.1.3 showing symbol: @ES#. |
View |
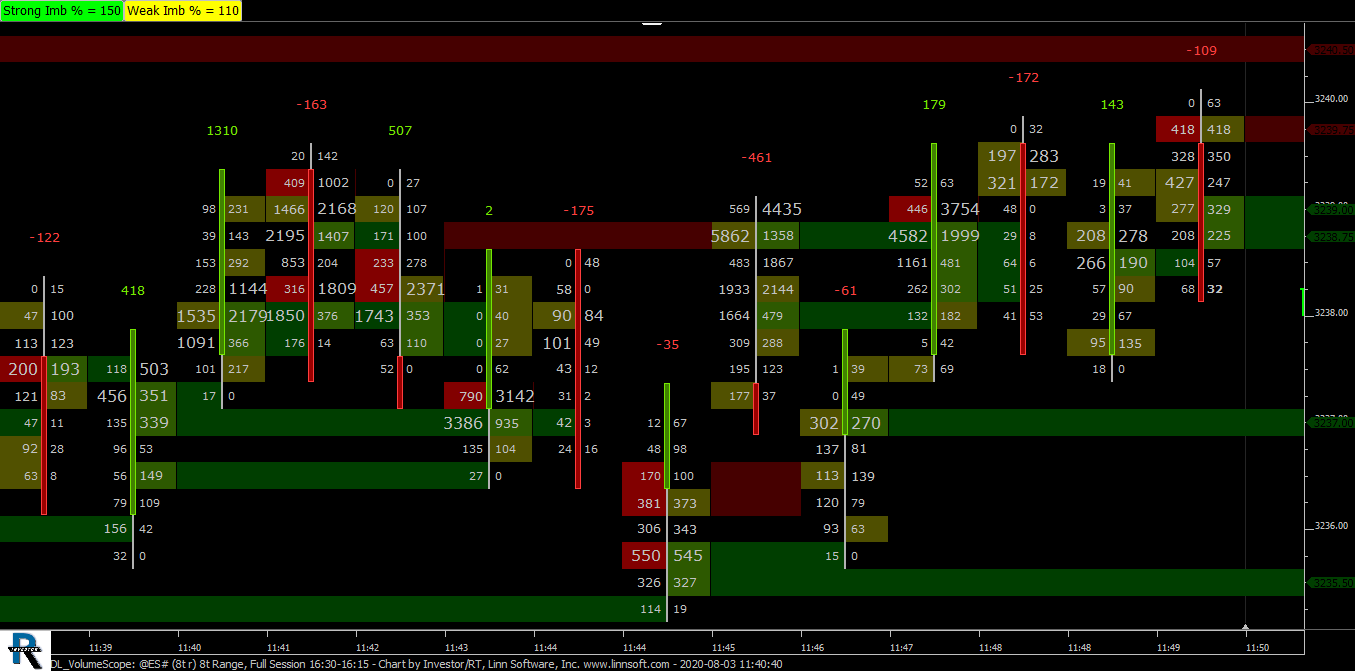 |
DL VolumeScope (@ES#) cpayne [totalcount]
5 years 4 months ago
This chart was uploaded by Investor/RT 14.1.3 showing symbol: @ES#. |
View |
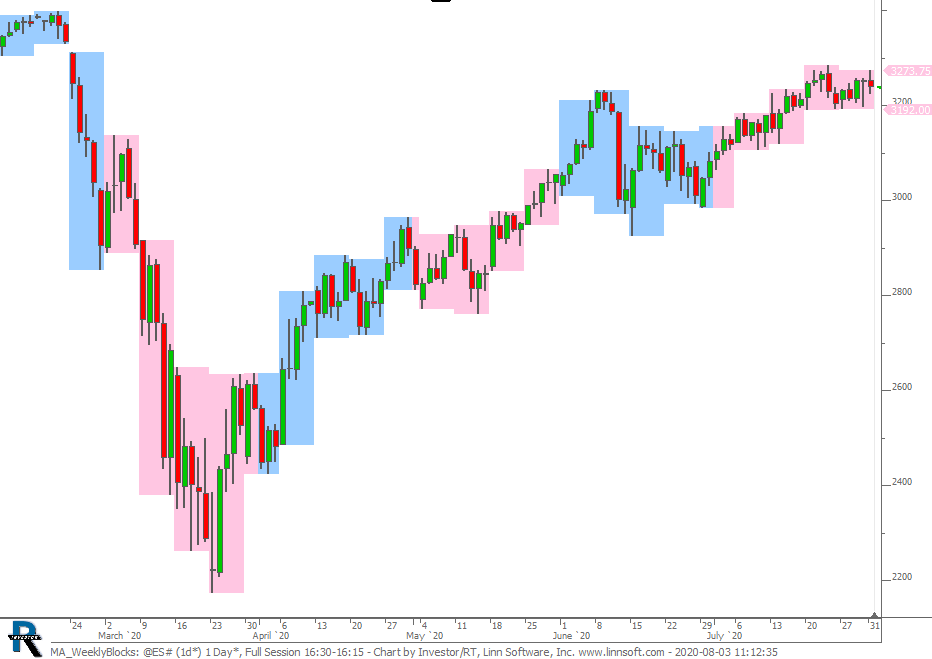 |
MA WeeklyBlocks (@ES#) cpayne [totalcount]
5 years 4 months ago
This chart was uploaded by Investor/RT 14.1.3 showing symbol: @ES#. |
View |
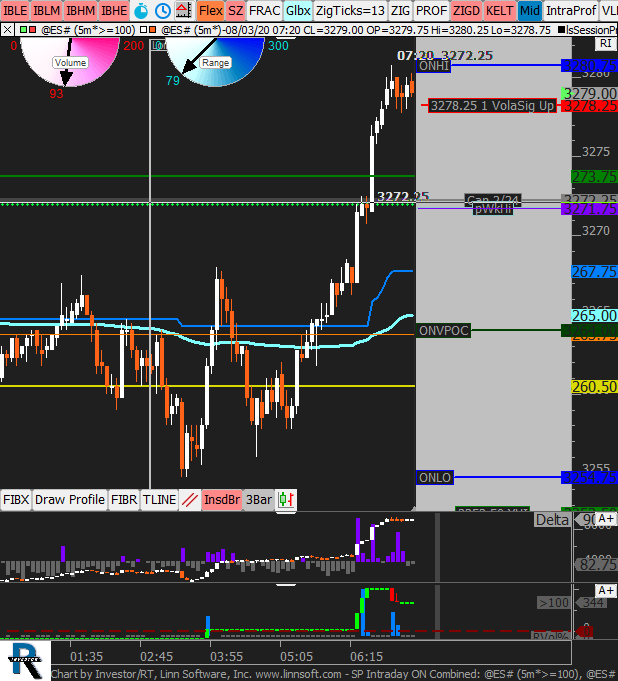 |
SP Intraday ON Combined (@ES#) SPetkov [totalcount]
5 years 4 months ago
This chart was uploaded by Investor/RT 13.5.12 showing symbol: @ES#. |
View |
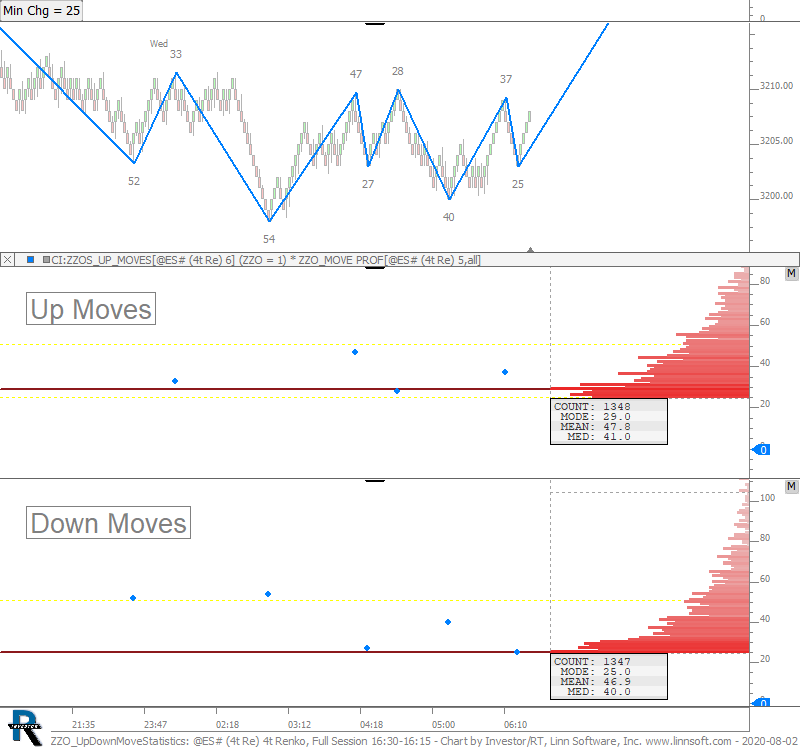 |
ZZO UpDownMoveStatistics (@ES#) cpayne [totalcount]
5 years 4 months ago
Up and Down Move Statistics using the ZZO Indicator in combination with the Profile Indicator to give Mode, Mean, and Median of all Up Moves as well as Down Moves. |
View |
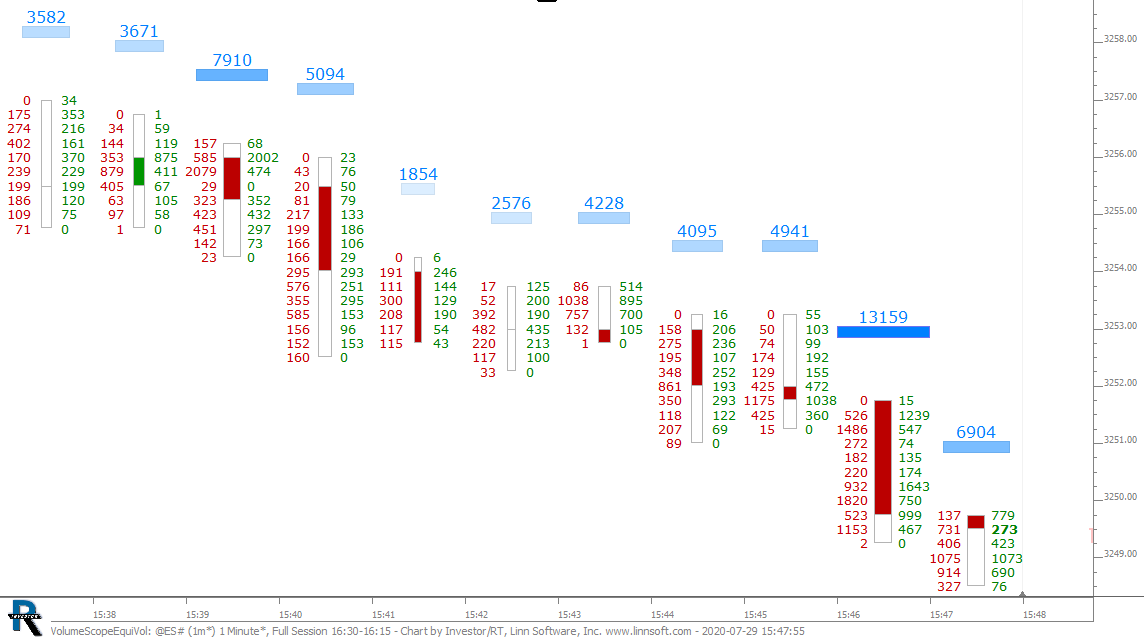 |
VolumeScopeEquiVol (@ES#) cpayne [totalcount]
5 years 4 months ago
This chart was uploaded by Investor/RT 14.1.3 showing symbol: @ES#. |
View |
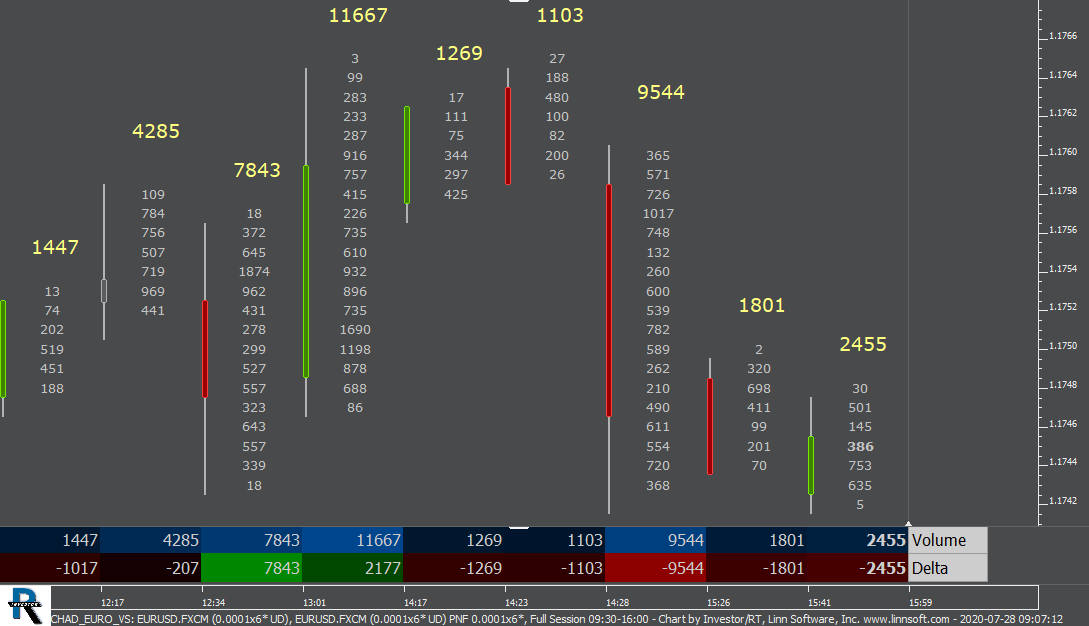 |
CHAD EURO VS (EURUSD.FXCM) cpayne [totalcount]
5 years 4 months ago
This chart was uploaded by Investor/RT 14.1.3 showing symbol: EURUSD.FXCM. |
View |
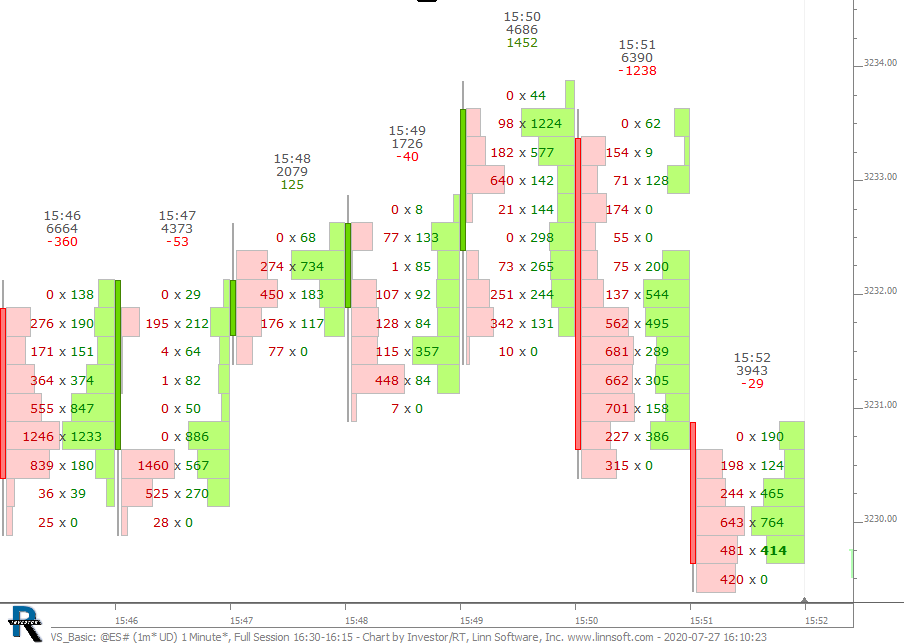 |
VS Basic (@ES#) cpayne [totalcount]
5 years 4 months ago
This chart was uploaded by Investor/RT 14.1.3 showing symbol: @ES#. |
View |
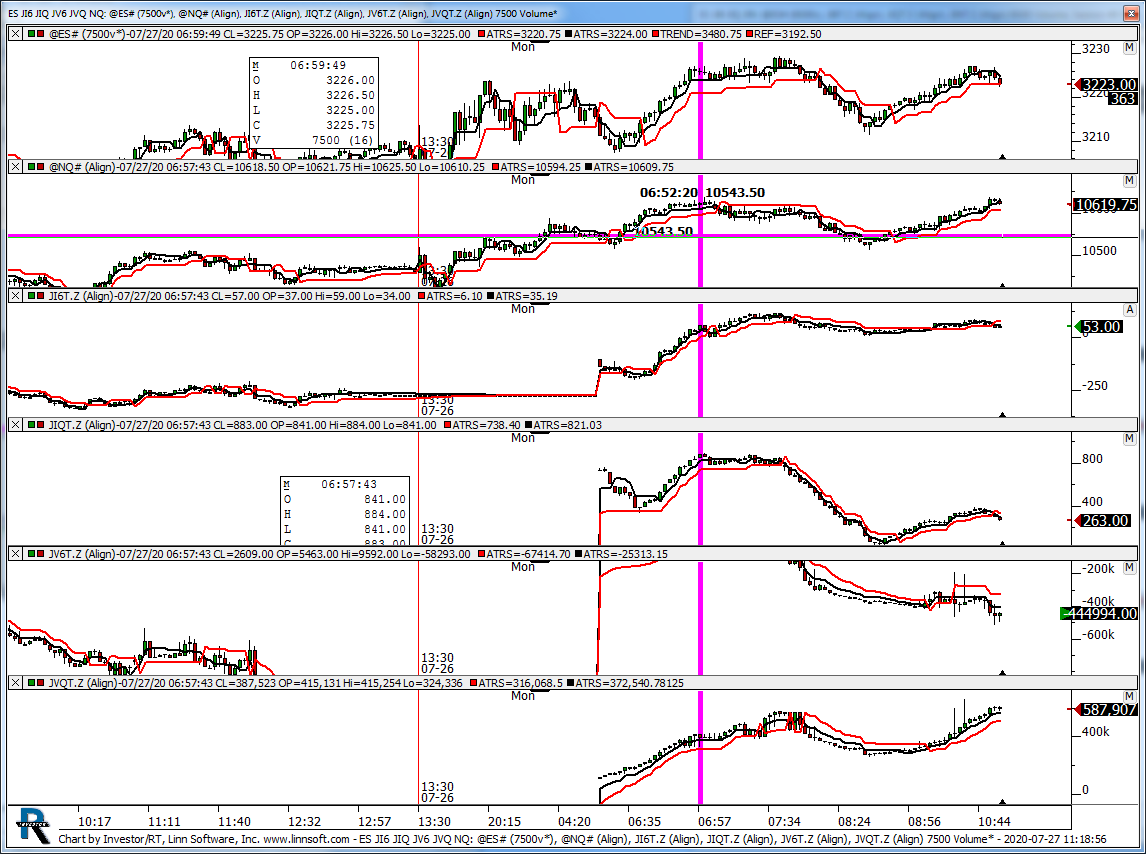 |
ES JI6 JIQ JV6 JVQ NQ (@ES#) kencassorla [totalcount]
5 years 4 months ago
jv's. This chart was uploaded by Investor/RT 13.6.15 showing symbol: @ES#. |
View |
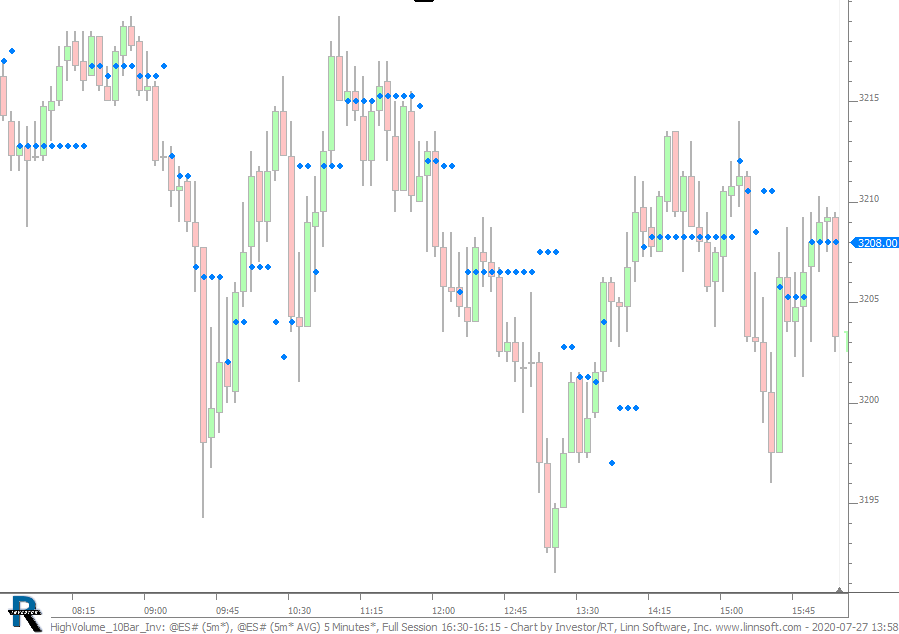 |
HighVolume 10Bar Inv (@ES#) cpayne [totalcount]
5 years 4 months ago
This chart was uploaded by Investor/RT 14.1.3 showing symbol: @ES#. |
View |
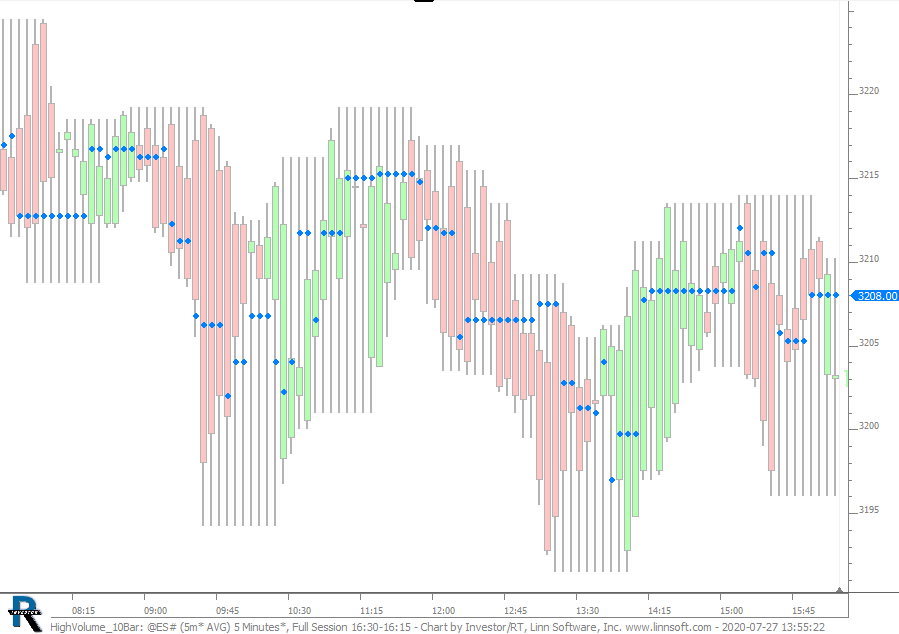 |
HighVolume 10Bar (@ES#) cpayne [totalcount]
5 years 4 months ago
High Volume Node - Moving 10 Bar. This chart was uploaded by Investor/RT 14.1.3 showing symbol: @ES#. |
View |
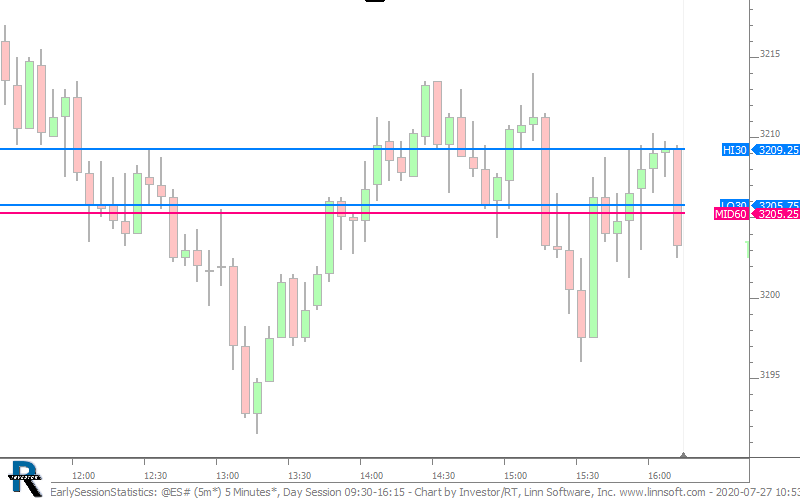 |
EarlySessionStatistics (@ES#) cpayne [totalcount]
5 years 4 months ago
High/Low of 1st 30 seconds of day session. Midpoint of 1st hour of trading of day session. This chart was uploaded by Investor/RT 14.1.3 showing symbol: @ES#. |
View |
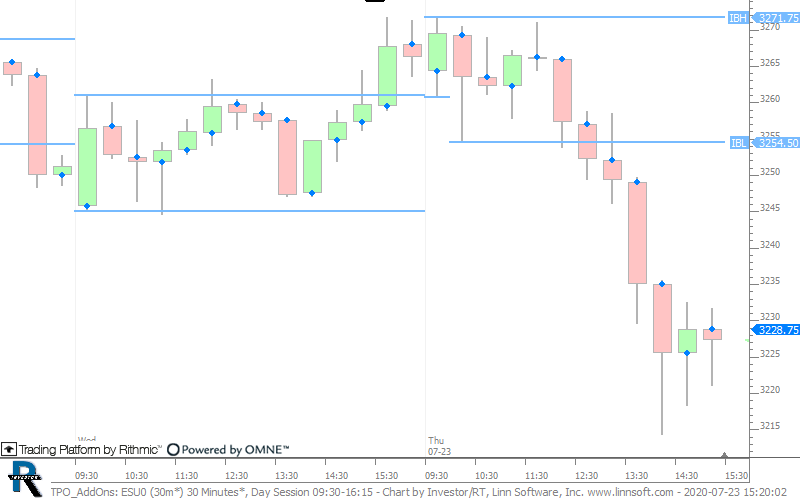 |
TPO AddOns (ESU0) cpayne [totalcount]
5 years 5 months ago
This chart was uploaded by Investor/RT 14.1.3 showing symbol: ESU0. |
View |
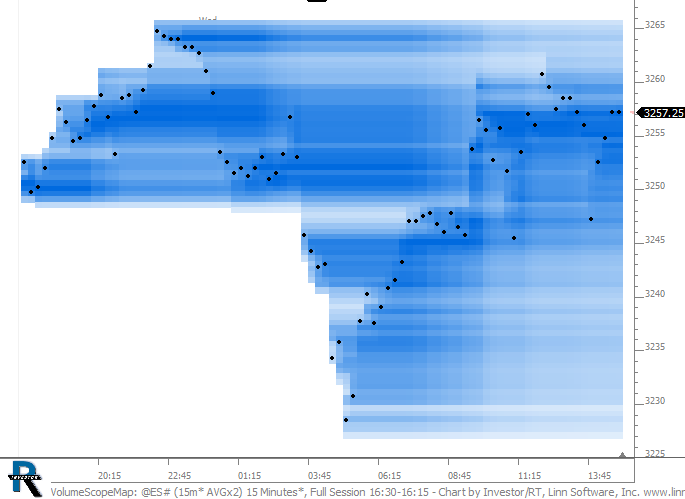 |
VolumeScopeMap (@ES#) cpayne [totalcount]
5 years 5 months ago
This chart was uploaded by Investor/RT 14.1.2 showing symbol: @ES#. |
View |
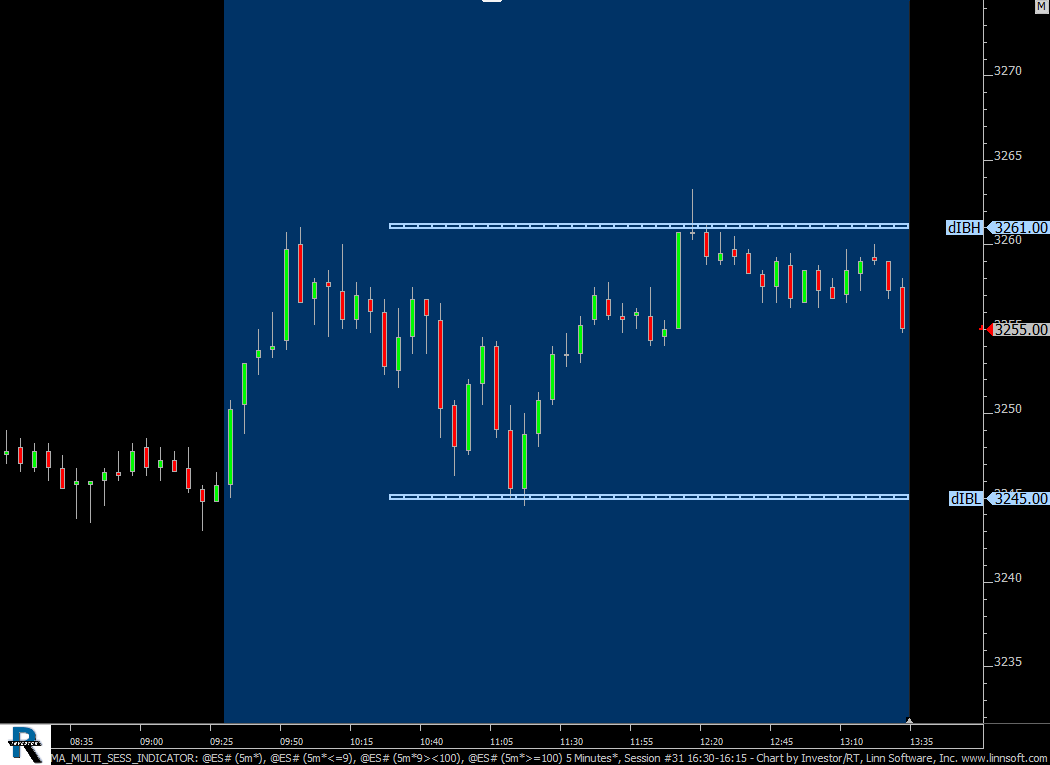 |
MA MULTI SESS INDICATOR (@ES#) cpayne [totalcount]
5 years 5 months ago
Day Session IBH and IBL - hidden for 1st 60 minutes of day session. Works on charts of any periodicity and any session. |
View |
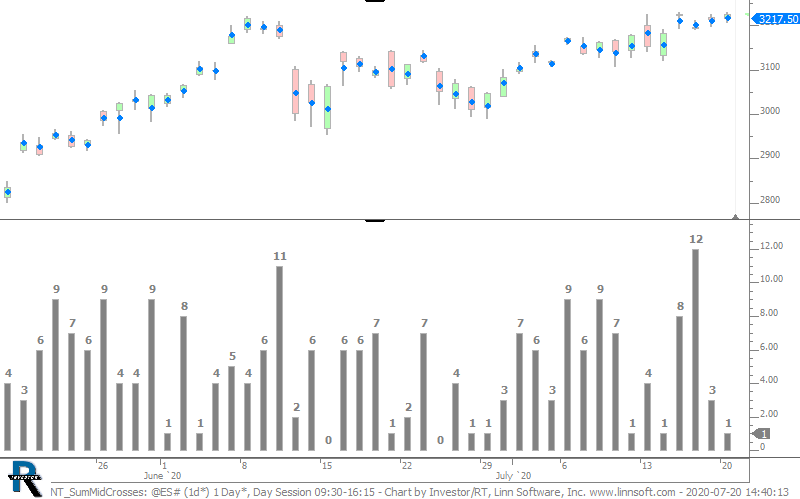 |
NT SumMidCrosses (@ES#) cpayne [totalcount]
5 years 5 months ago
Sum number of times each session that 30-min bars touch session midpoint. To change to 5-min, change the periodicity of the MPD within the custom indicator. |
View |
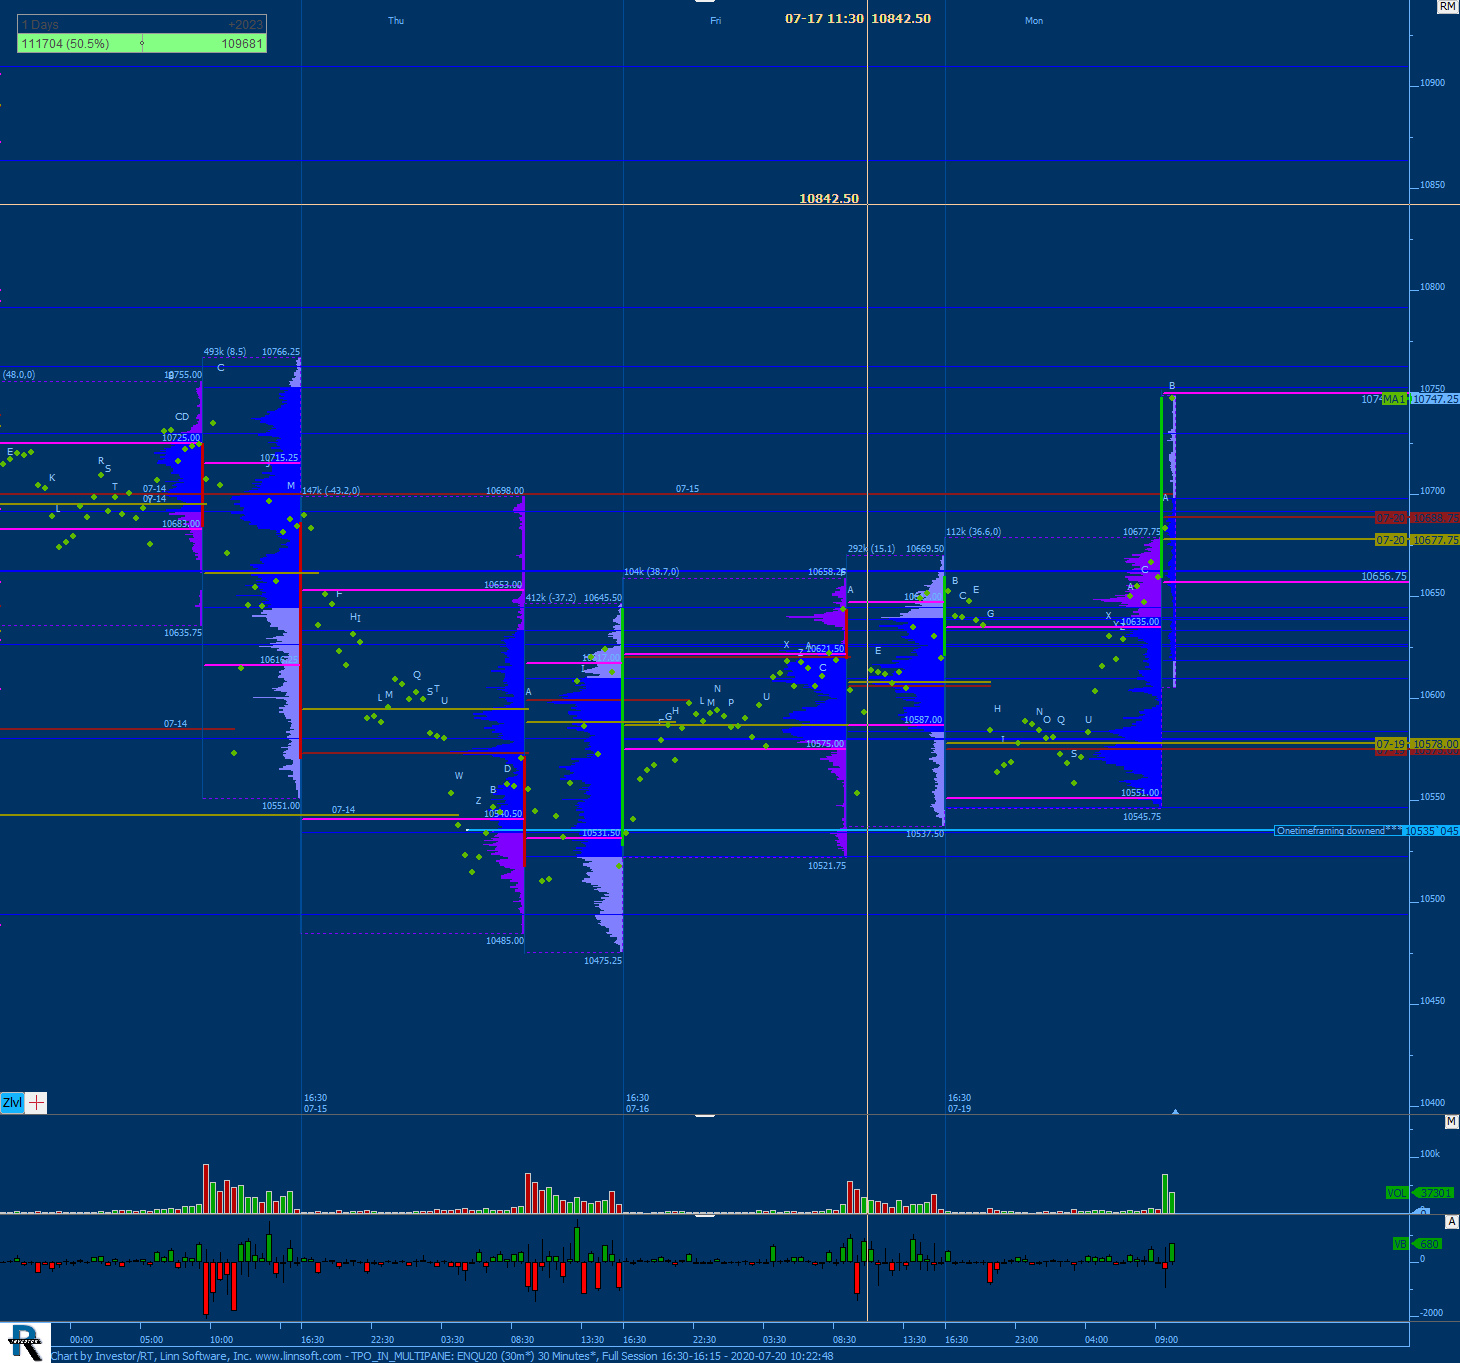 |
TPO IN MULTIPANE (ENQU20) Benoit Doyle [totalcount]
5 years 5 months ago
This chart was uploaded by Investor/RT 14.1.1 showing symbol: ENQU20. |
View |
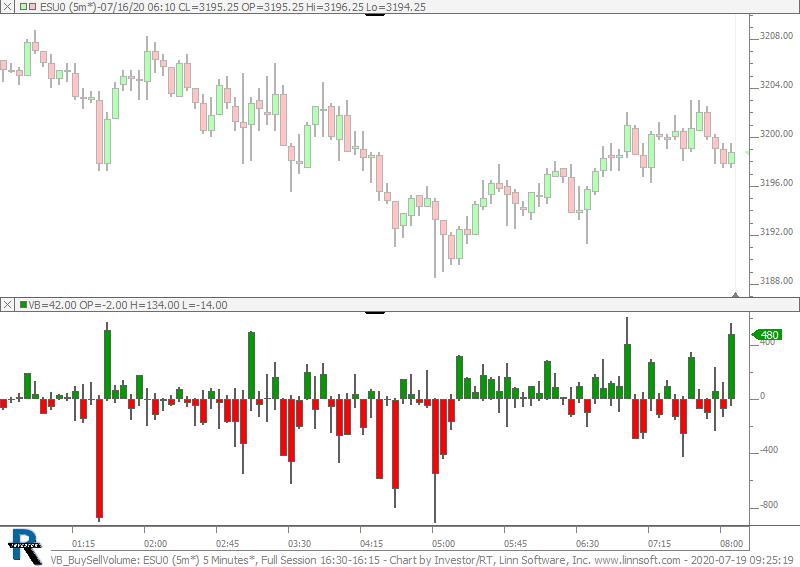 |
VB BuySellVolume (ESU0) cpayne [totalcount]
5 years 5 months ago
This chart was uploaded by Investor/RT 14.1.2 showing symbol: ESU0. |
View |