 |
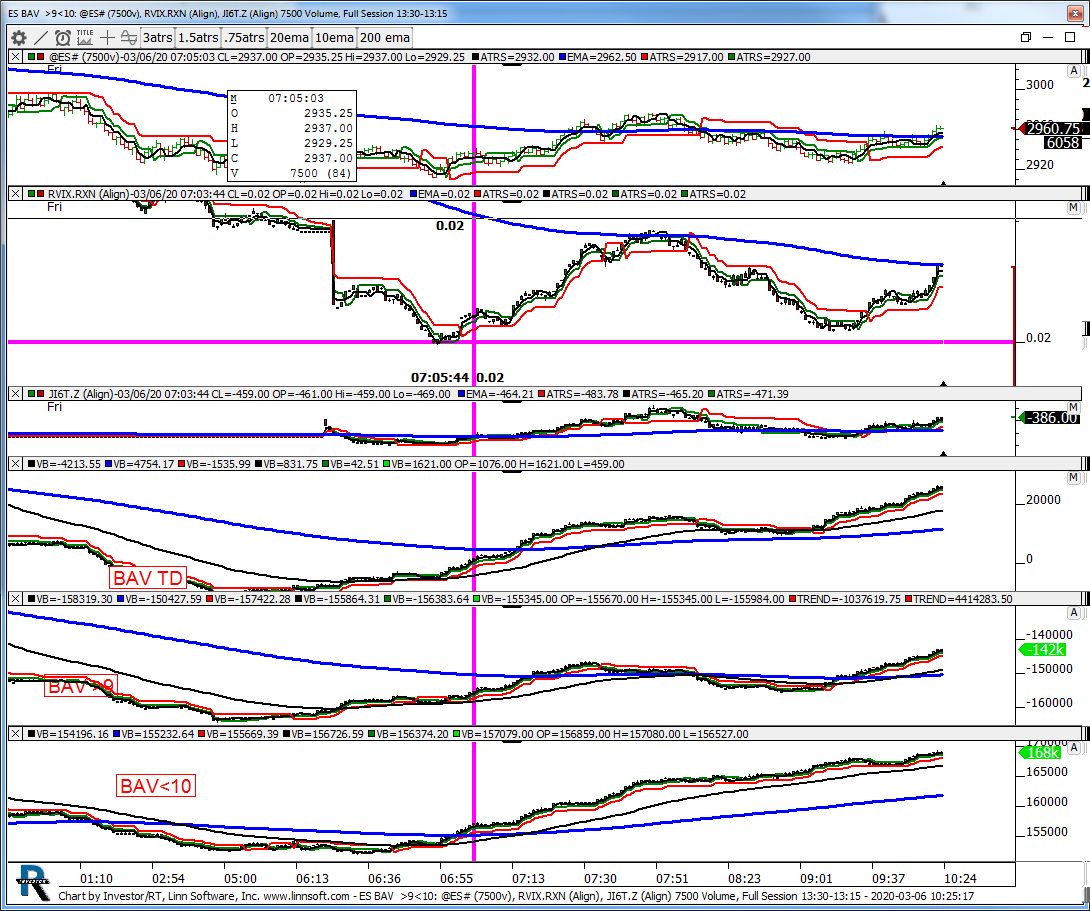
ES BAV 910 (@ES#) kencassorla [totalcount]
5 years 9 months ago
r vix. This chart was uploaded by Investor/RT 13.6.14 showing symbol: @ES#. |
View |
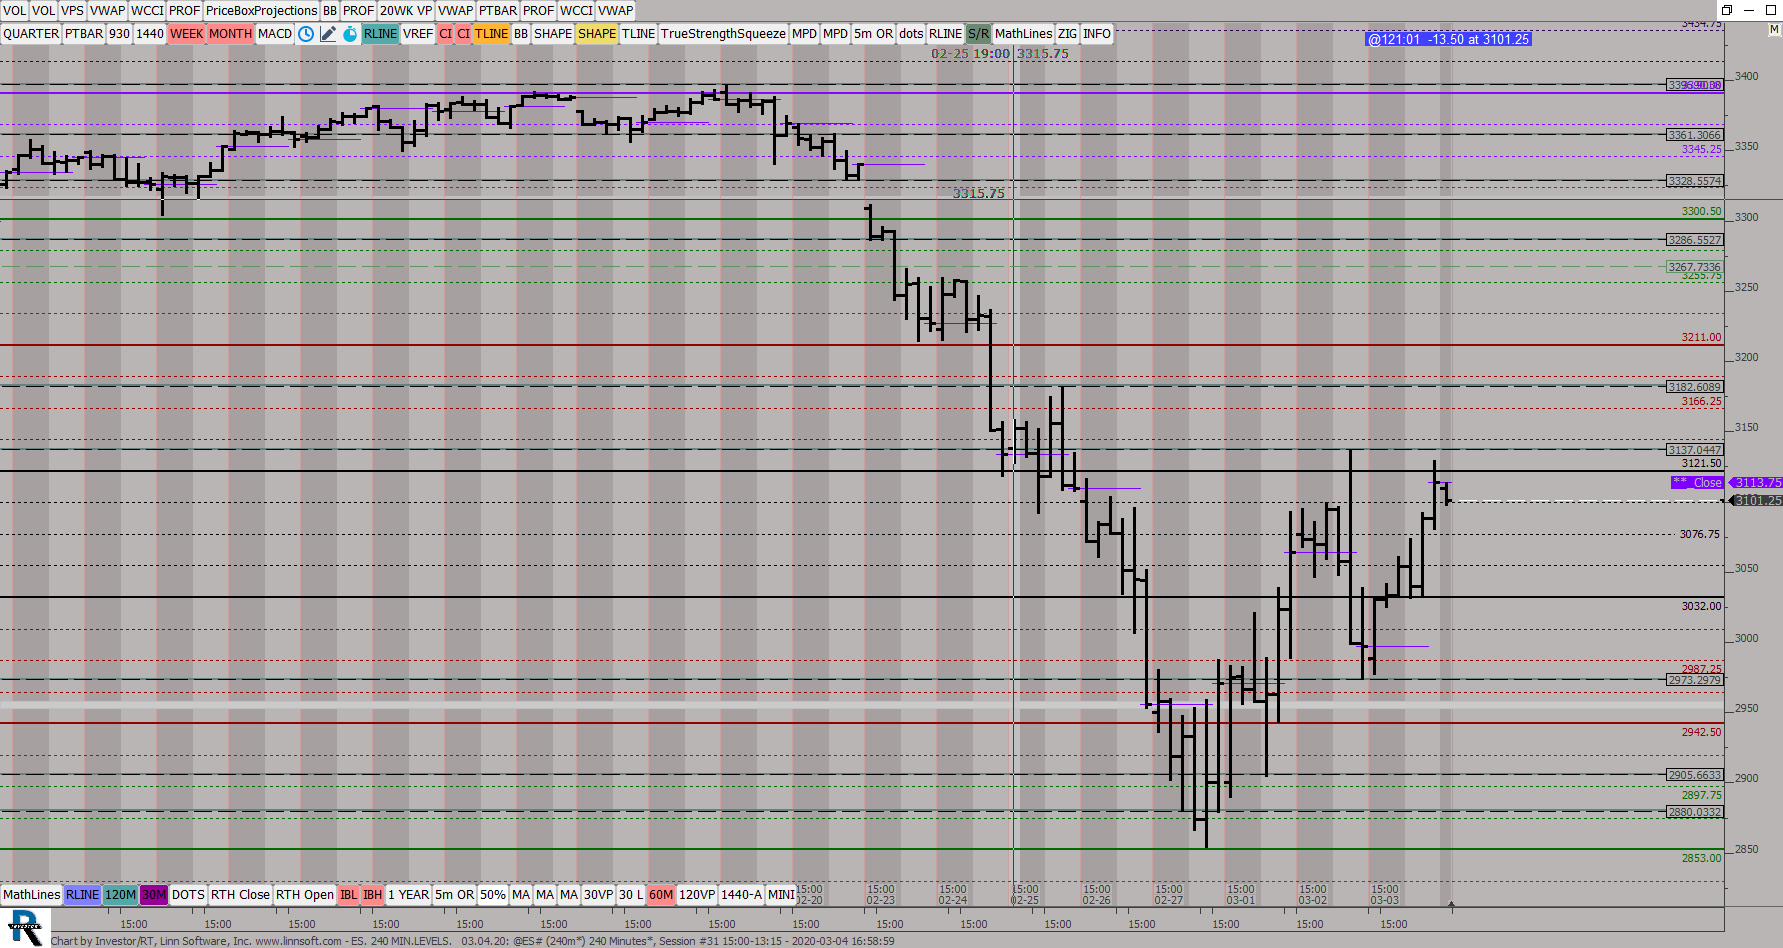 |
ES 240 MINLEVELS (@ES#) ES42 [totalcount]
5 years 9 months ago
240 Min Bar (4 hour Levels). This chart was uploaded by Investor/RT 13.6.3 showing symbol: @ES#. |
View |
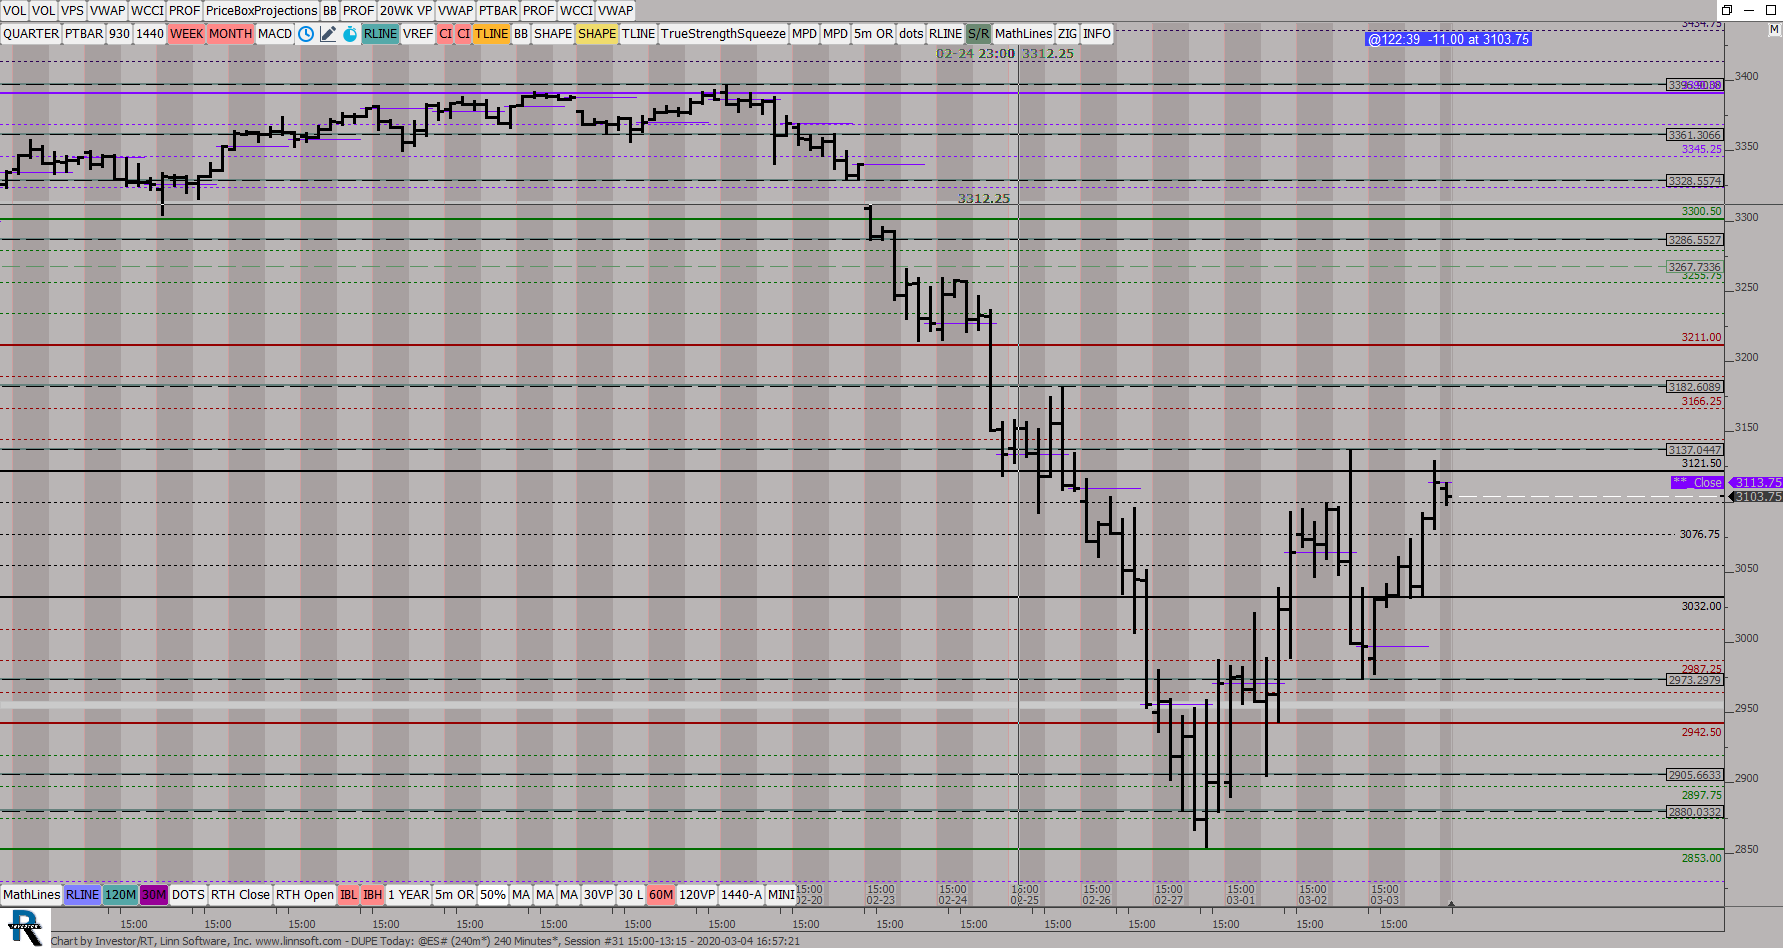 |
DUPE Today (@ES#) ES42 [totalcount]
5 years 9 months ago
240 Min Bar (4 hour Levels). This chart was uploaded by Investor/RT 13.6.3 showing symbol: @ES#. |
View |
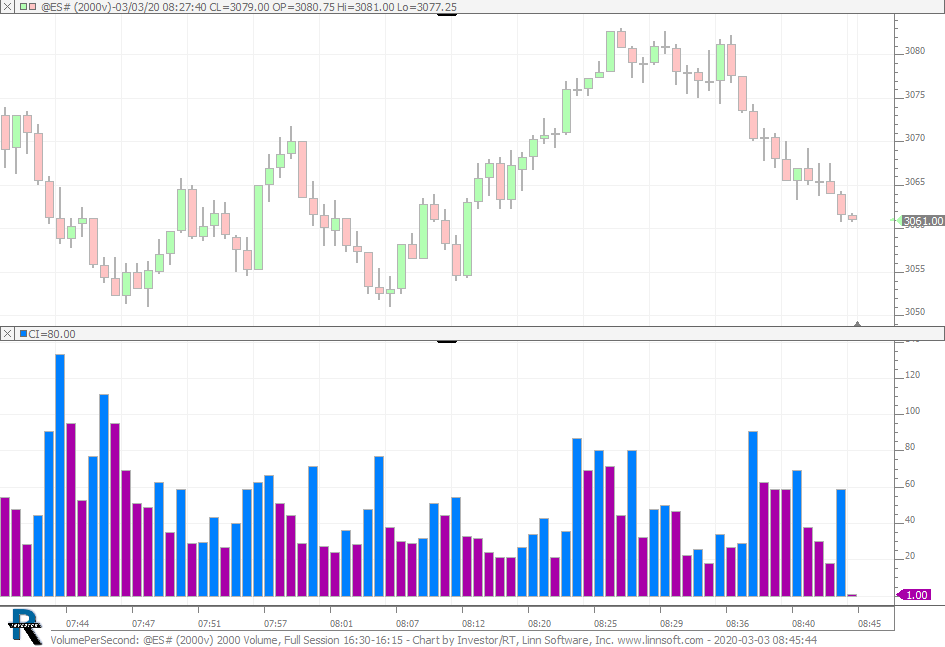 |
VolumePerSecond (@ES#) cpayne [totalcount]
5 years 9 months ago
Volume Per Second. This chart was uploaded by Investor/RT 14.1.1 showing symbol: @ES#. |
View |
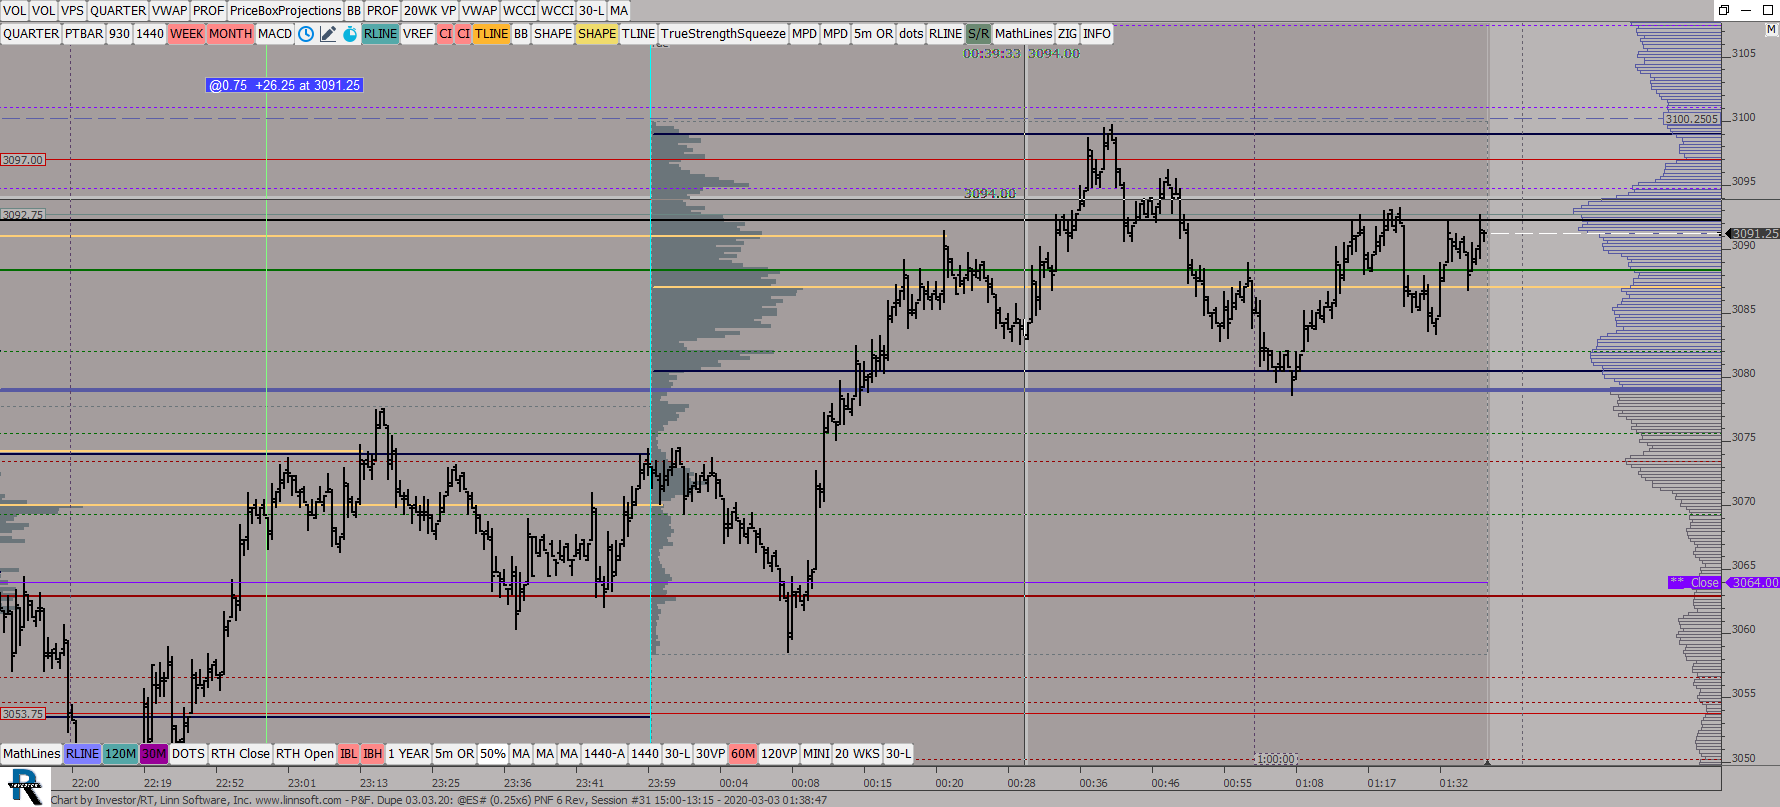 |
PF Dupe (@ES#) ES42 [totalcount]
5 years 9 months ago
This chart was uploaded by Investor/RT 13.6.3 showing symbol: @ES#. |
View |
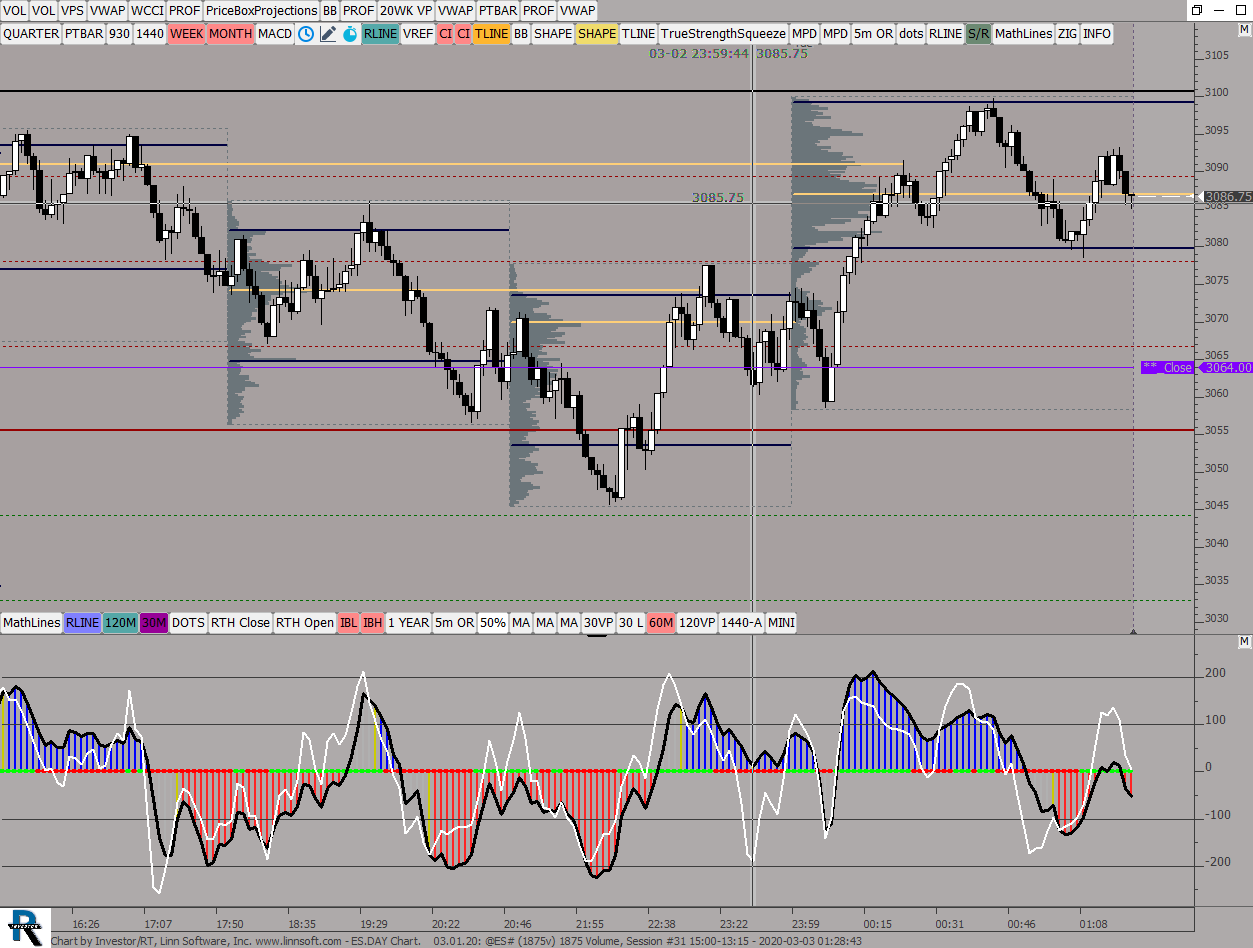 |
ESDAY Chart (@ES#) ES42 [totalcount]
5 years 9 months ago
This chart was uploaded by Investor/RT 13.6.3 showing symbol: @ES#. |
View |
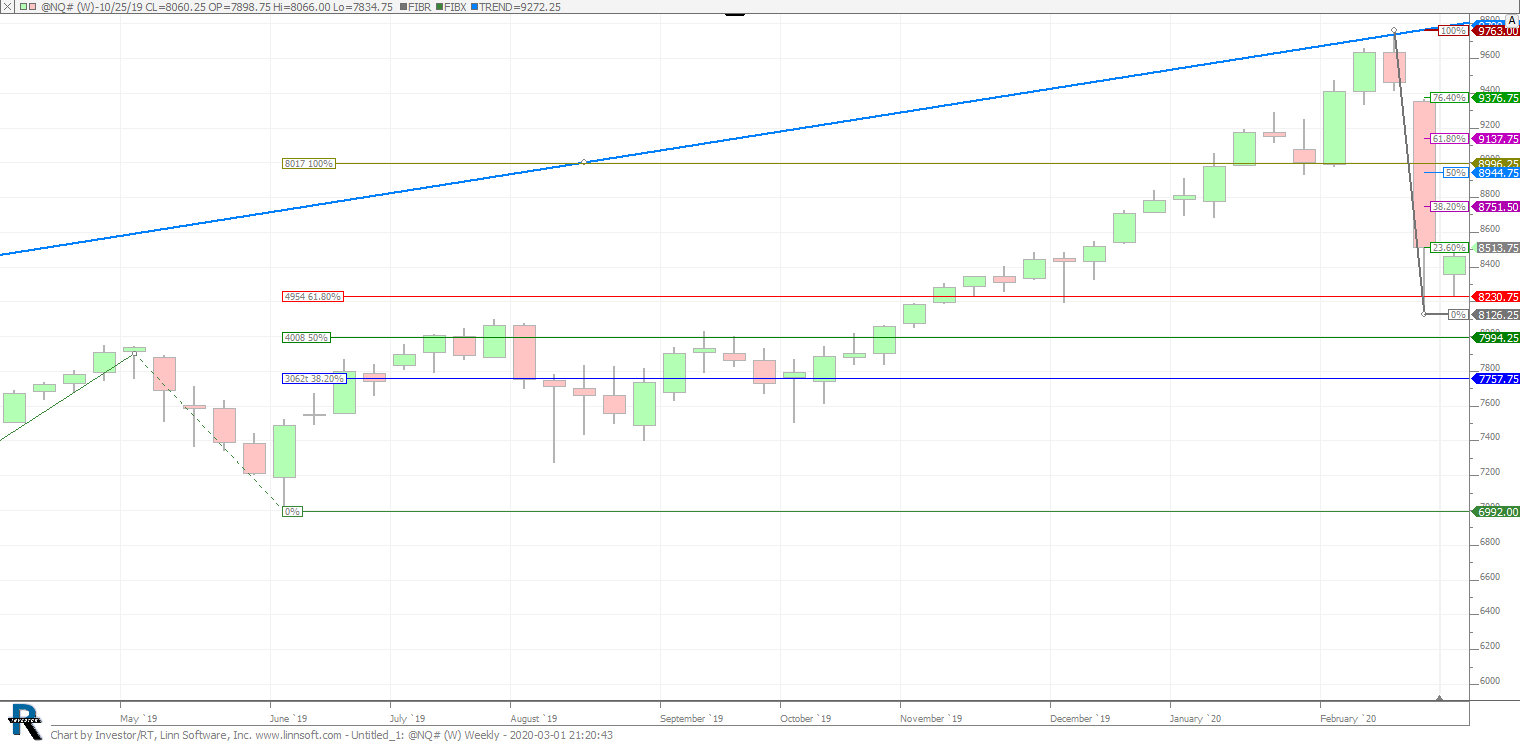 |
Untitled 1 (@NQ#) rjorintas [totalcount]
5 years 9 months ago
NQ Composite. This chart was uploaded by Investor/RT 13.6.12 showing symbol: @NQ#. |
View |
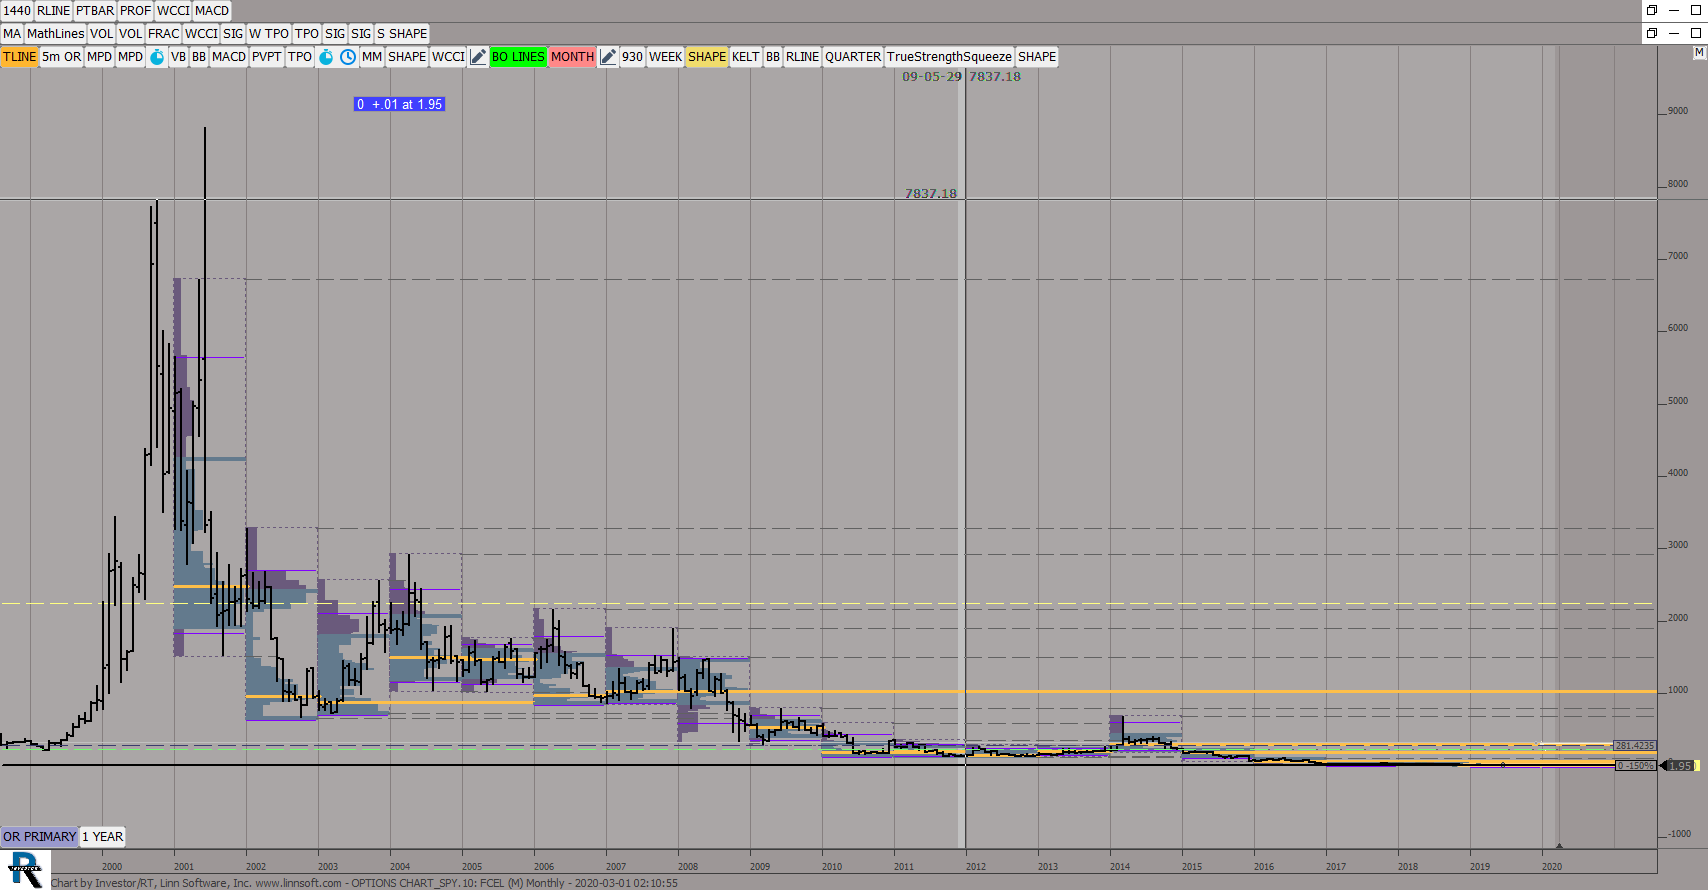 |
OPTIONS CHART SPY (FCEL) ES42 [totalcount]
5 years 9 months ago
This chart was uploaded by Investor/RT 13.6.3 showing symbol: FCEL. |
View |
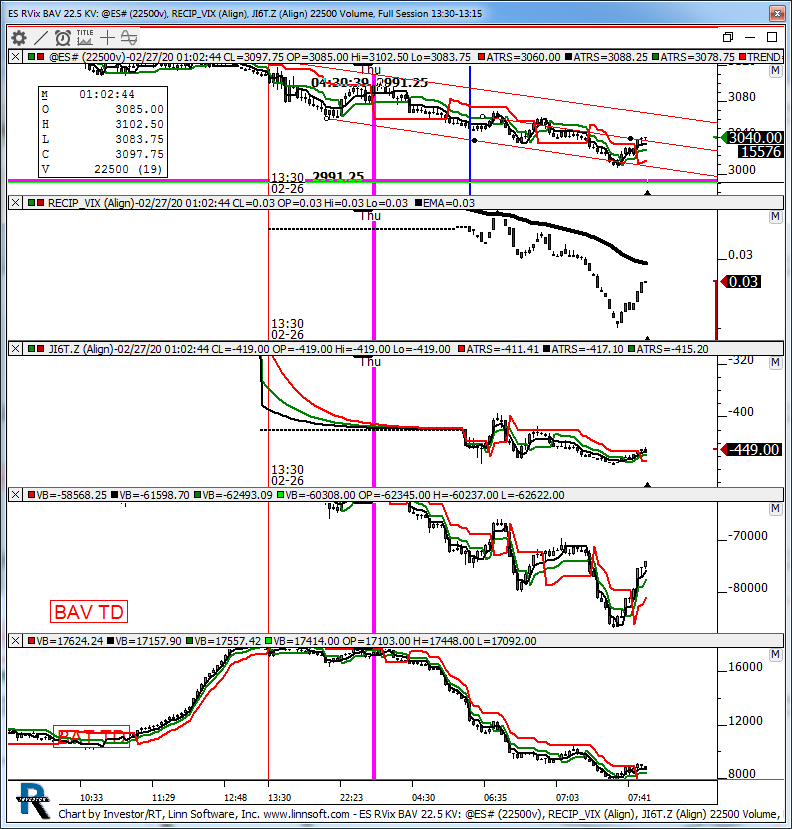 |
ES RVix BAV 225 KV (@ES#) kencassorla [totalcount]
5 years 9 months ago
poc. This chart was uploaded by Investor/RT 13.6.3 showing symbol: @ES#. |
View |
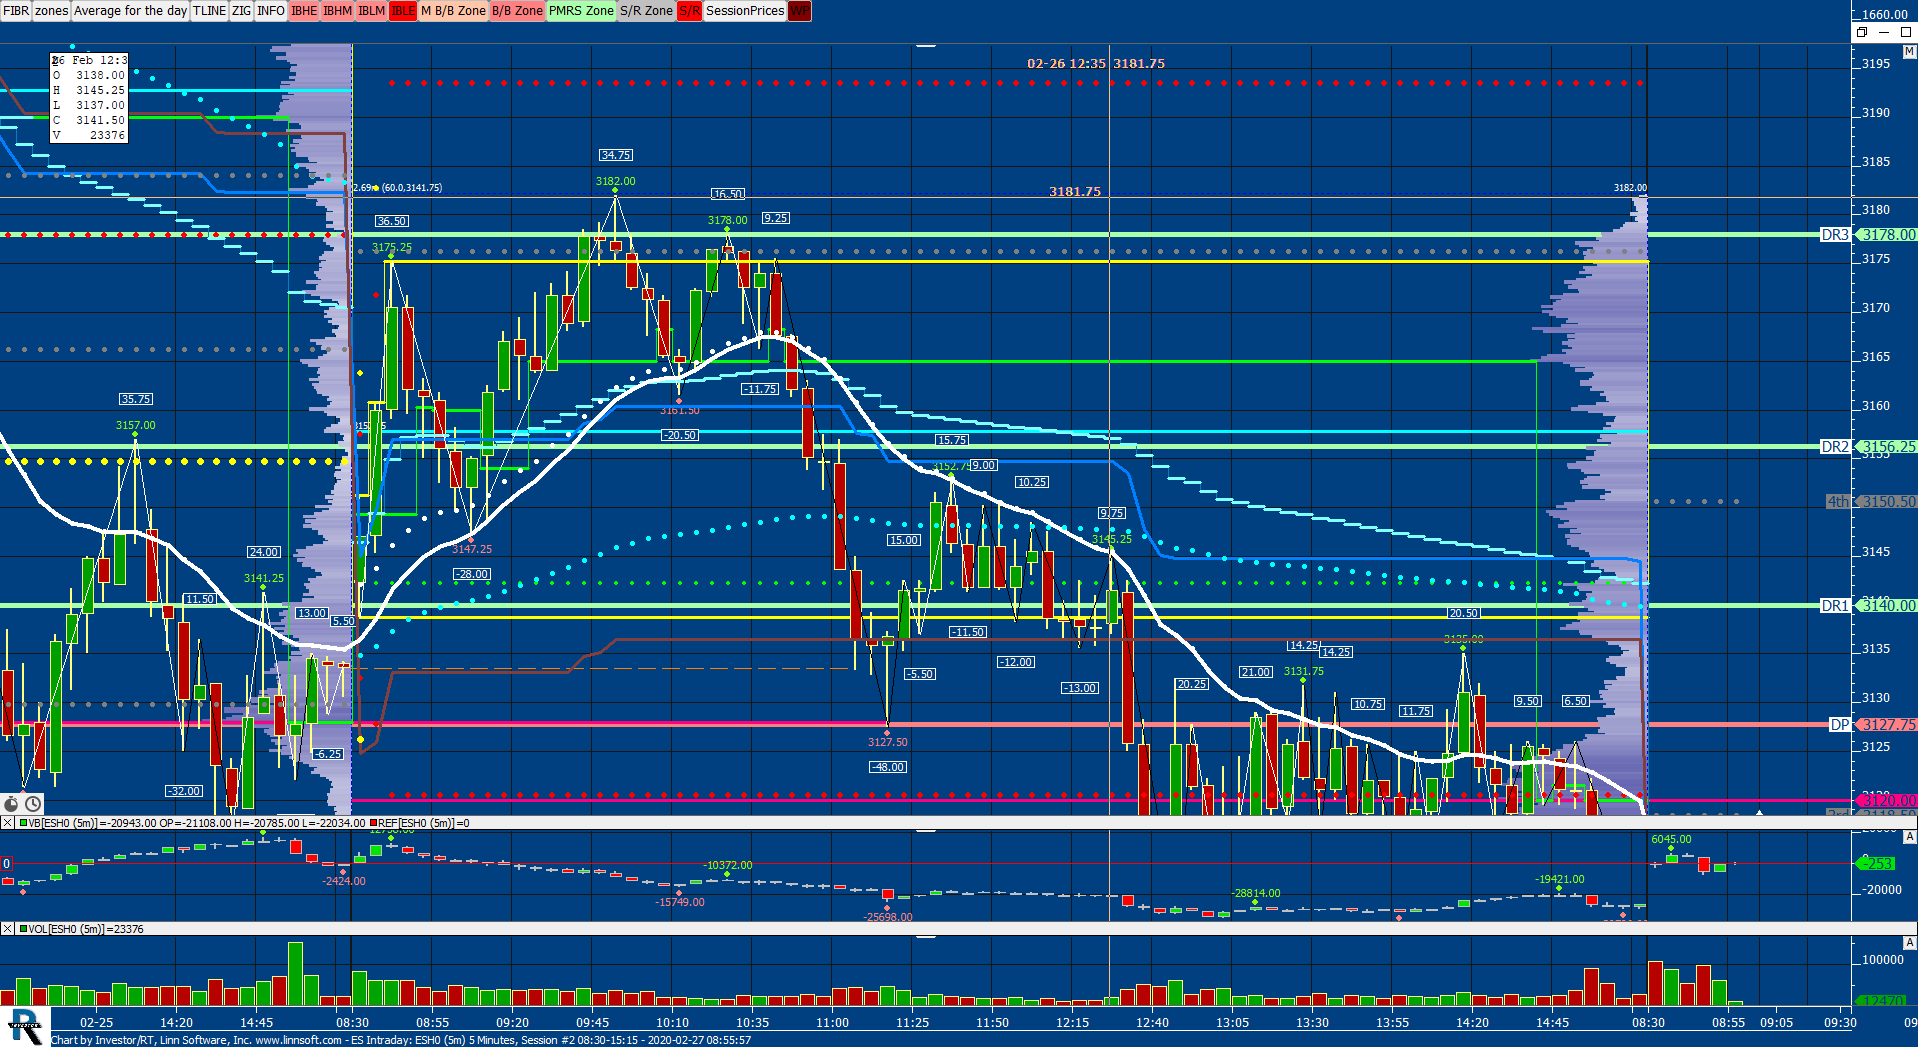 |
ES Intraday (ESH0) scottz46 [totalcount]
5 years 9 months ago
This chart was uploaded by Investor/RT 13.6.3 showing symbol: ESH0. |
View |
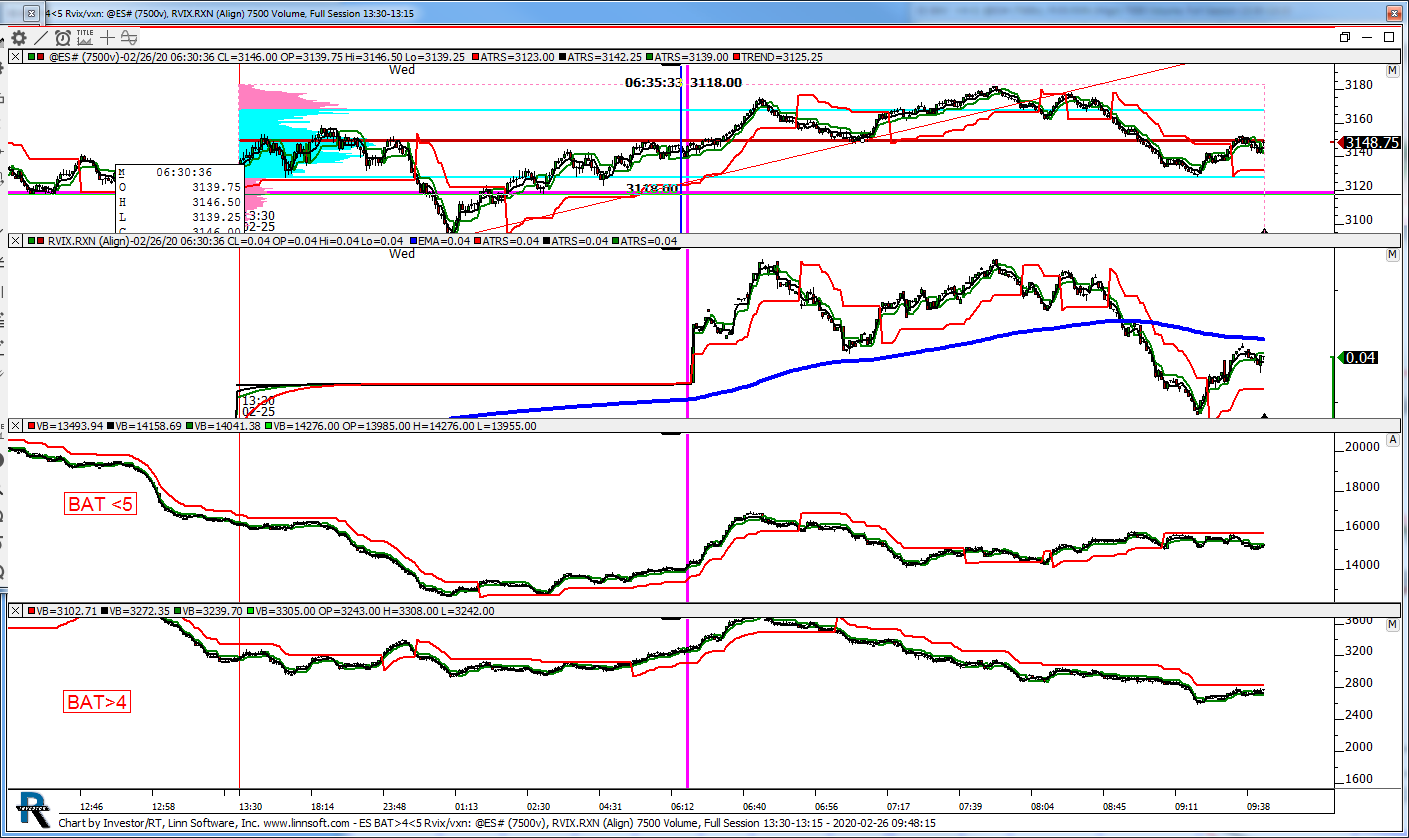 |
ES BAT45 Rvix vxn (@ES#) kencassorla [totalcount]
5 years 9 months ago
tl. This chart was uploaded by Investor/RT 13.6.3 showing symbol: @ES#. |
View |
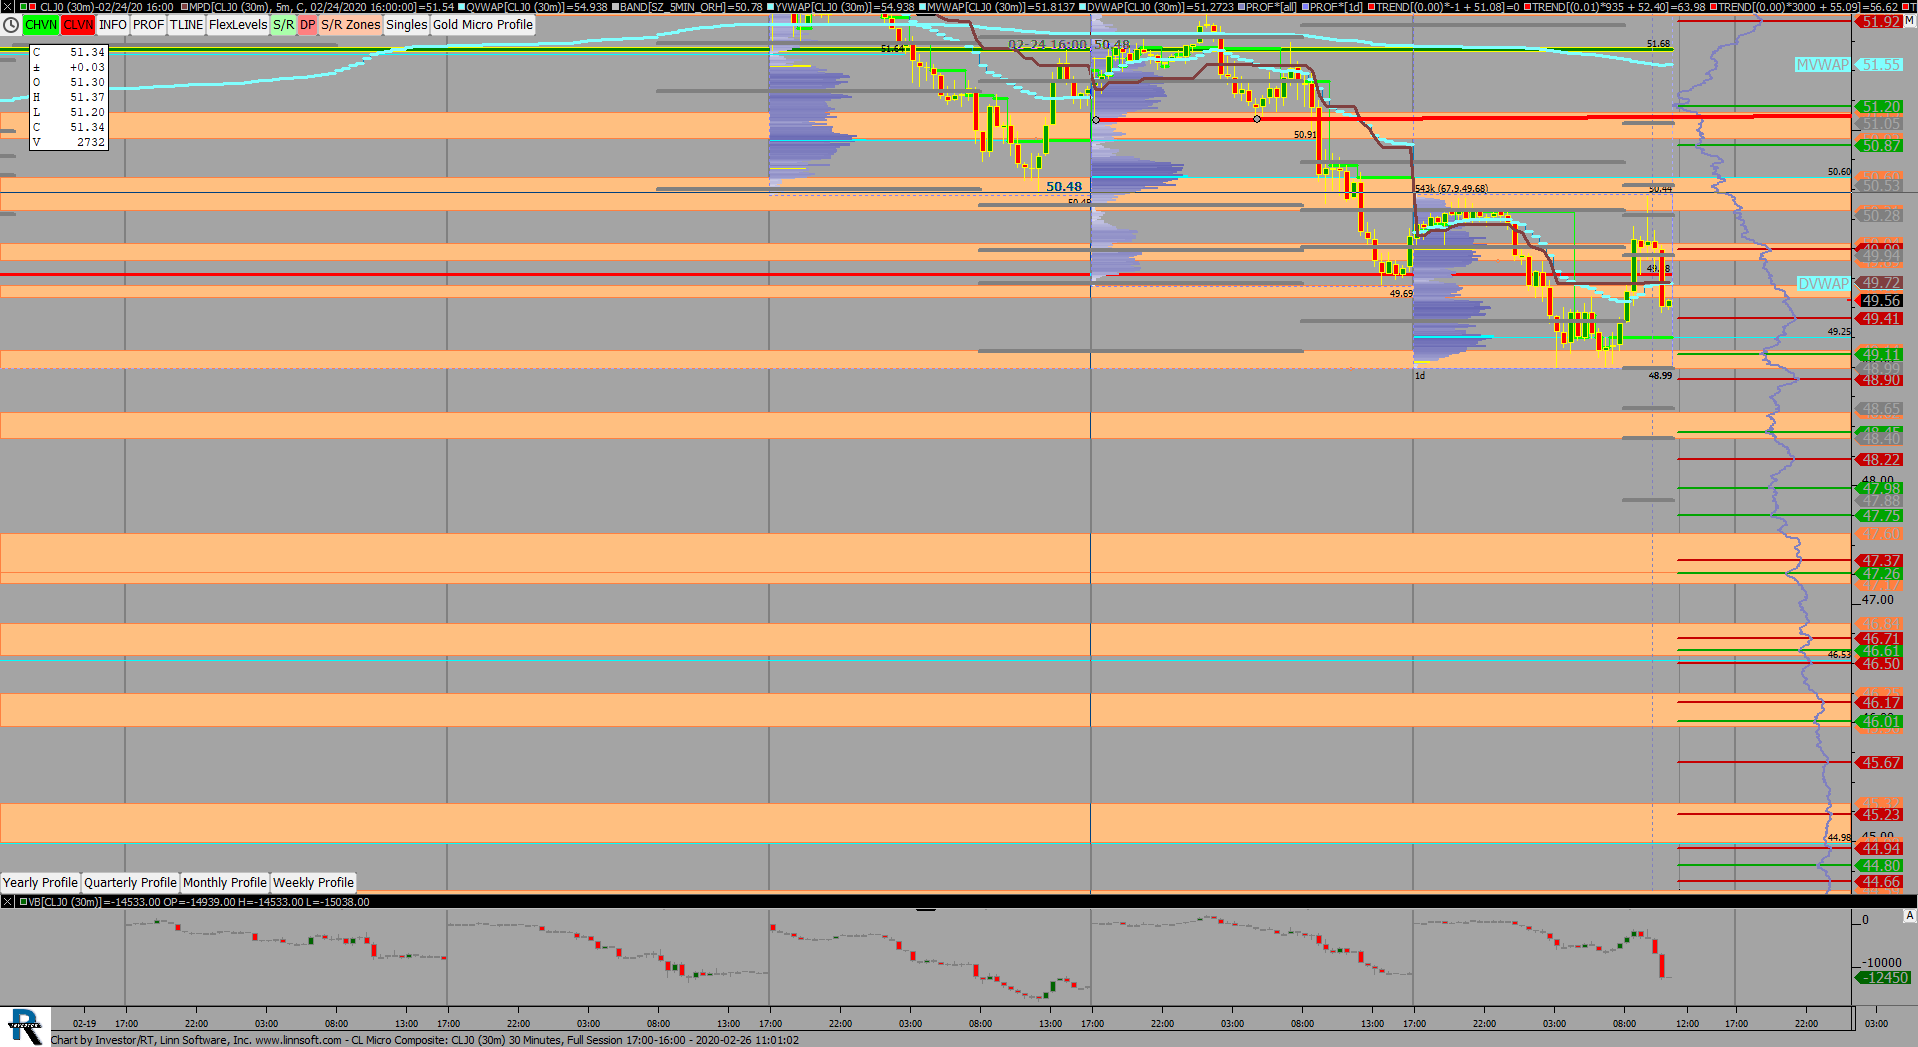 |
CL Micro Composite (CLJ0) scottz46 [totalcount]
5 years 9 months ago
This chart was uploaded by Investor/RT 13.6.3 showing symbol: CLJ0. |
View |
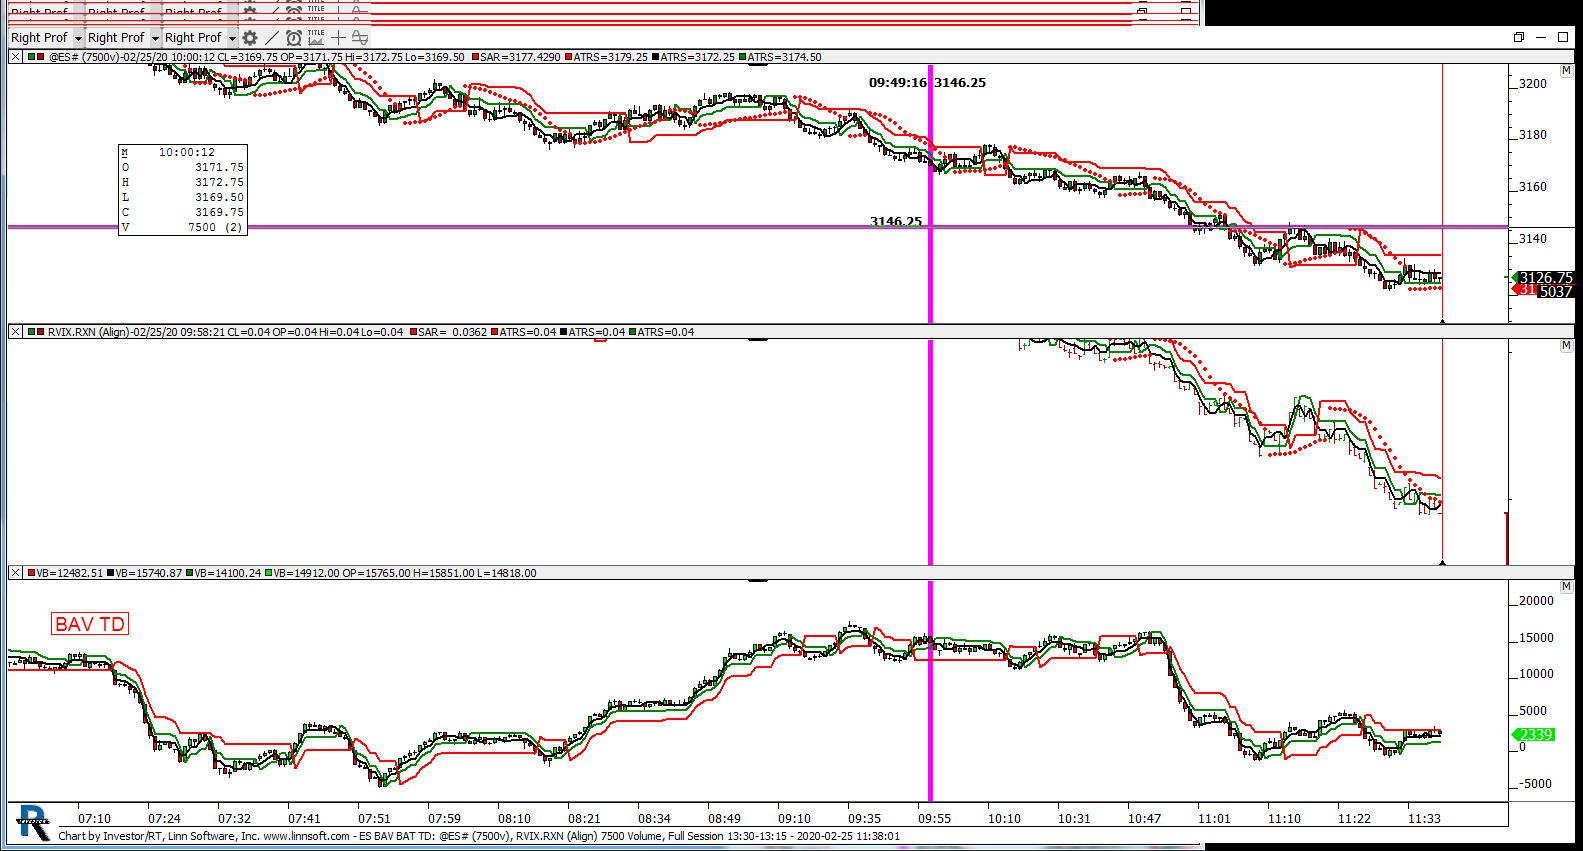 |
ES BAV BAT TD (@ES#) kencassorla [totalcount]
5 years 9 months ago
r vix. This chart was uploaded by Investor/RT 13.6.3 showing symbol: @ES#. |
View |
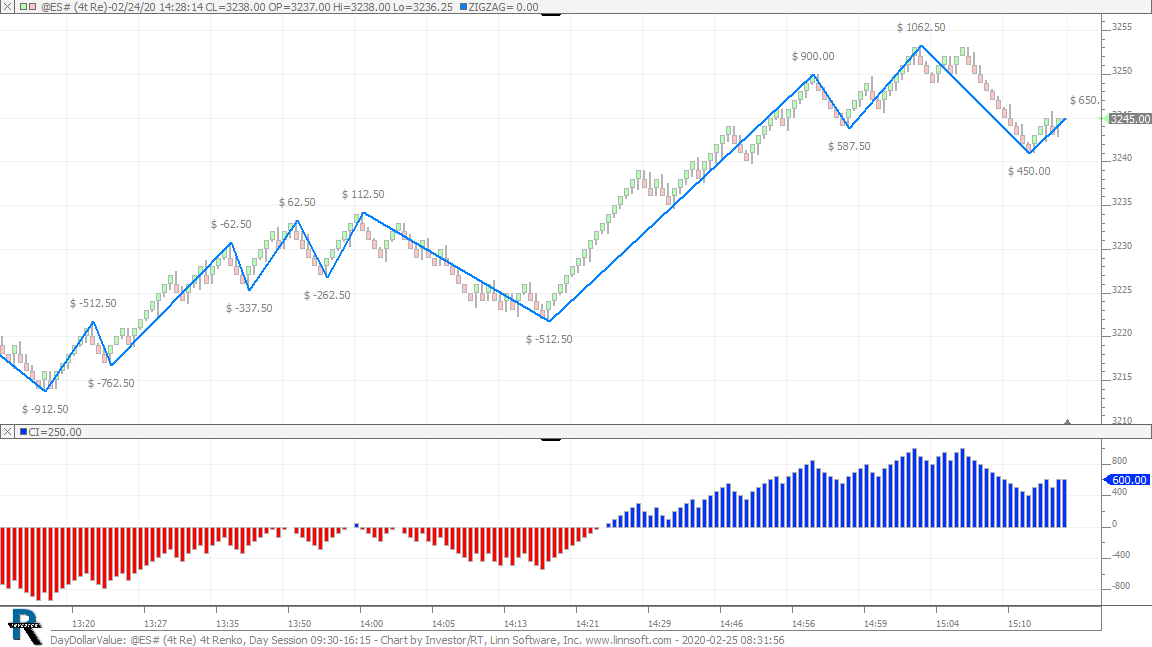 |
DayDollarValue (@ES#) cpayne [totalcount]
5 years 9 months ago
Day Dollar Value. This chart was uploaded by Investor/RT 14.1.12 showing symbol: @ES#. |
View |
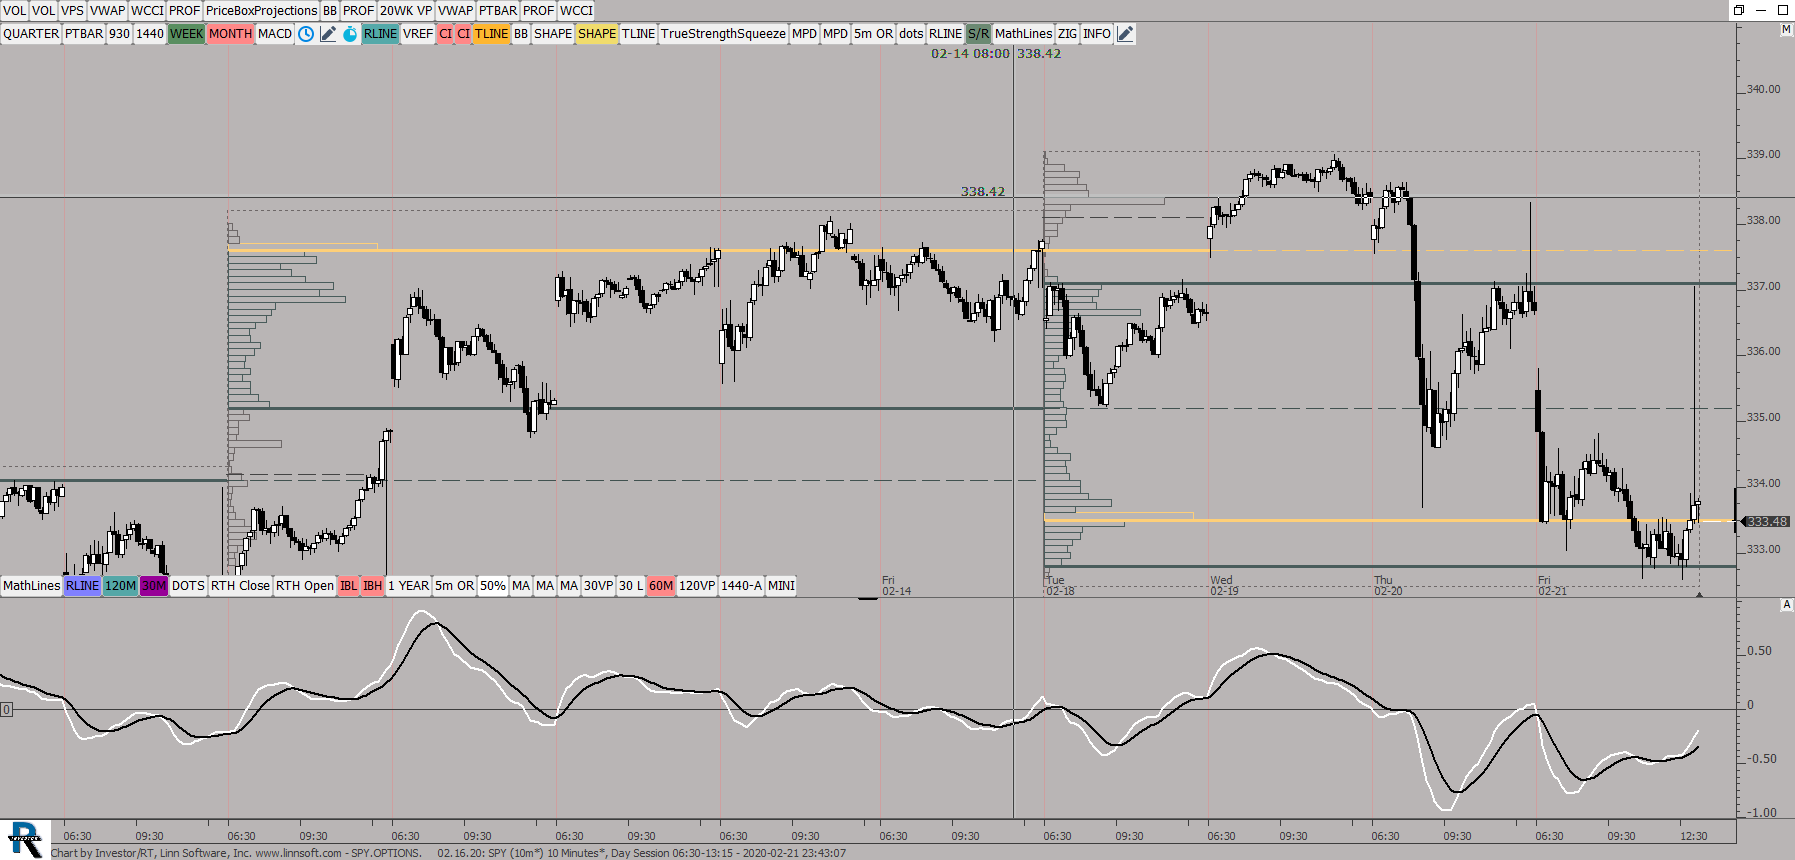 |
SPYOPTIONS (SPY) ES42 [totalcount]
5 years 10 months ago
This chart was uploaded by Investor/RT 13.6.3 showing symbol: SPY. |
View |
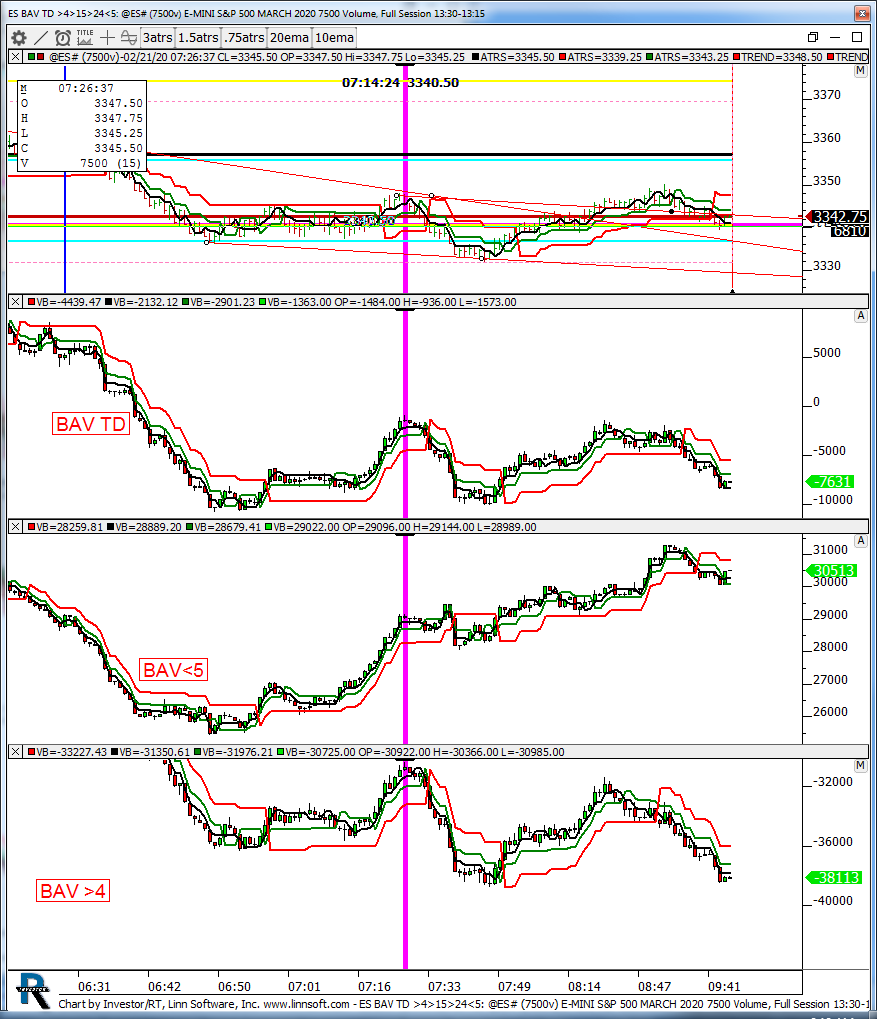 |
ES BAV TD 415245 (@ES#) kencassorla [totalcount]
5 years 10 months ago
subs. This chart was uploaded by Investor/RT 13.6.3 showing symbol: @ES#. |
View |
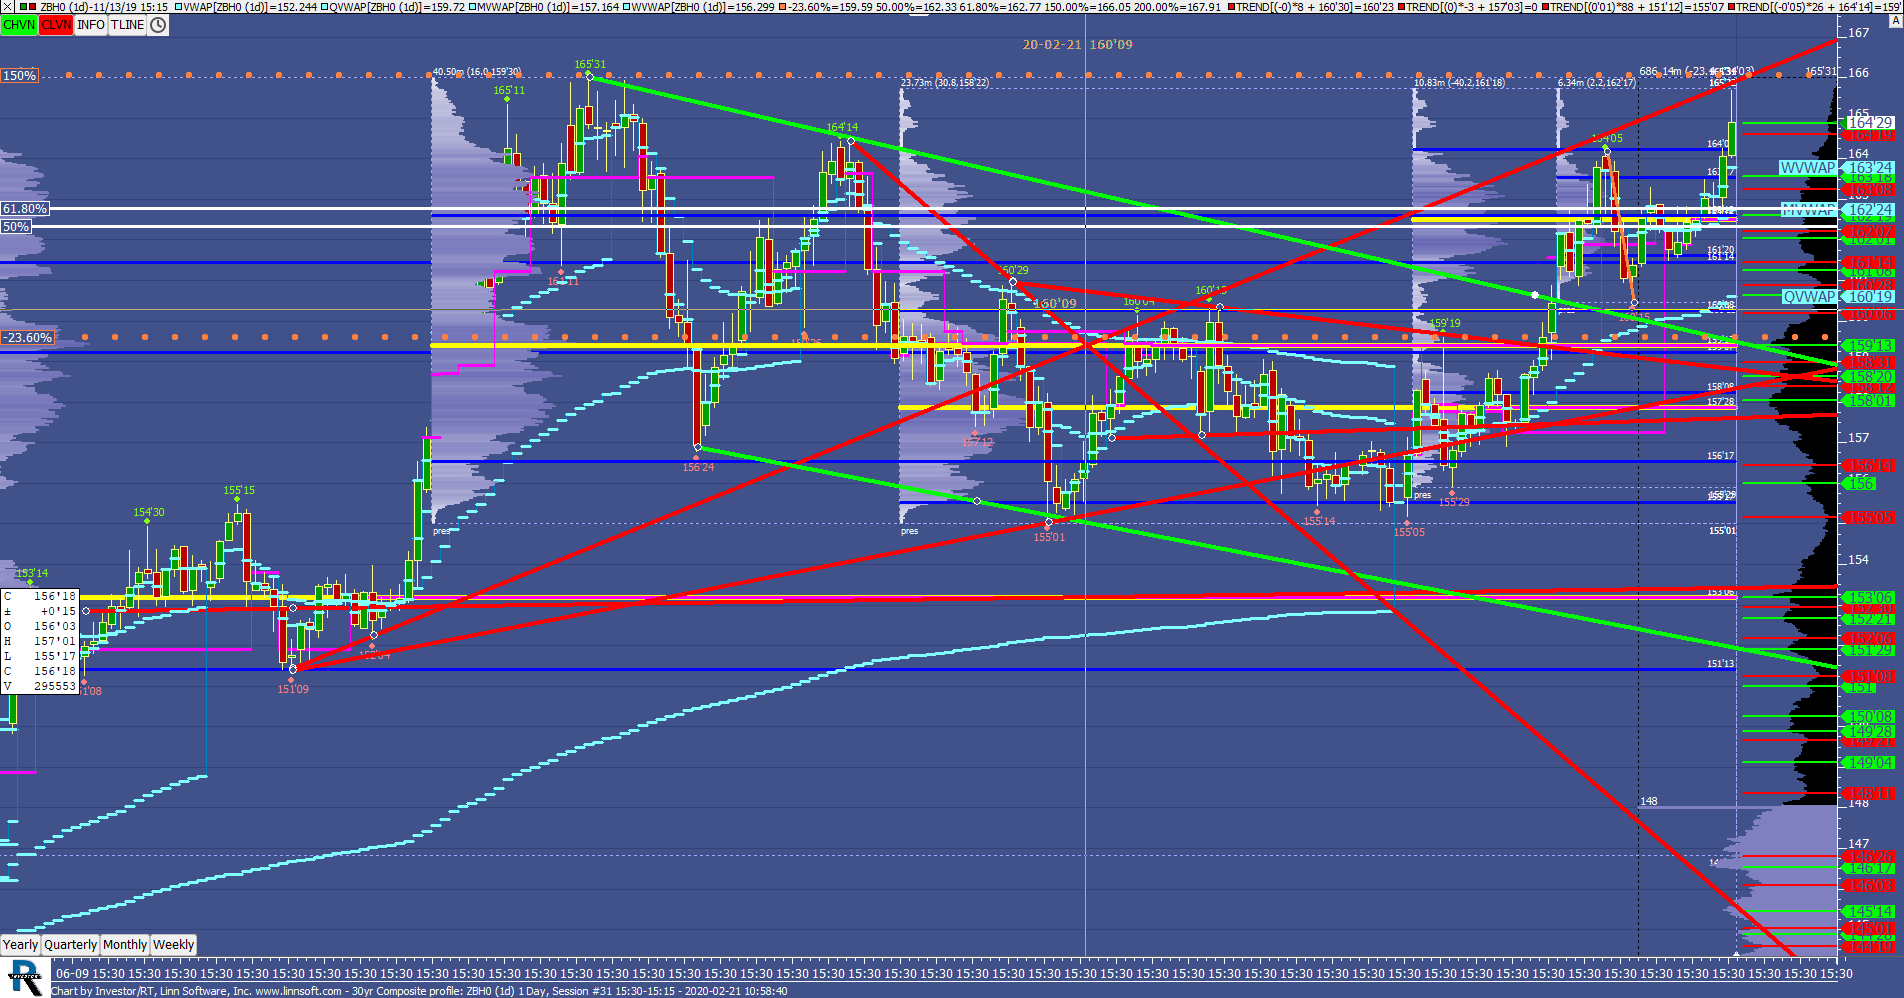 |
30yr Composite profile (ZBH0) scottz46 [totalcount]
5 years 10 months ago
This chart was uploaded by Investor/RT 13.6.3 showing symbol: ZBH0. |
View |
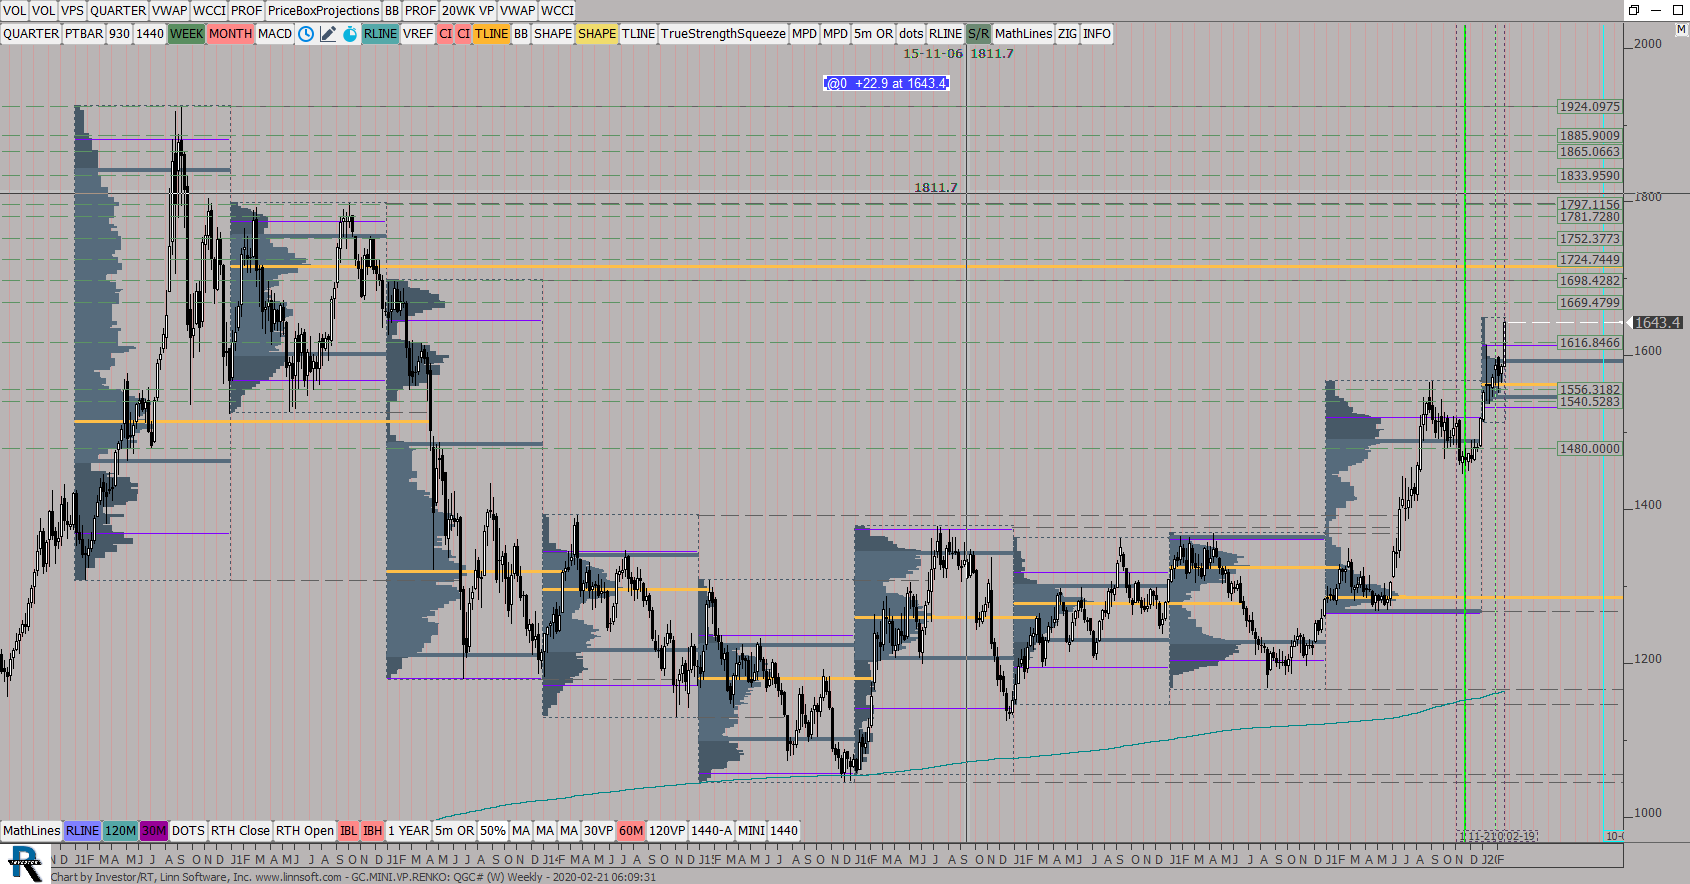 |
GCMINIVPRENKO (QGC#) ES42 [totalcount]
5 years 10 months ago
Yeaqrly Profiles and Weekly Candles. This chart was uploaded by Investor/RT 13.6.3 showing symbol: QGC#. |
View |
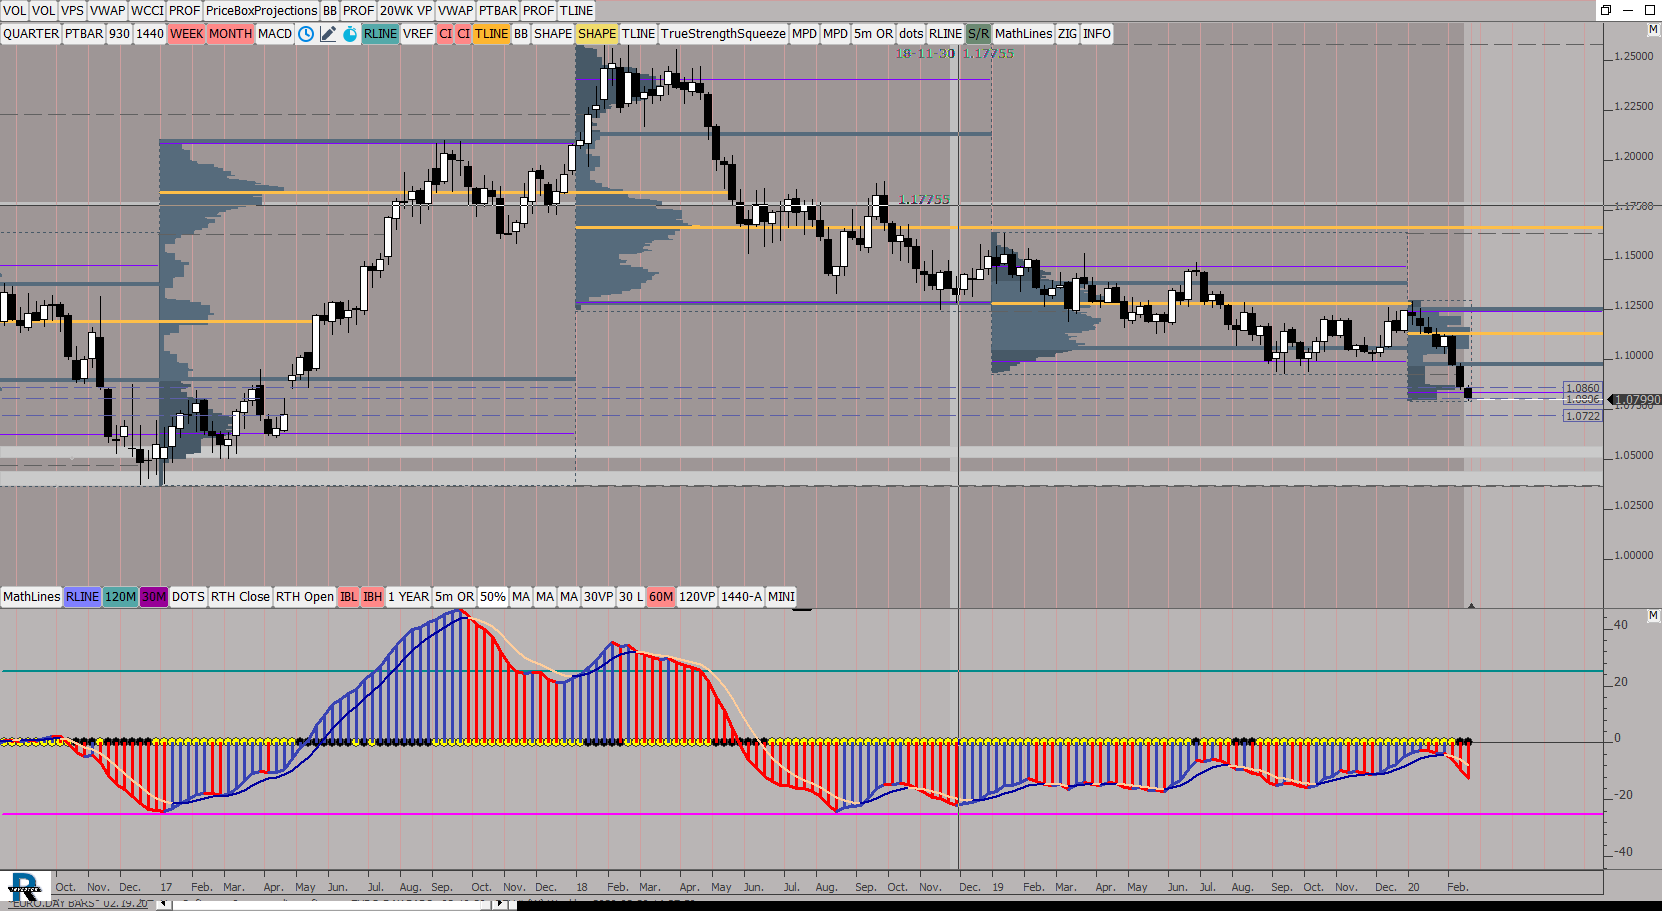 |
EURODAY BARS (@EU#) ES42 [totalcount]
5 years 10 months ago
Yeaqrly Profiles and Weekly Candles. This chart was uploaded by Investor/RT 13.6.3 showing symbol: @EU#. |
View |
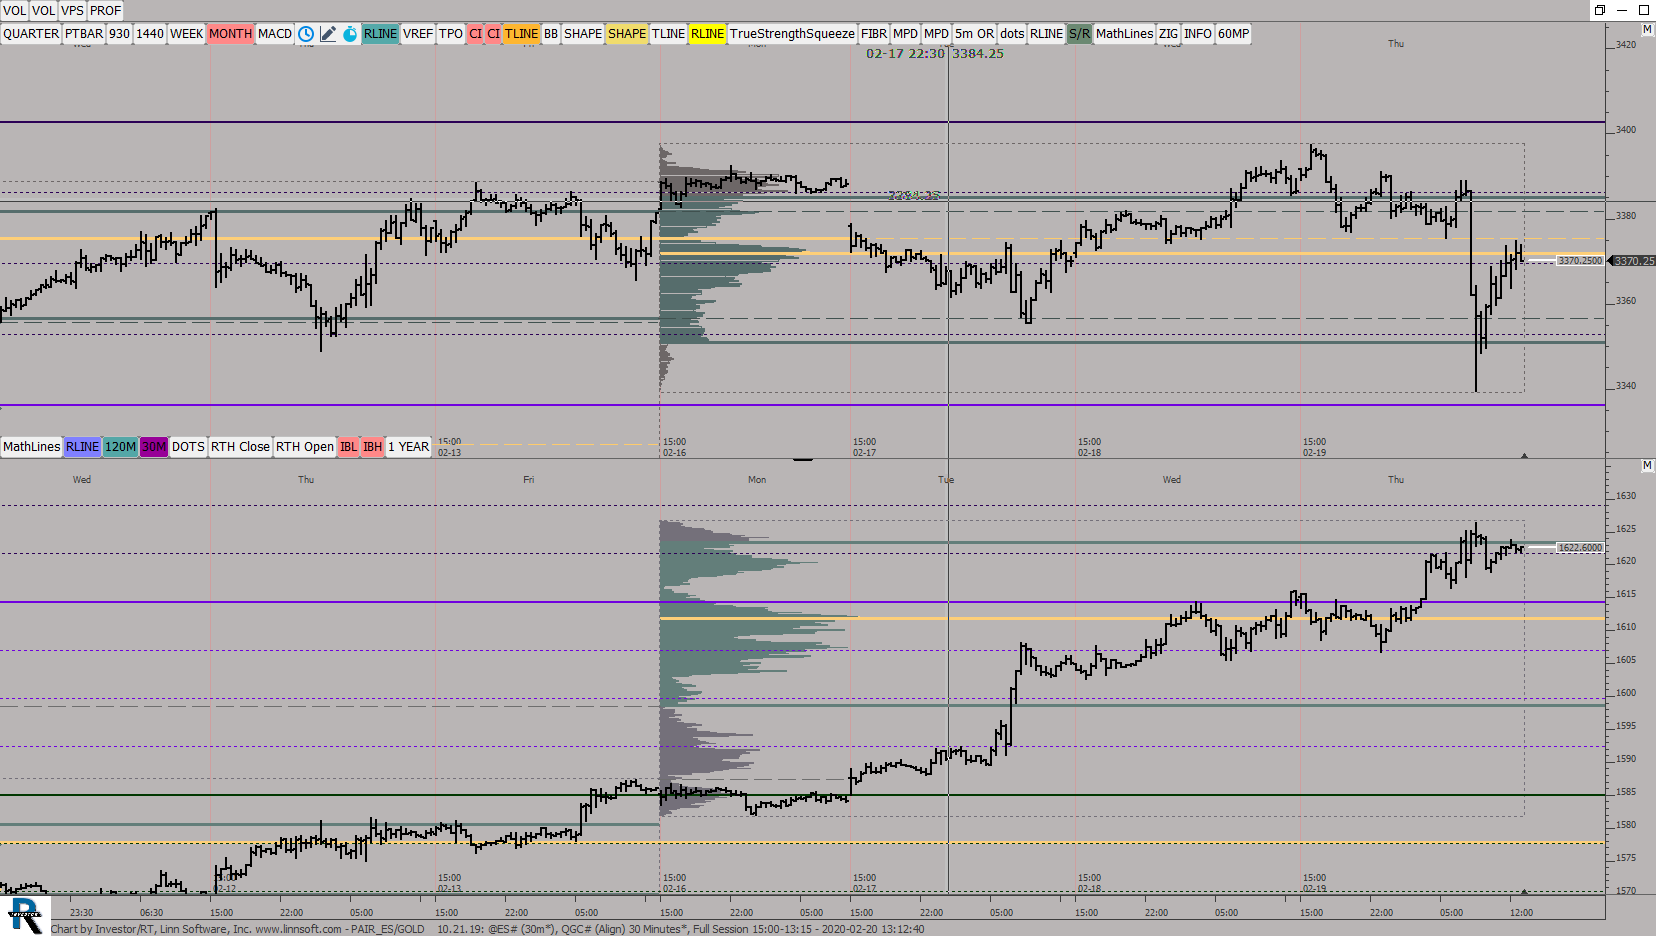 |
PAIR ES GOLD (@ES#) ES42 [totalcount]
5 years 10 months ago
This chart was uploaded by Investor/RT 13.6.3 showing symbol: @ES#. |
View |
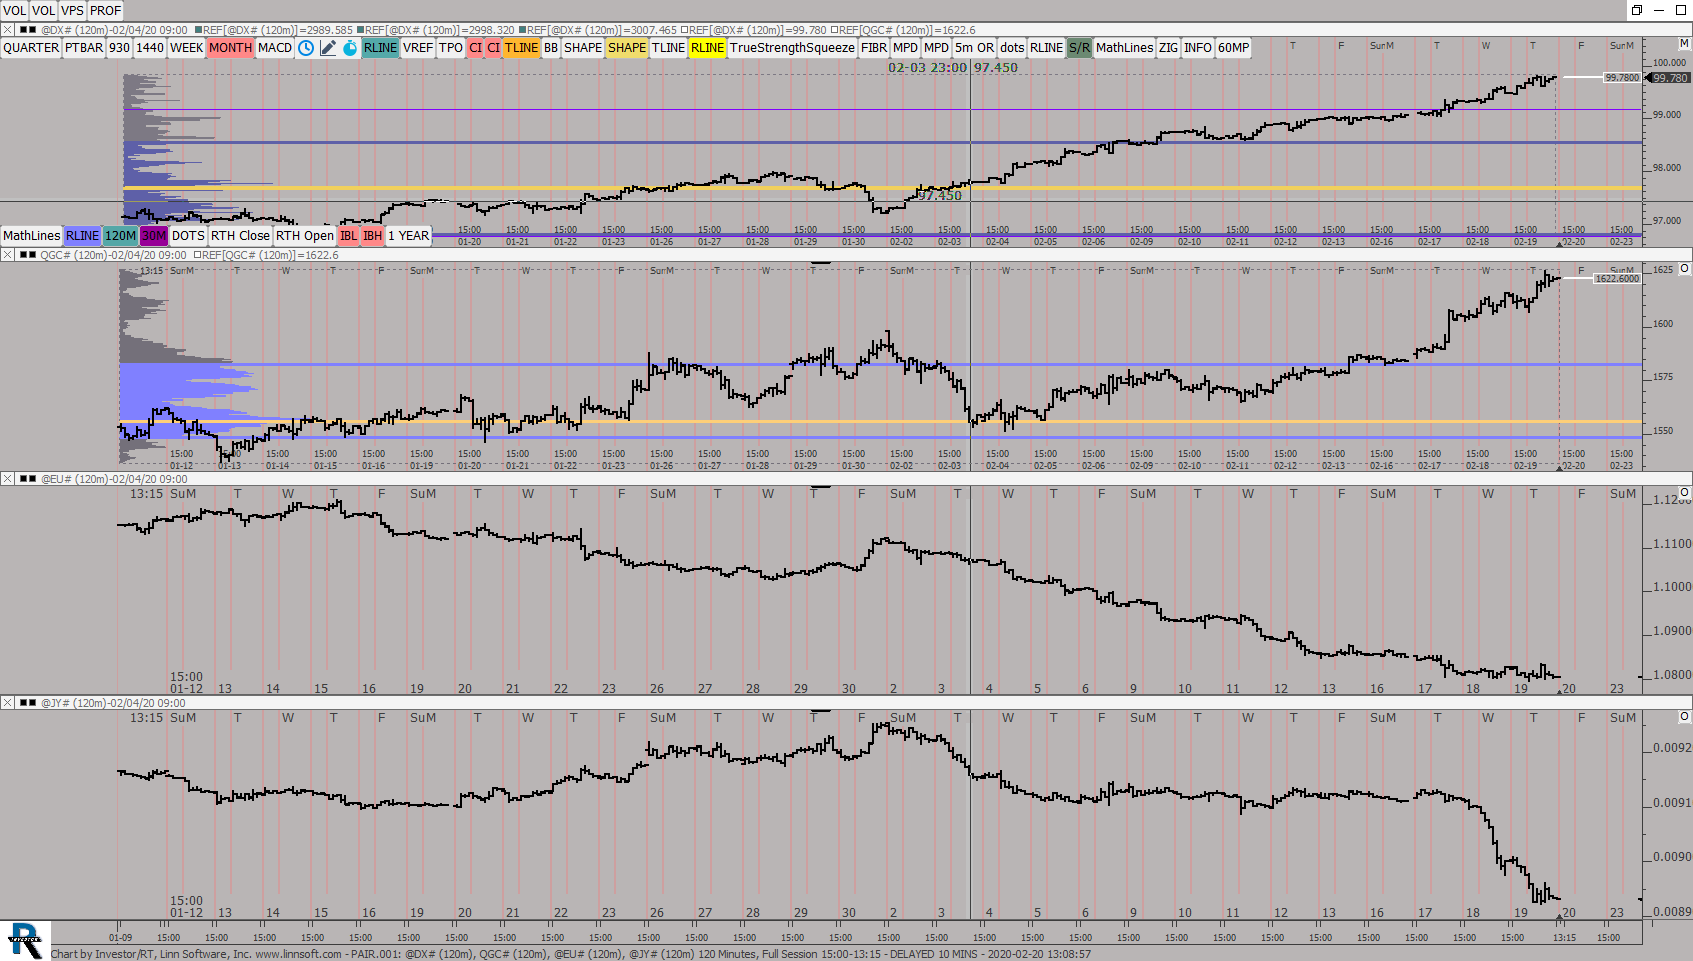 |
PAIR (@DX#) ES42 [totalcount]
5 years 10 months ago
This chart was uploaded by Investor/RT 13.6.3 showing symbol: @DX#. |
View |
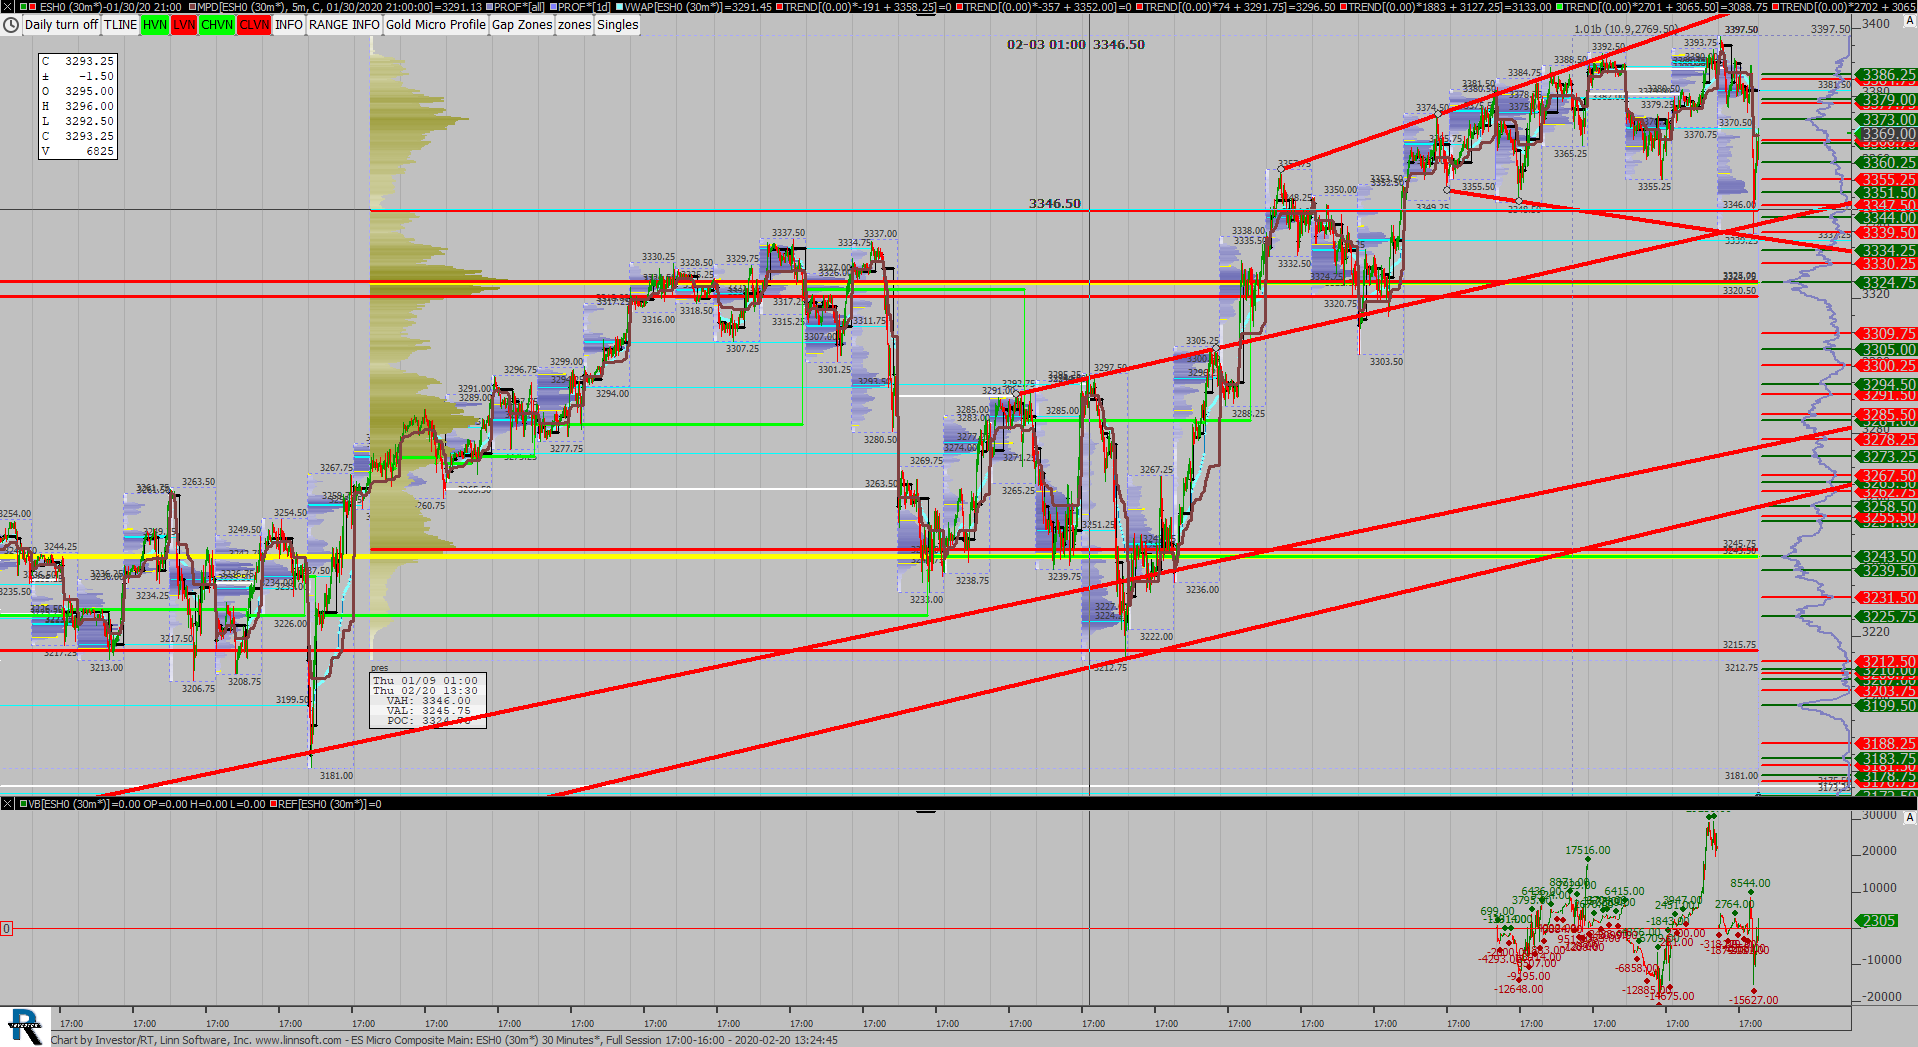 |
ES Micro Composite Main (ESH0) scottz46 [totalcount]
5 years 10 months ago
This chart was uploaded by Investor/RT 13.6.3 showing symbol: ESH0. |
View |
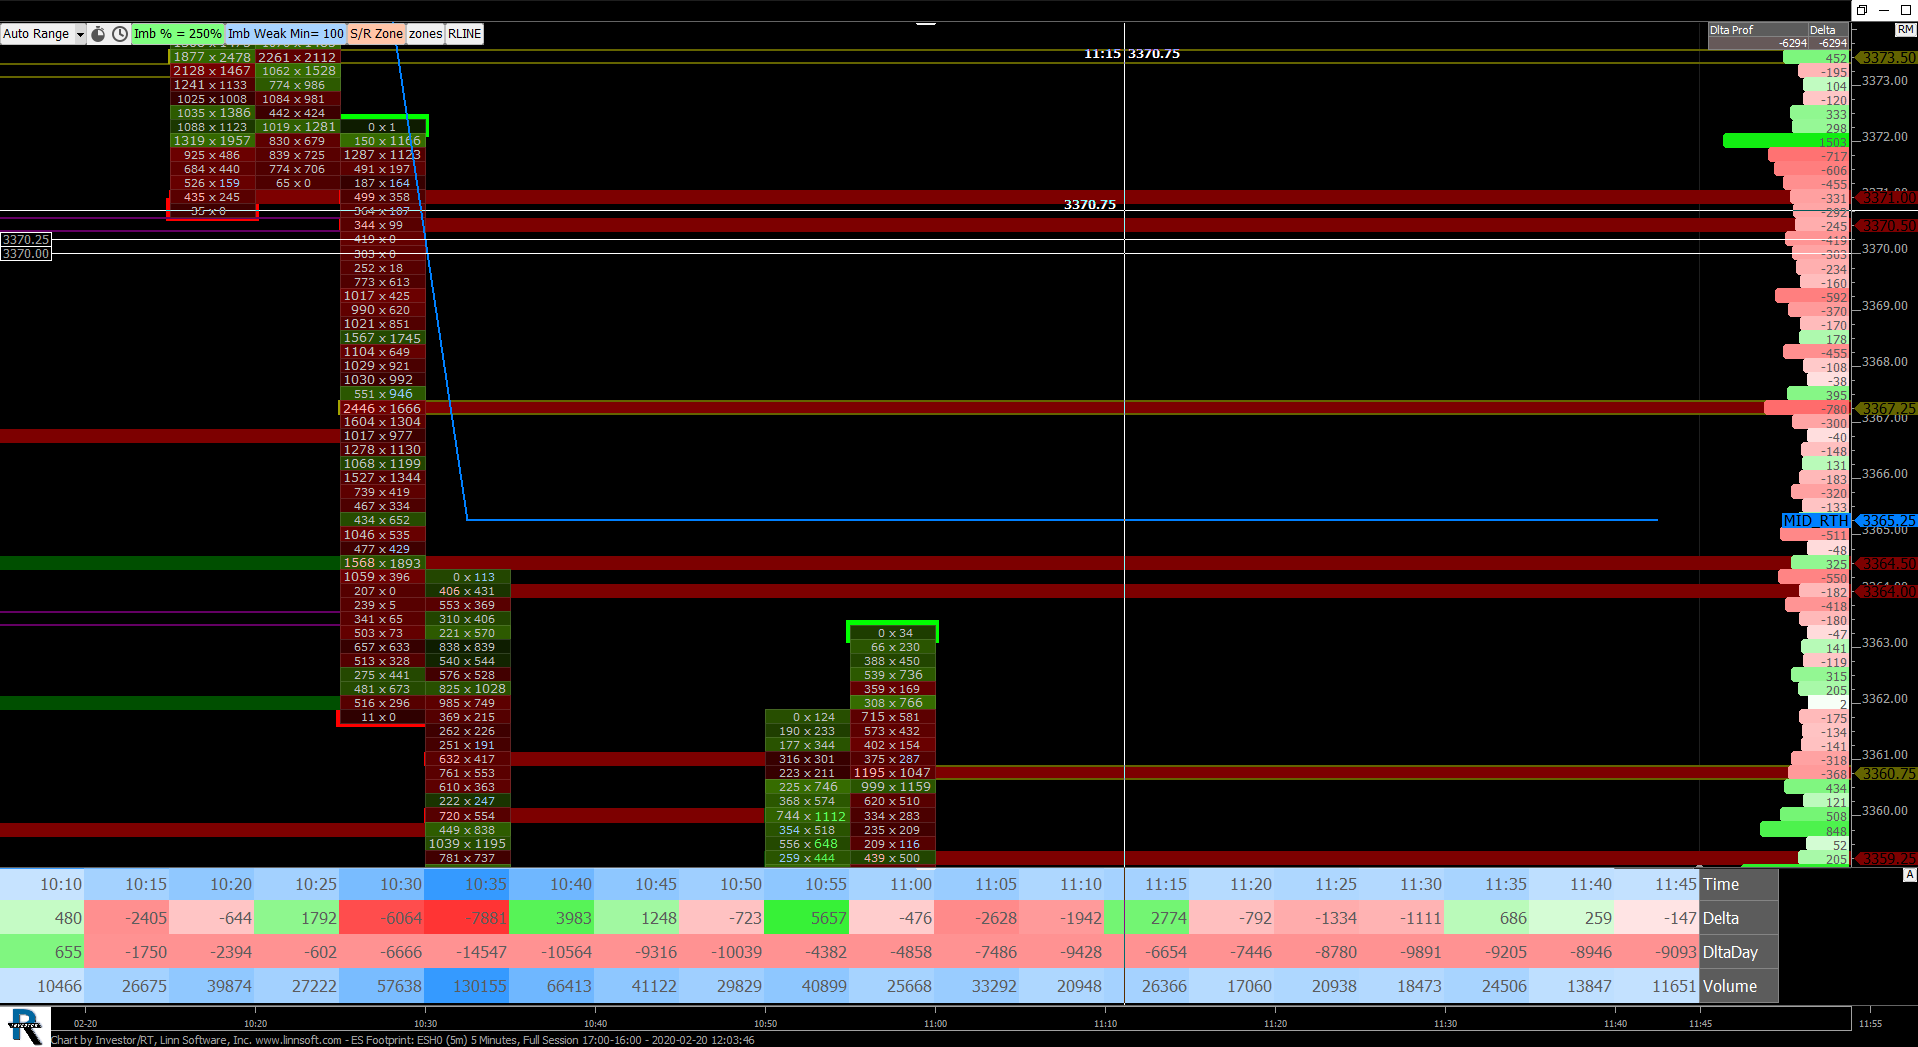 |
ES Footprint (ESH0) scottz46 [totalcount]
5 years 10 months ago
This chart was uploaded by Investor/RT 13.6.3 showing symbol: ESH0. |
View |
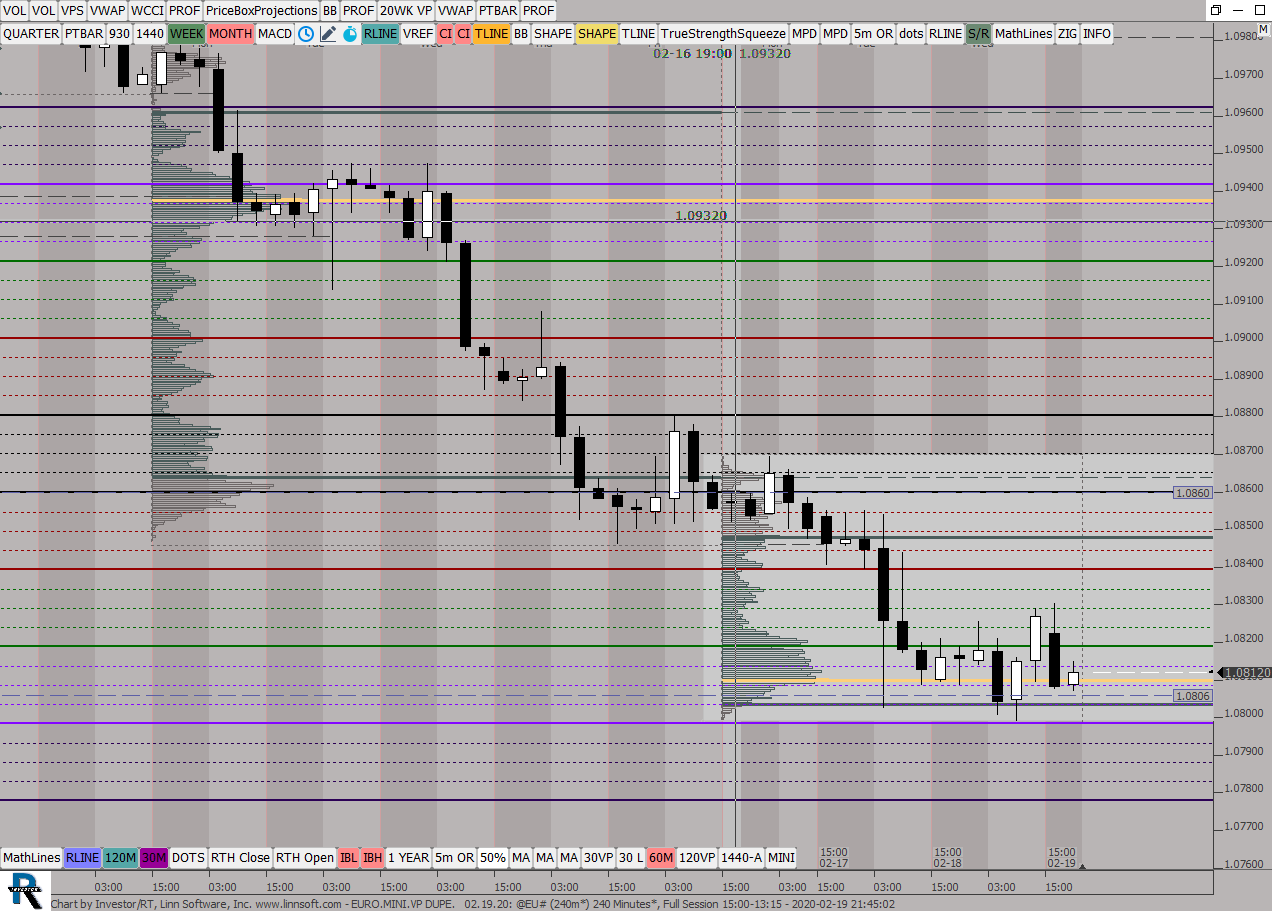 |
EUROMINIVP DUPE (@EU#) ES42 [totalcount]
5 years 10 months ago
Weekly Profile_ 4 hour Internal candles. This chart was uploaded by Investor/RT 13.6.3 showing symbol: @EU#. |
View |
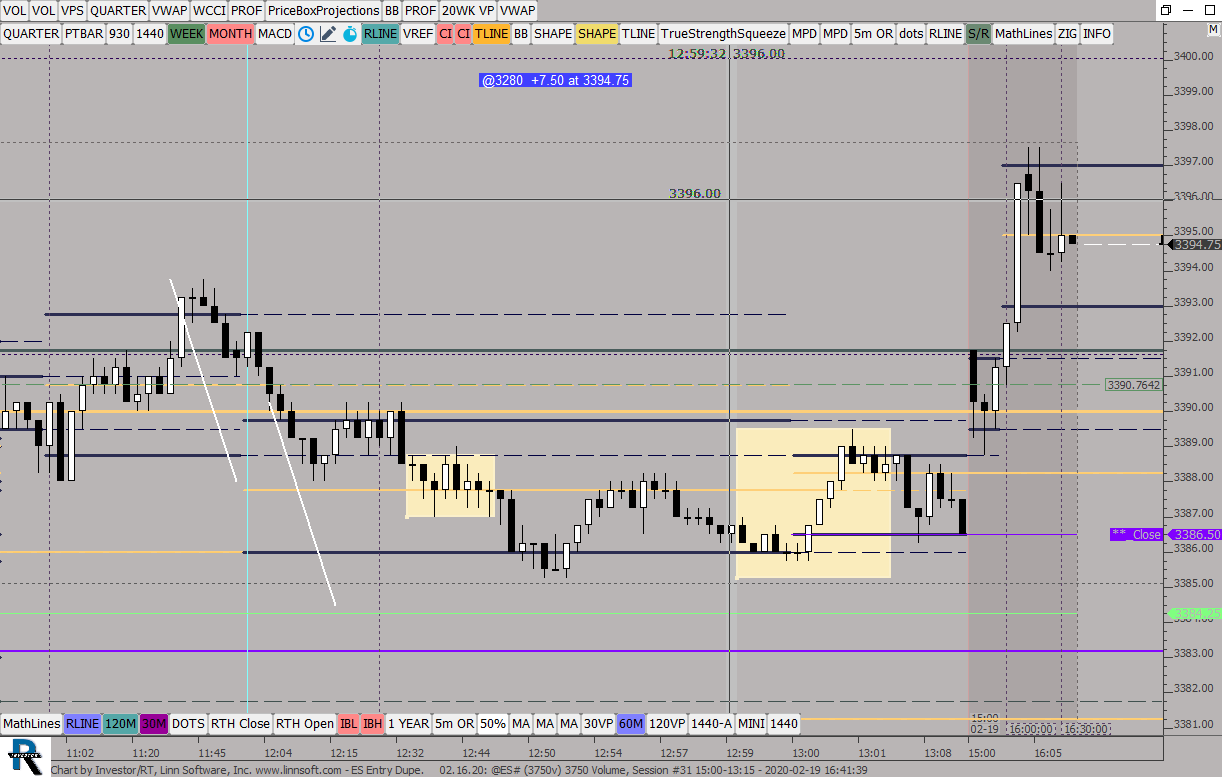 |
ES Entry Dupe (@ES#) ES42 [totalcount]
5 years 10 months ago
This chart was uploaded by Investor/RT 13.6.3 showing symbol: @ES#. |
View |