 |
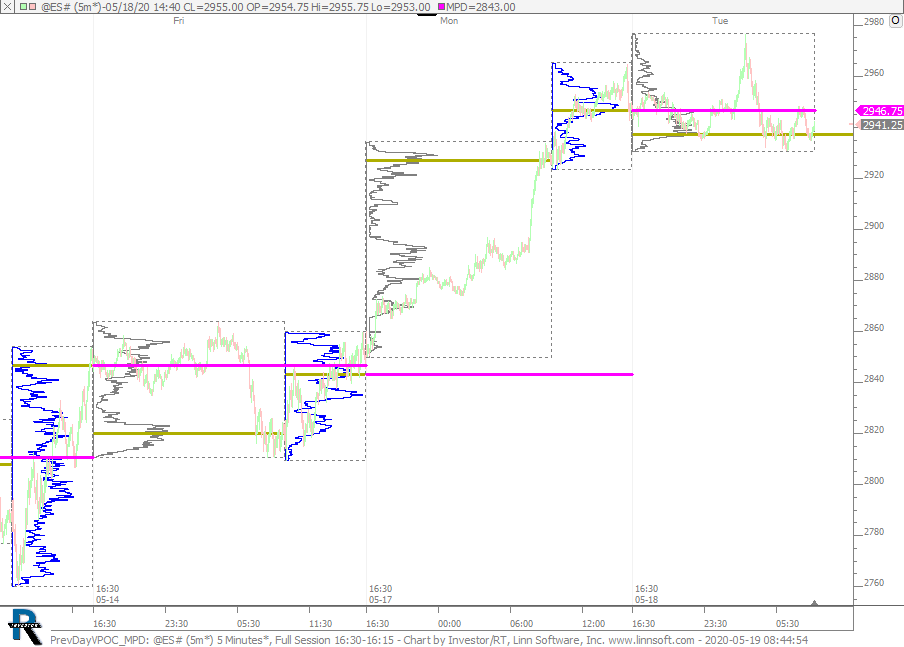
PrevDayVPOC MPD (@ES#) cpayne [totalcount]
6 years 2 months ago
Previous Day VPOC via MPD, PROF, and SESST. This chart was uploaded by Investor/RT 14.1.9 showing symbol: @ES#. |
View |
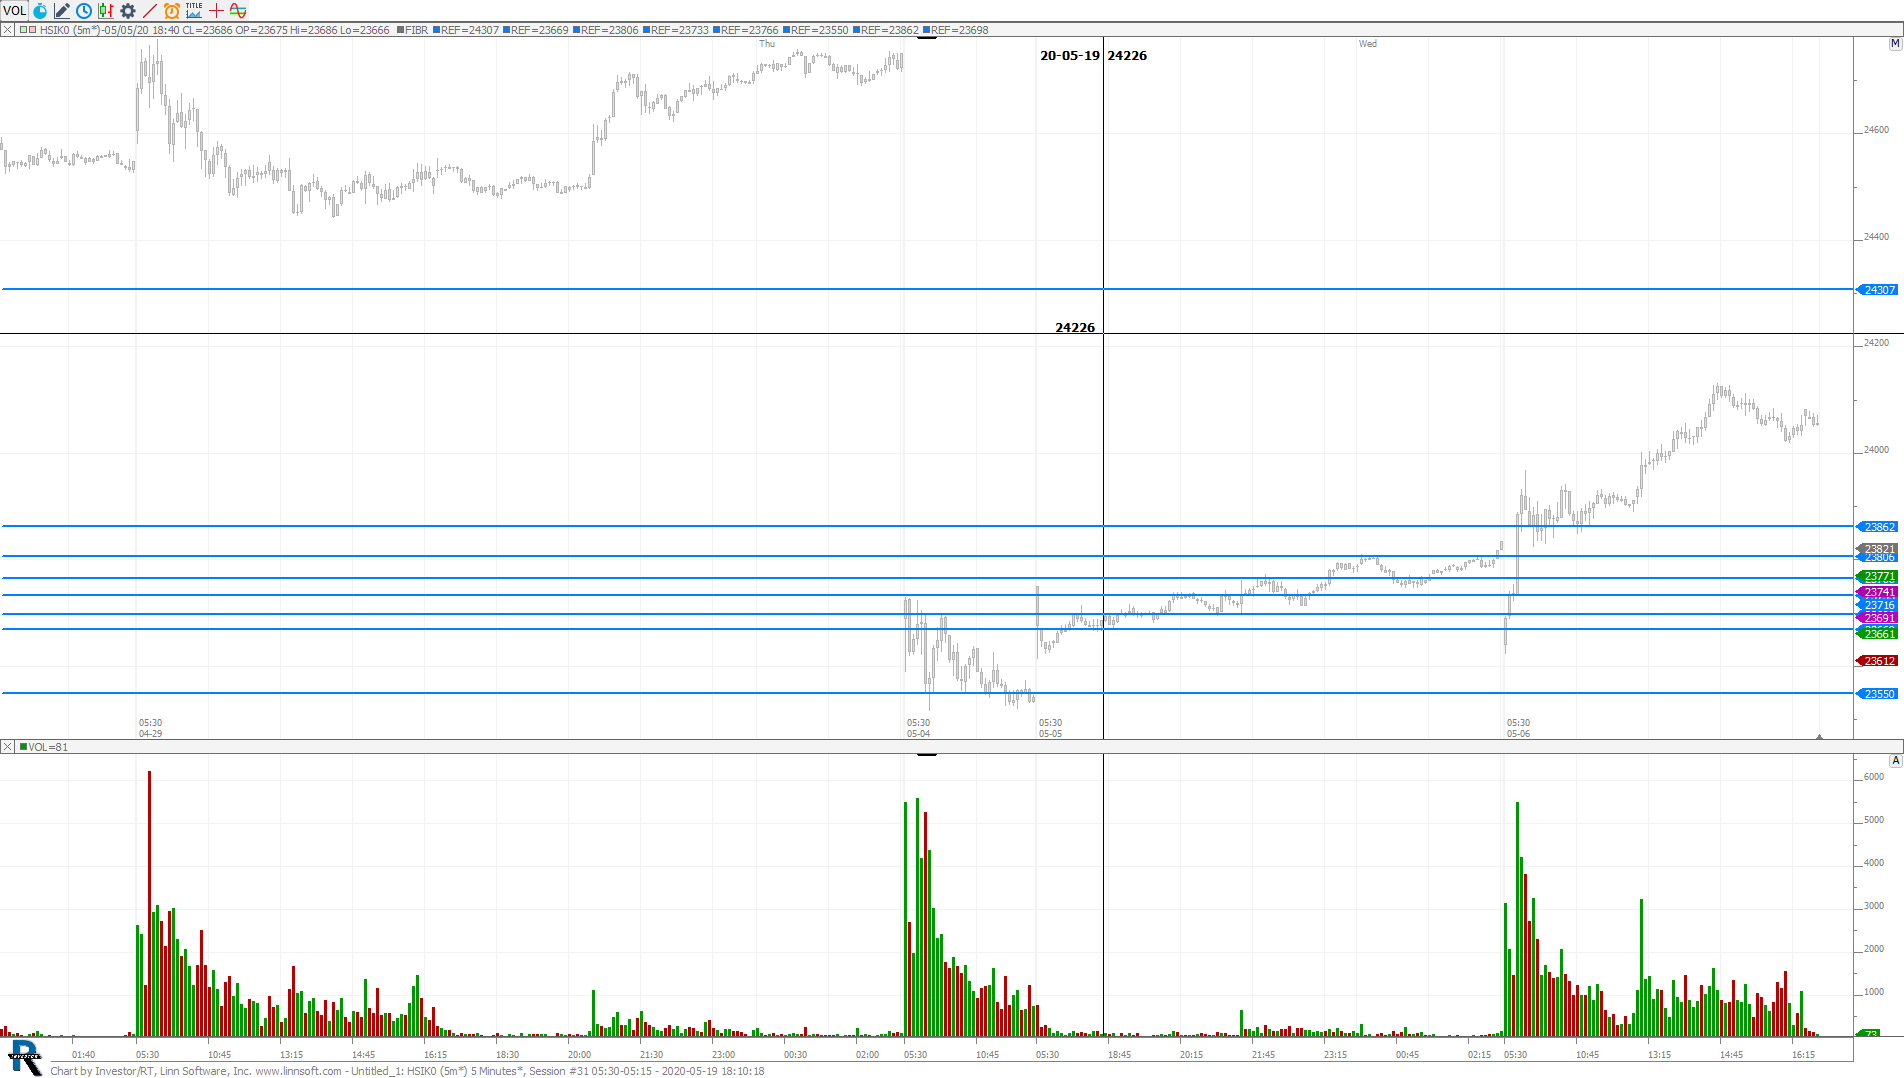 |
Untitled 1 (HSIK0) botelho [totalcount]
6 years 2 months ago
missing data for monday session. This chart was uploaded by Investor/RT 13.6.15 showing symbol: HSIK0. |
View |
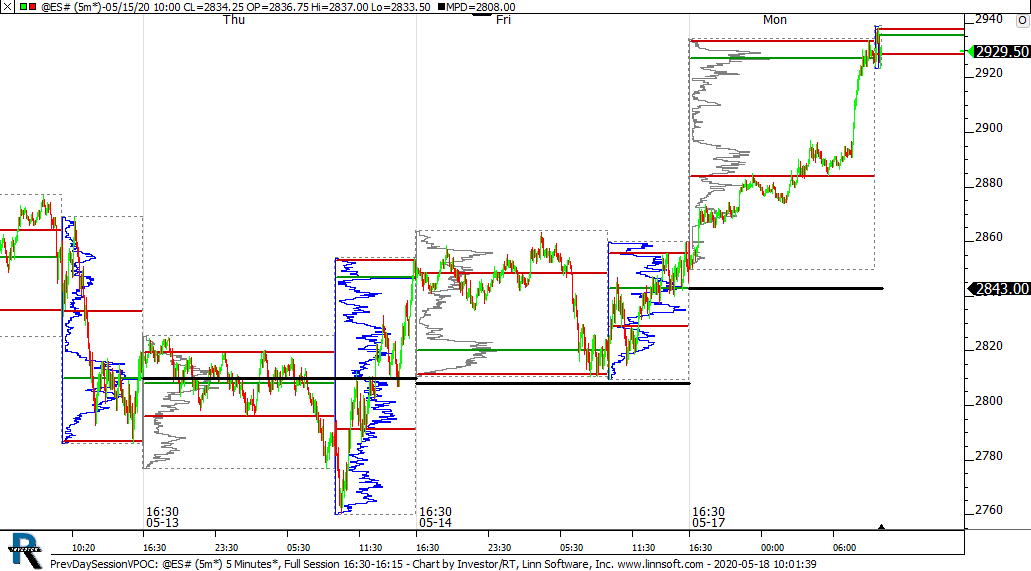 |
PrevDaySessionVPOC (@ES#) cpayne [totalcount]
6 years 2 months ago
Previous Day VPOC. This chart was uploaded by Investor/RT 14.1.9 showing symbol: @ES#. |
View |
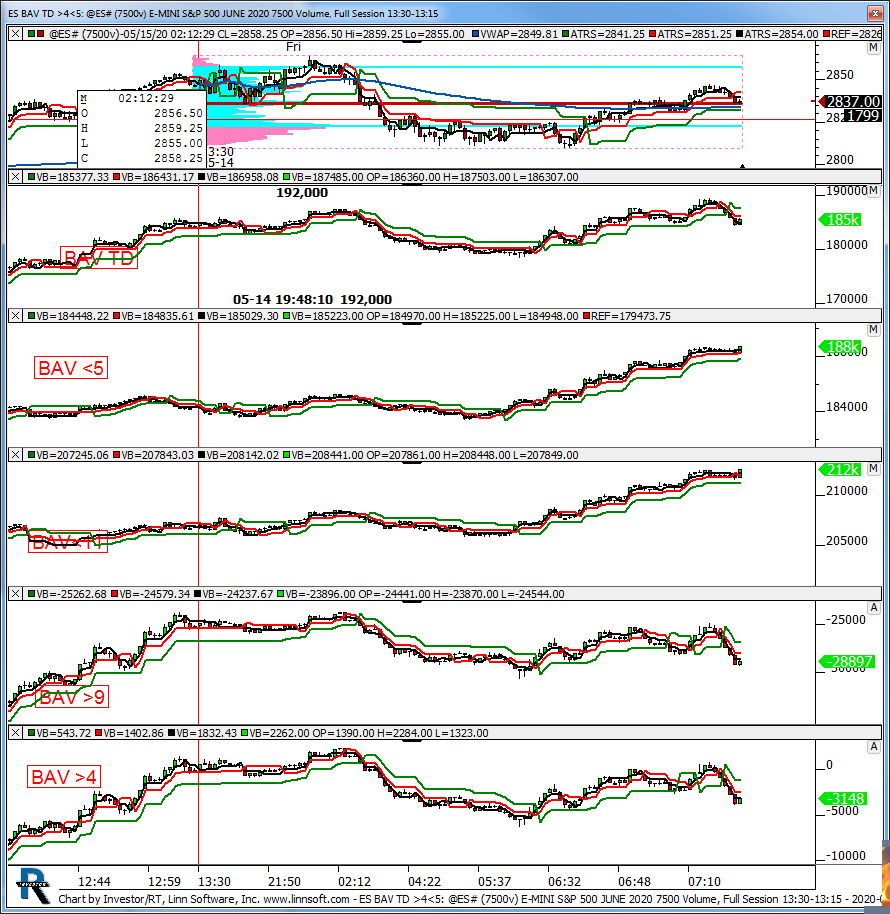 |
ES BAV TD 45 (@ES#) kencassorla [totalcount]
6 years 2 months ago
bav subs. This chart was uploaded by Investor/RT 13.6.3 showing symbol: @ES#. |
View |
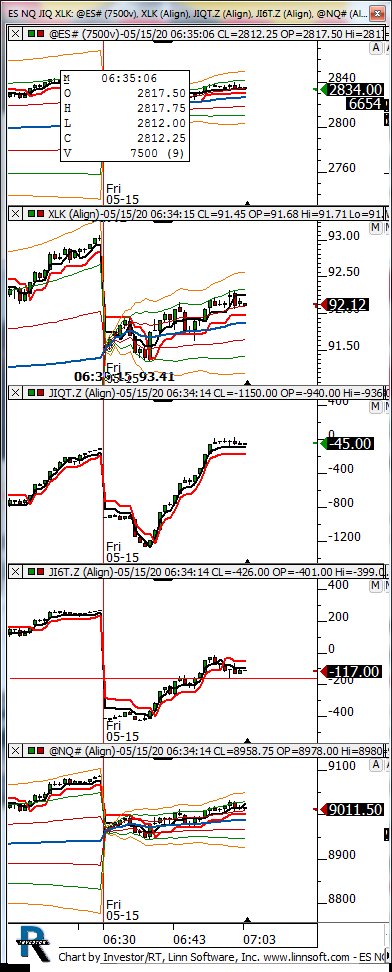 |
ES NQ JIQ XLK (@ES#) kencassorla [totalcount]
6 years 2 months ago
JIQ XLK. This chart was uploaded by Investor/RT 13.6.15 showing symbol: @ES#. |
View |
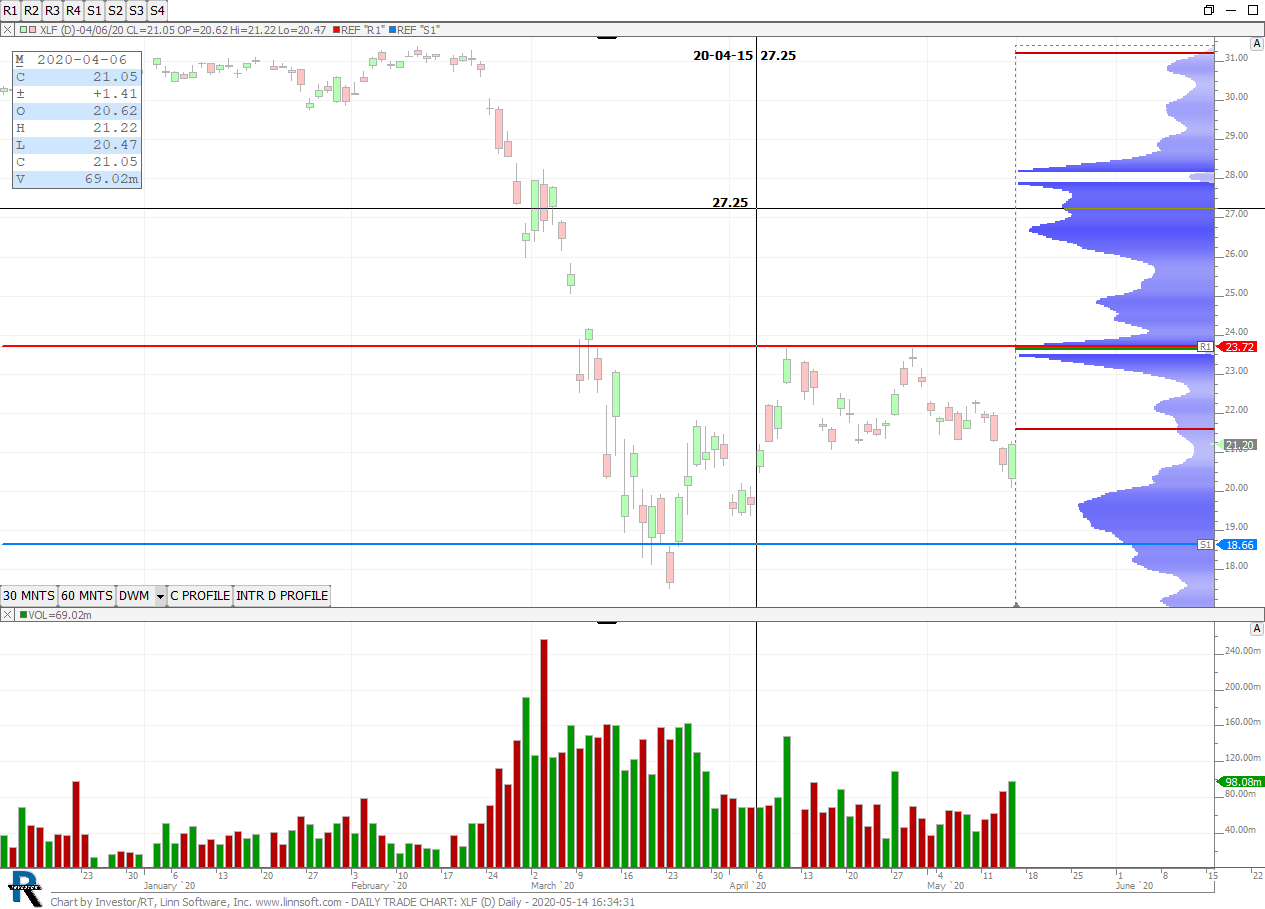 |
DAILY TRADE CHART (XLF) sss390 [totalcount]
6 years 2 months ago
DAILY TRADE MAY 14TH 2020. This chart was uploaded by Investor/RT 13.6.15 showing symbol: XLF. |
View |
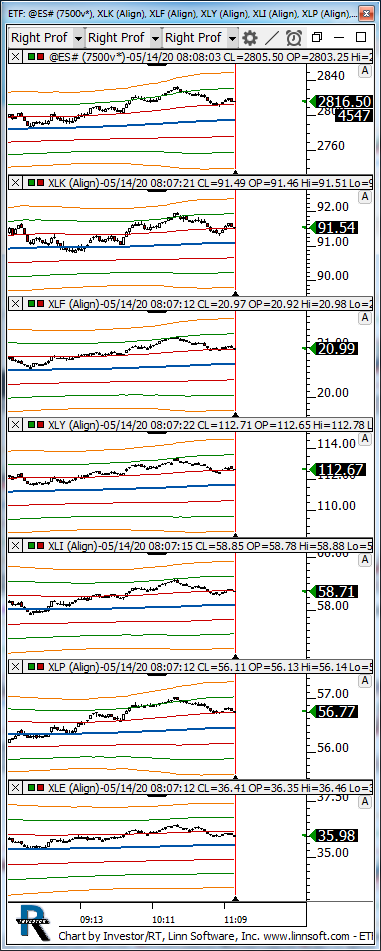 |
ETF (@ES#) kencassorla [totalcount]
6 years 2 months ago
etf's. This chart was uploaded by Investor/RT 13.5.12 showing symbol: @ES#. |
View |
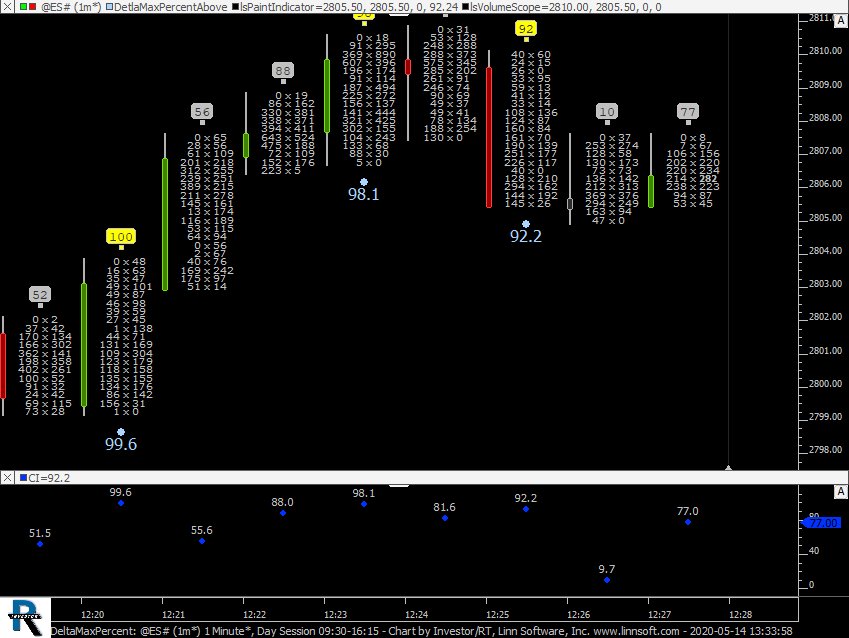 |
DeltaMaxPercent (@ES#) cpayne [totalcount]
6 years 2 months ago
Delta as Percent of Extreme. This chart was uploaded by Investor/RT 14.1.7 showing symbol: @ES#. |
View |
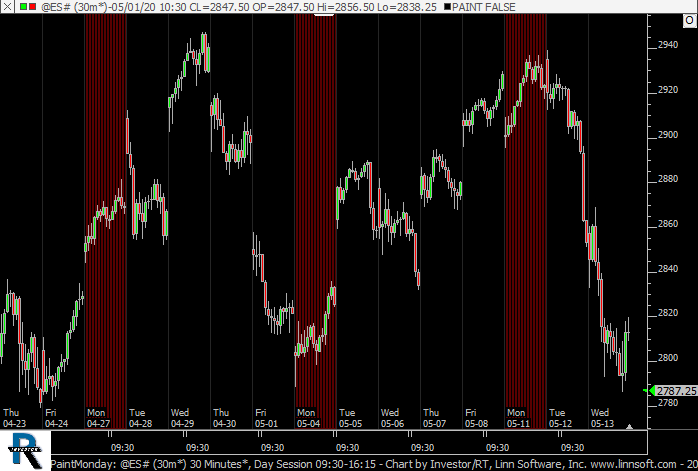 |
PaintMonday (@ES#) cpayne [totalcount]
6 years 2 months ago
Painting Monday. This chart was uploaded by Investor/RT 14.1.7 showing symbol: @ES#. |
View |
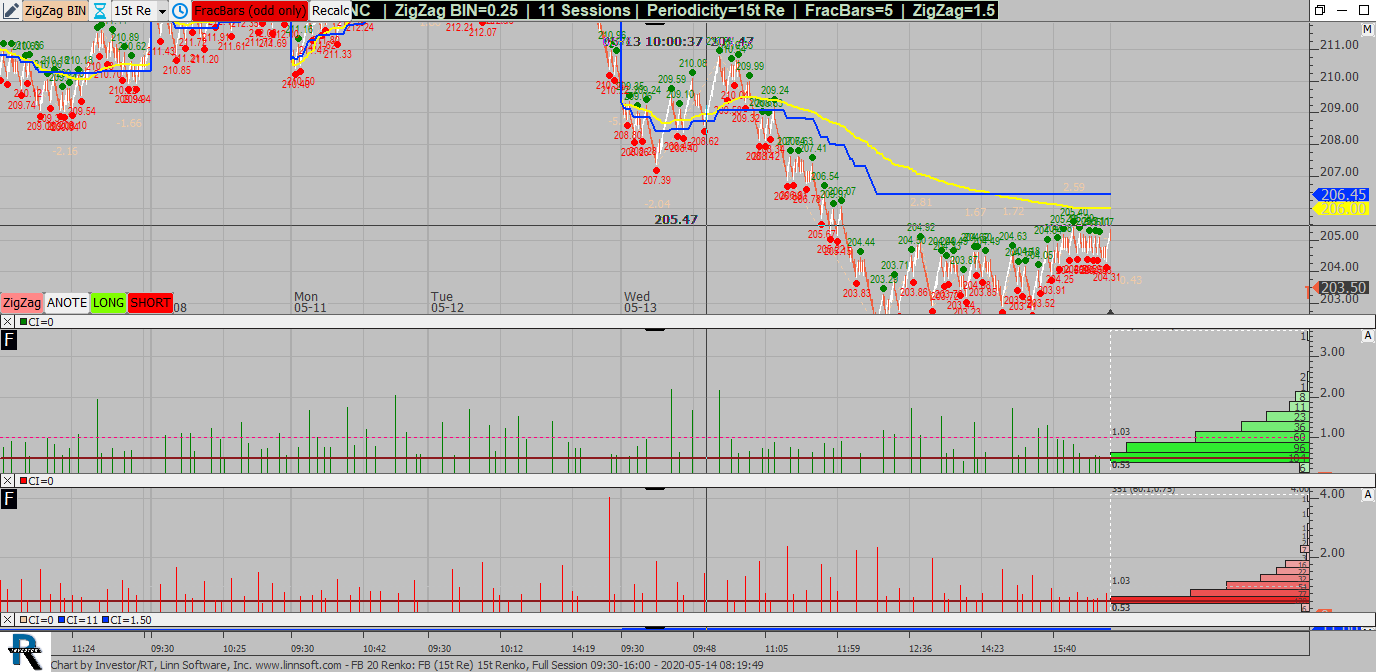 |
FB 20 Renko (FB) leveragefx [totalcount]
6 years 2 months ago
This chart was uploaded by Investor/RT 13.6.15 showing symbol: FB. |
View |
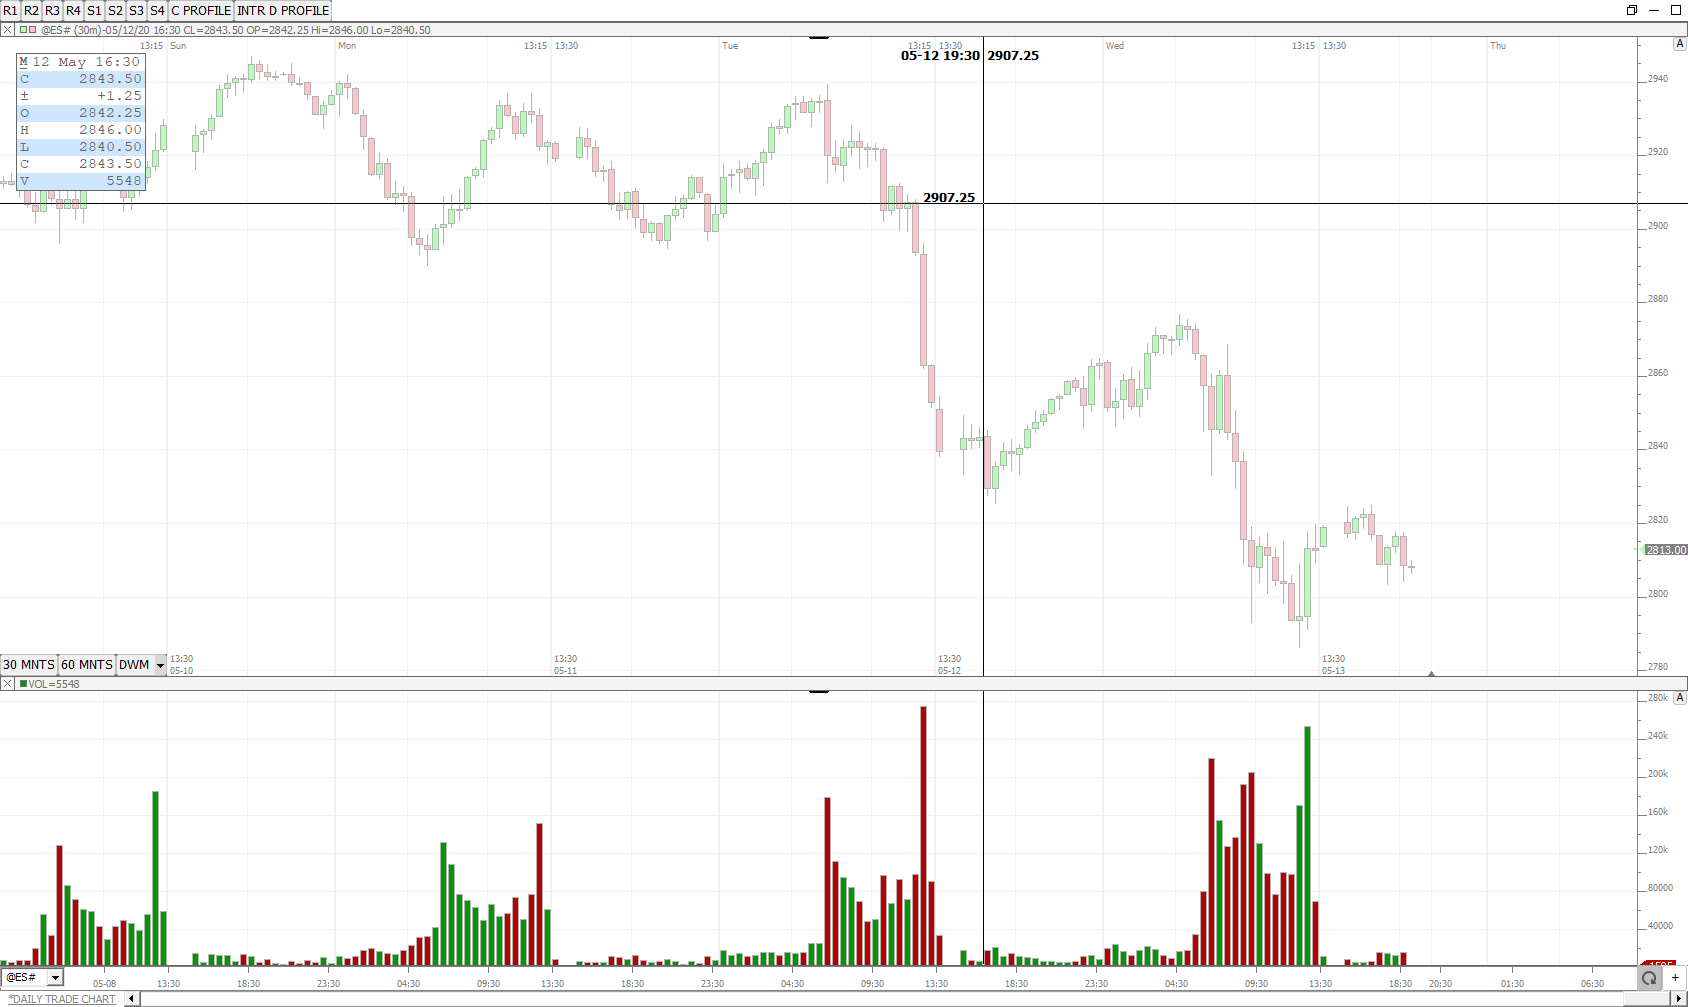 |
DAILY TRADE CHART (@ES#) sss390 [totalcount]
6 years 2 months ago
DAILY TRADE SET UP MAY 13TH. This chart was uploaded by Investor/RT 13.6.15 showing symbol: @ES#. |
View |
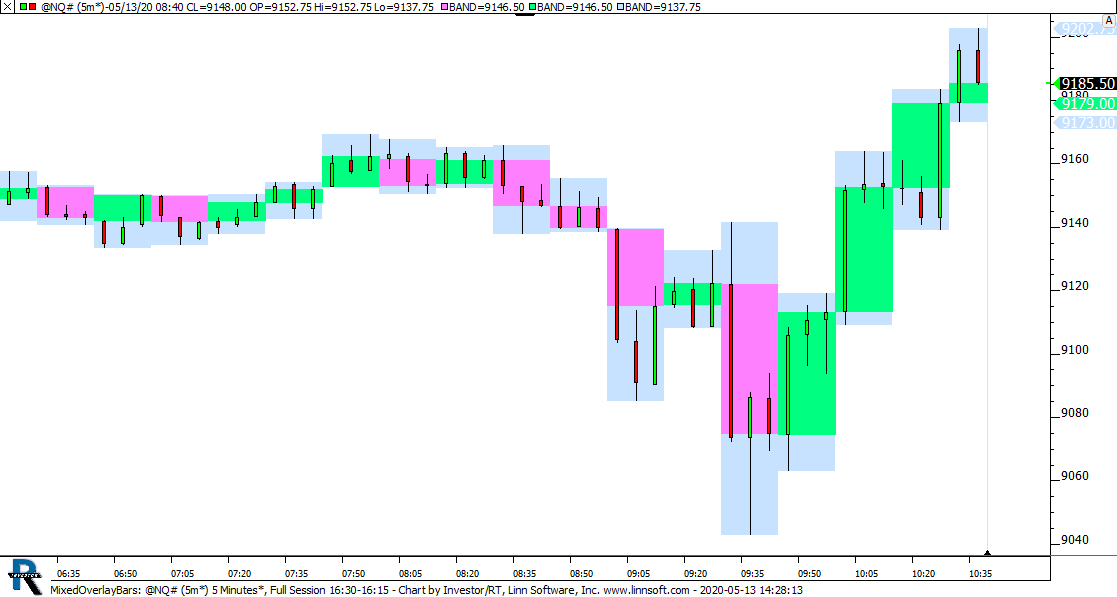 |
MixedOverlayBars (@NQ#) cpayne [totalcount]
6 years 2 months ago
15 Min Candles on 5 Min Candles. This chart was uploaded by Investor/RT 14.1.7 showing symbol: @NQ#. |
View |
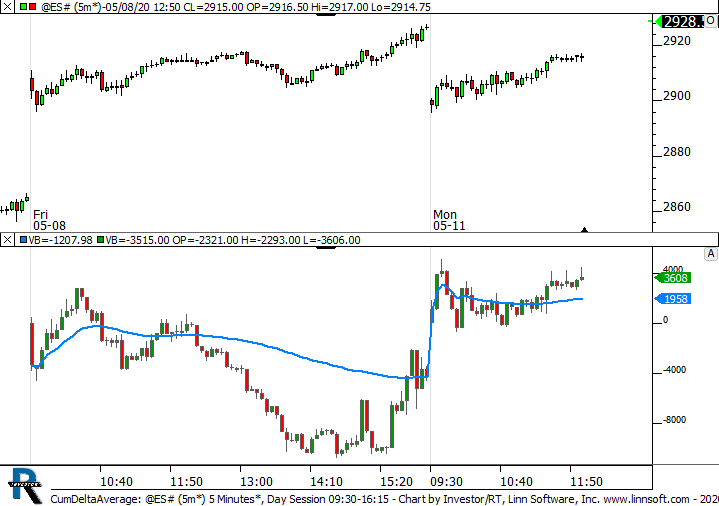 |
CumDeltaAverage (@ES#) cpayne [totalcount]
6 years 2 months ago
Cumulative Detla with Moving Average. This chart was uploaded by Investor/RT 14.1.7 showing symbol: @ES#. |
View |
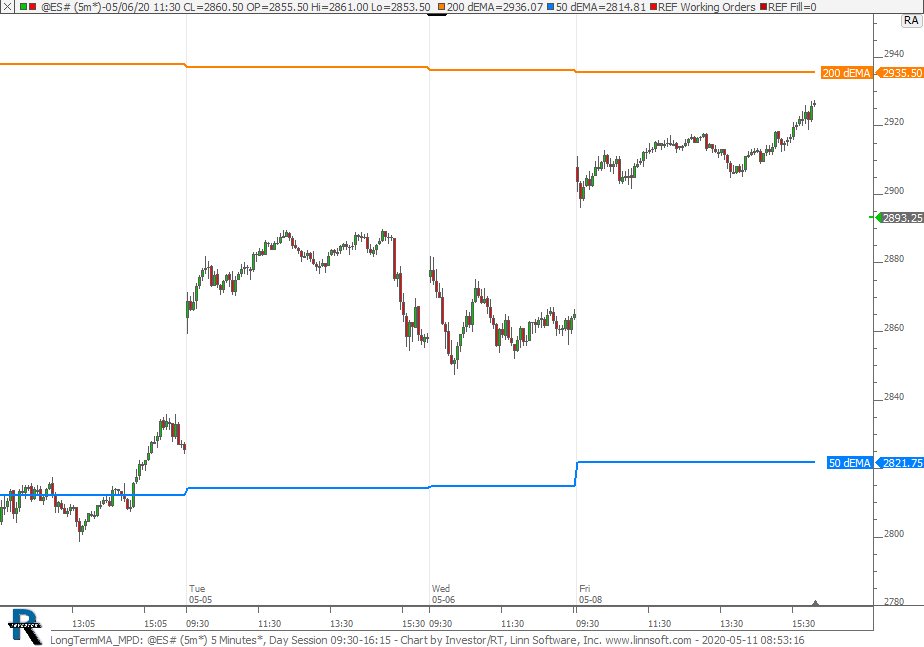 |
LongTermMA MPD (@ES#) cpayne [totalcount]
6 years 2 months ago
Longer Term - Daily 50 and 200 EMA on Intraday Chart. This chart was uploaded by Investor/RT 14.1.7 showing symbol: @ES#. |
View |
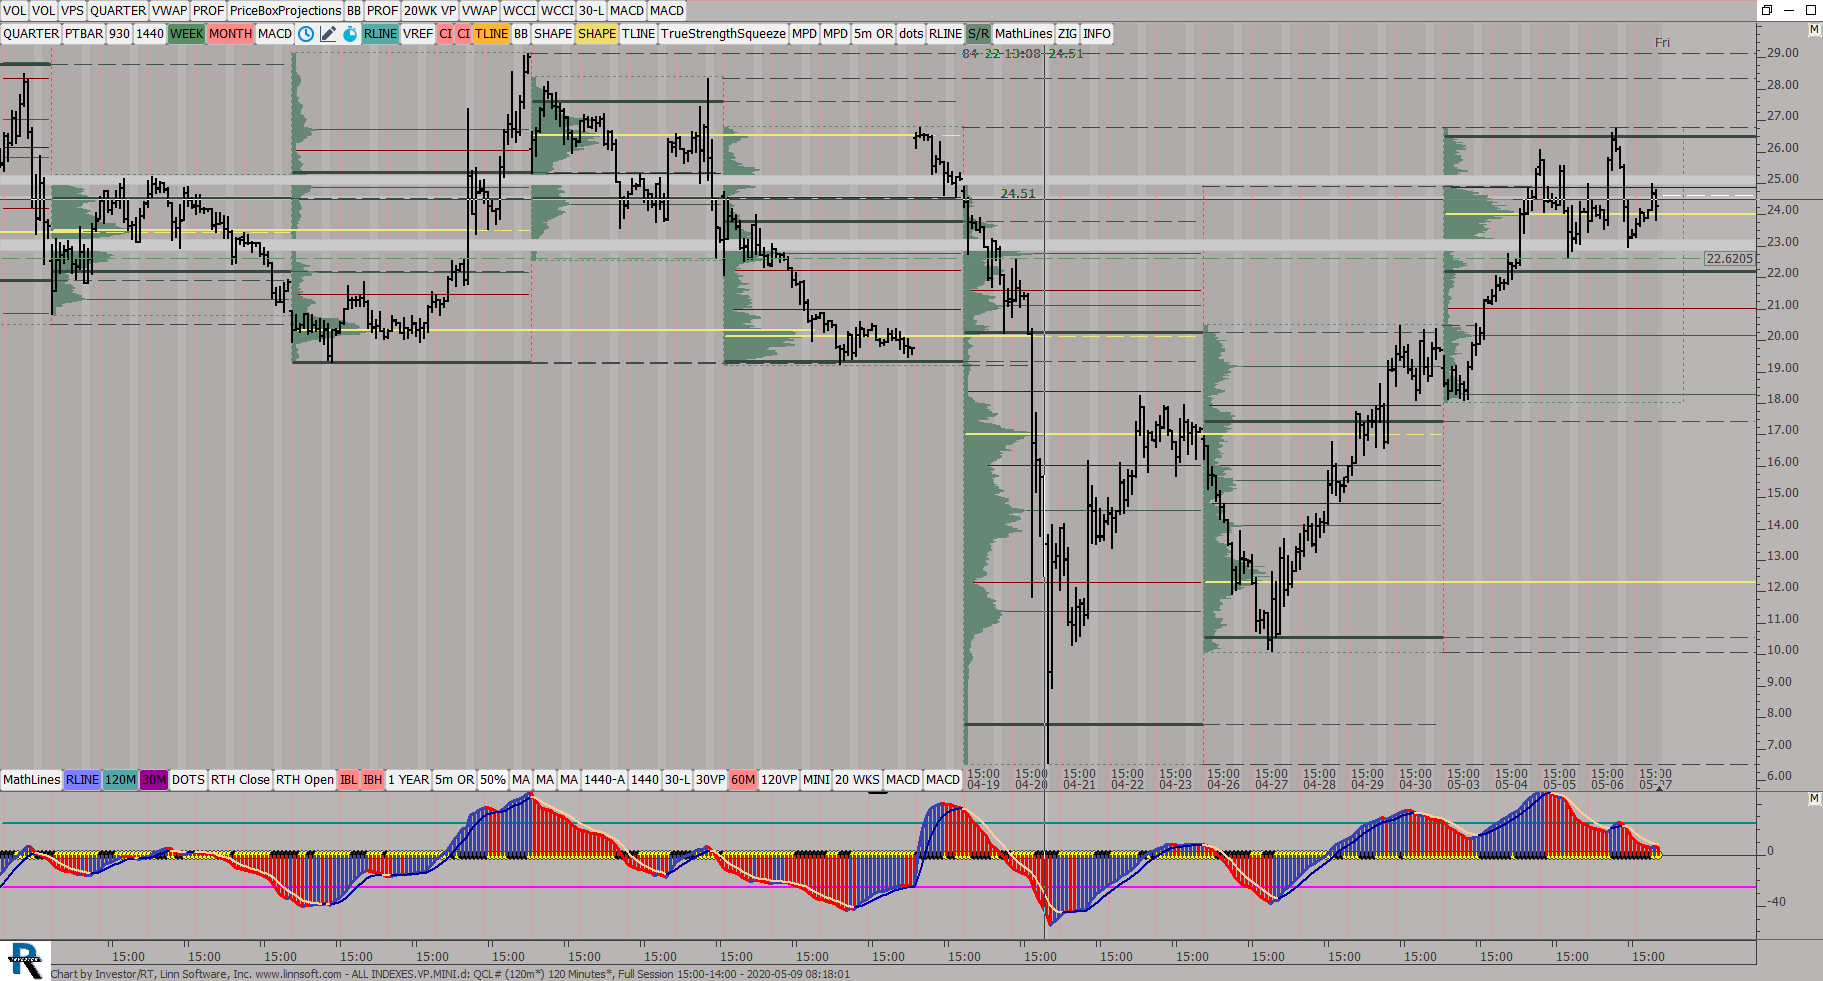 |
ALL INDEXESVPMINId (QCL#) ES42 [totalcount]
6 years 2 months ago
This chart was uploaded by Investor/RT 13.6.15 showing symbol: QCL#. |
View |
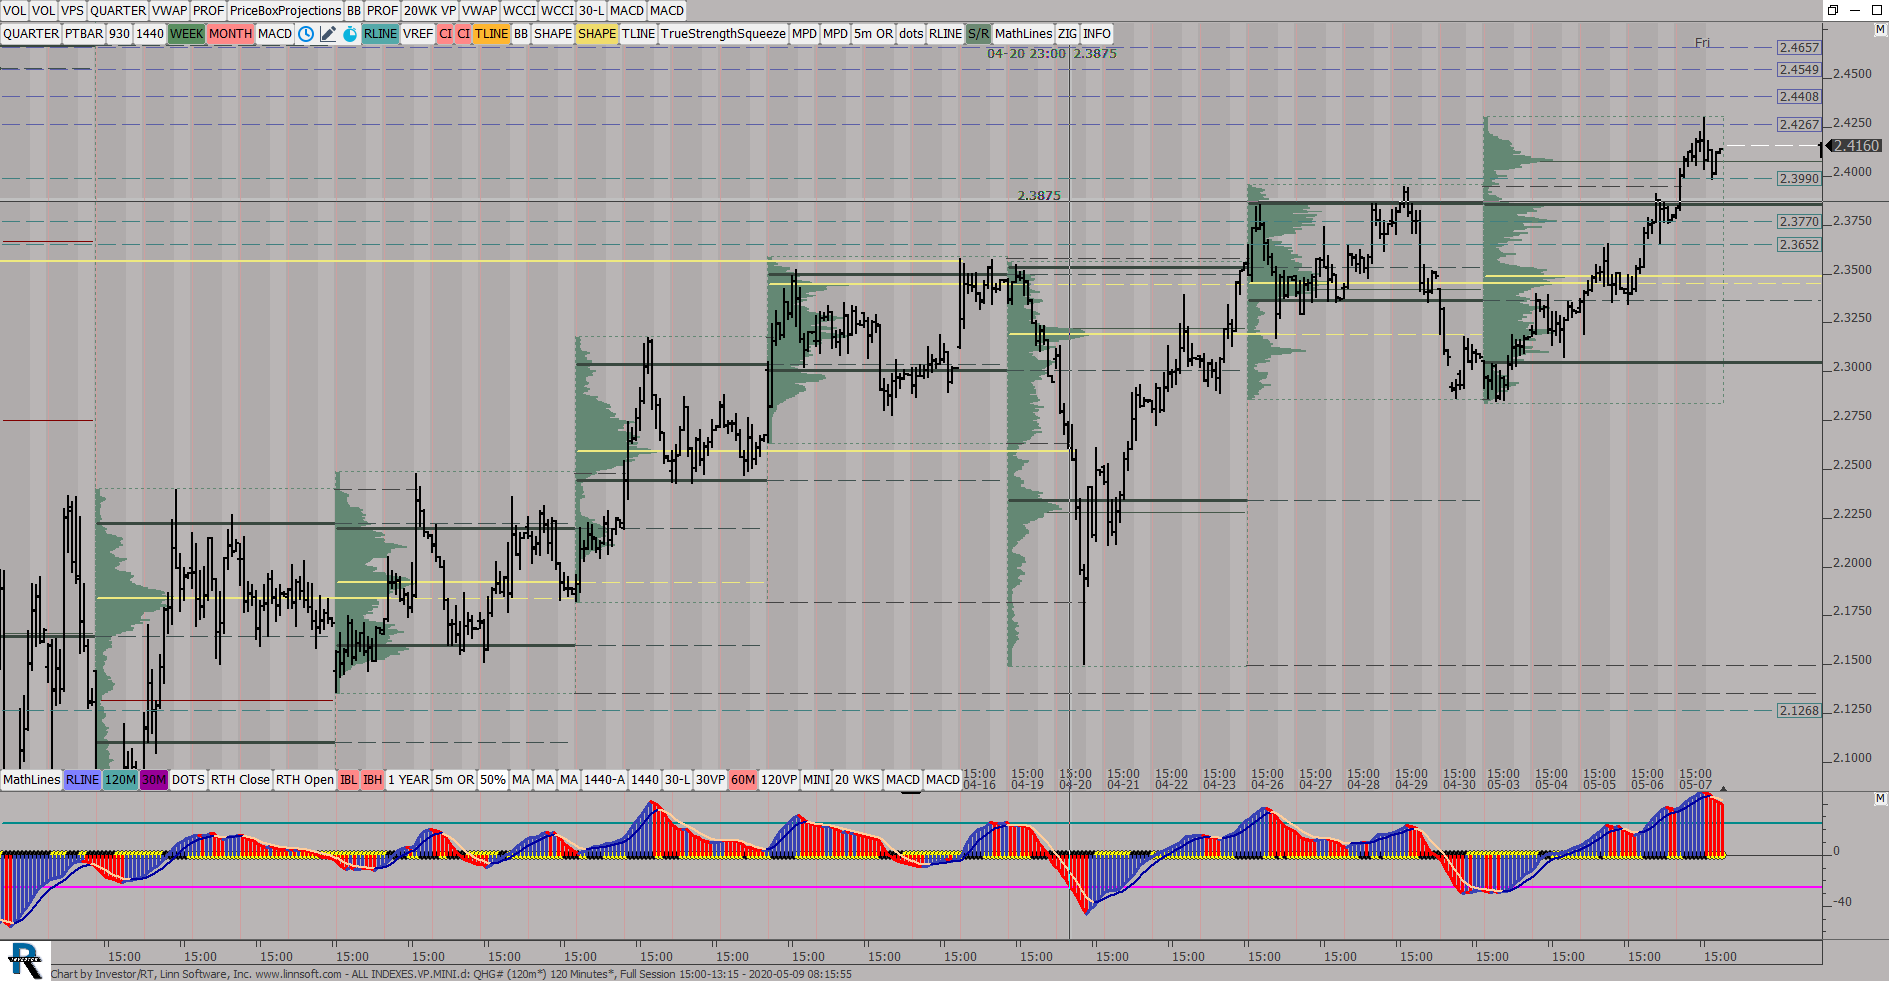 |
ALL INDEXESVPMINId (QHG#) ES42 [totalcount]
6 years 2 months ago
This chart was uploaded by Investor/RT 13.6.15 showing symbol: QHG#. |
View |
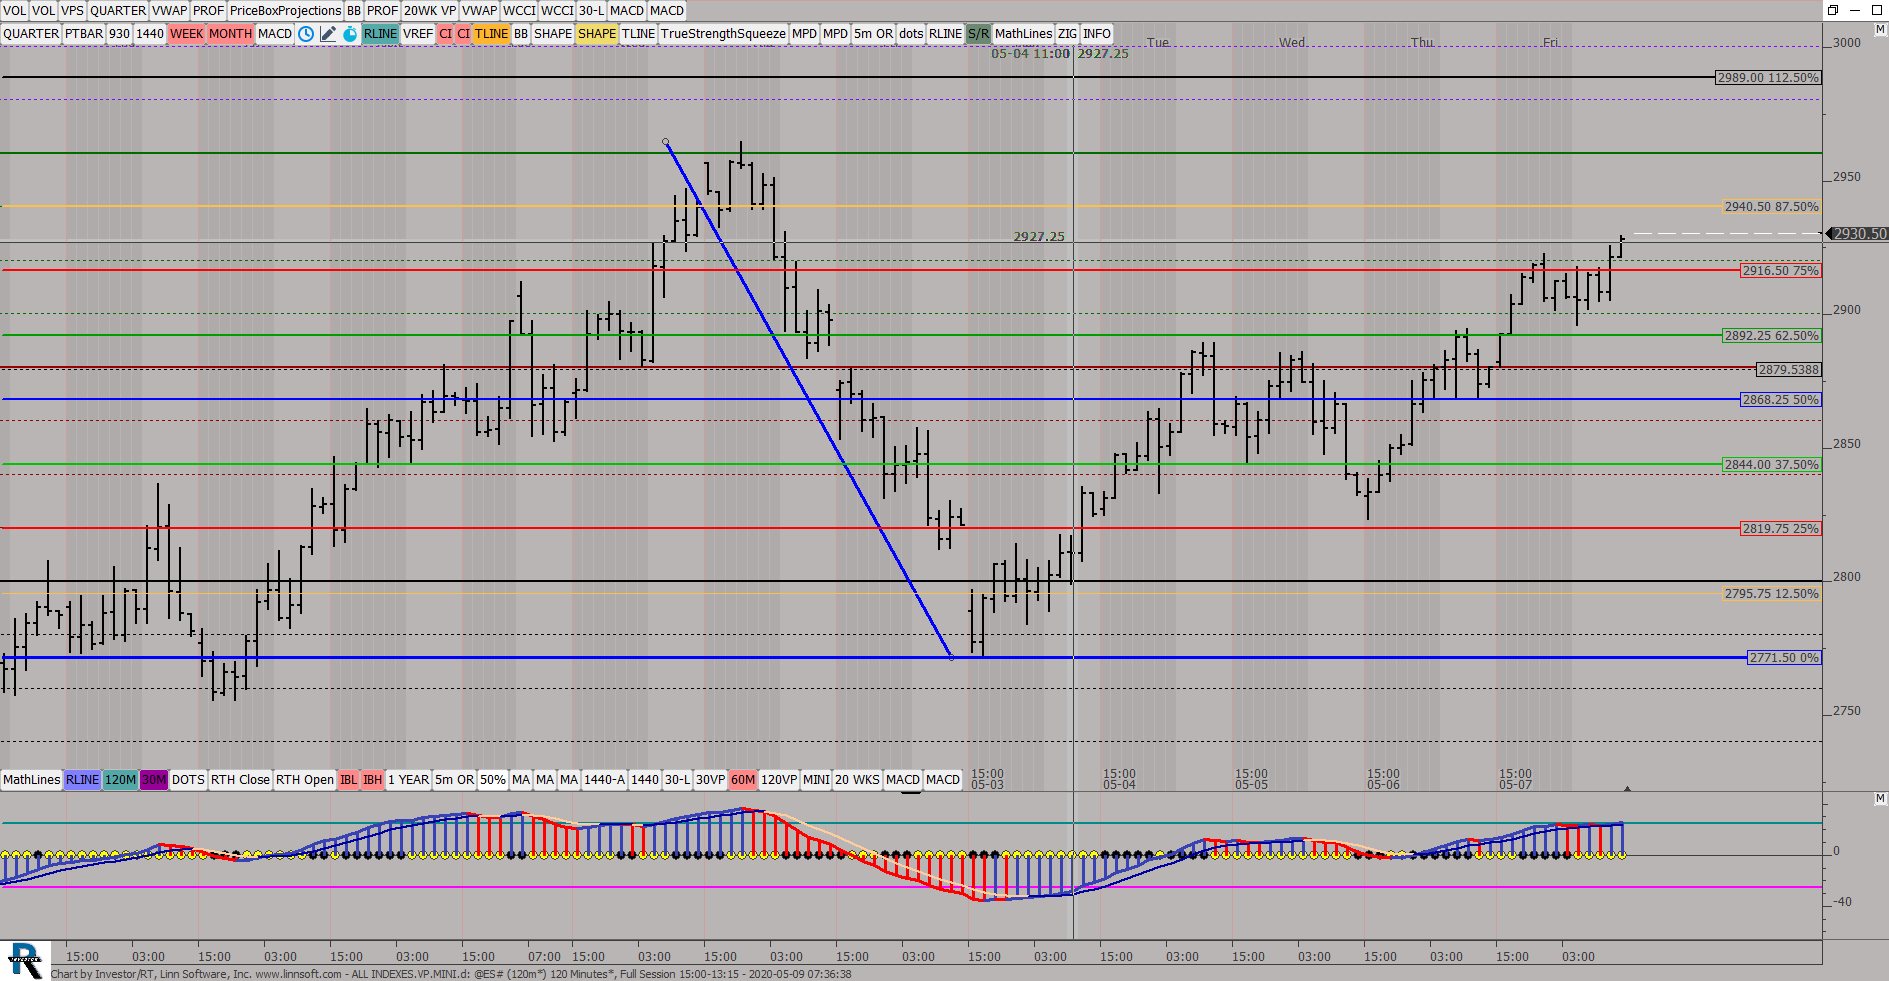 |
ALL INDEXESVPMINId (@ES#) ES42 [totalcount]
6 years 2 months ago
This chart was uploaded by Investor/RT 13.6.15 showing symbol: @ES#. |
View |
 |
MPGLOBEXDAILY (@ES#) ES42 [totalcount]
6 years 2 months ago
This chart was uploaded by Investor/RT 13.6.15 showing symbol: @ES#. |
View |
 |
MP ES WEEKLY (@ES#) ES42 [totalcount]
6 years 2 months ago
This chart was uploaded by Investor/RT 13.6.15 showing symbol: @ES#. |
View |
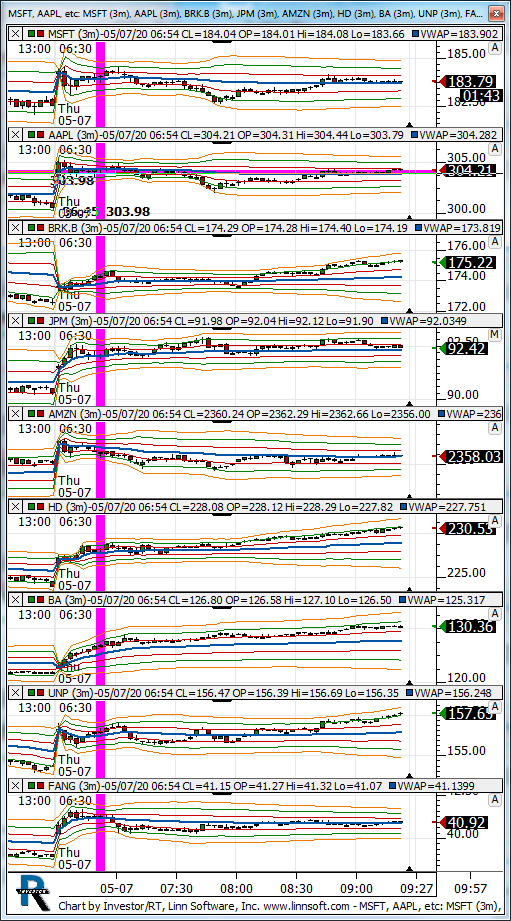 |
MSFT AAPL etc (MSFT) kencassorla [totalcount]
6 years 2 months ago
stocks. This chart was uploaded by Investor/RT 13.6.3 showing symbol: MSFT. |
View |
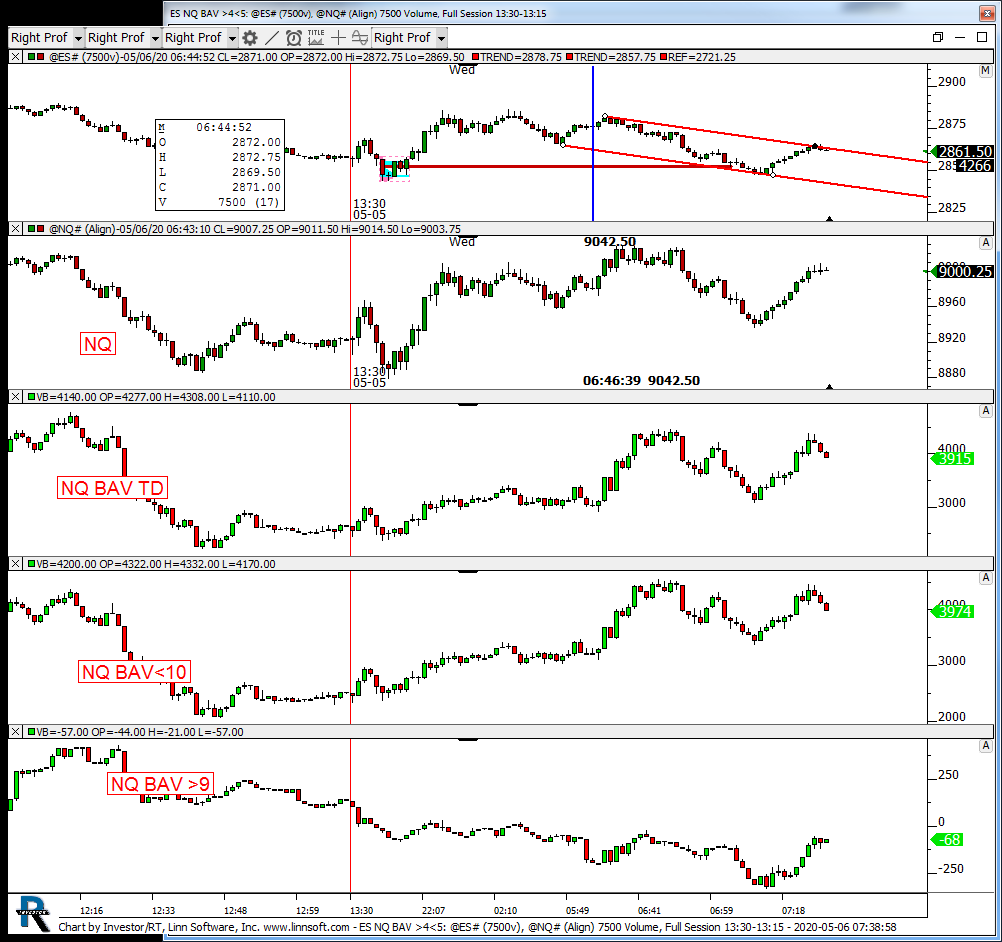 |
ES NQ BAV 45 (@ES#) kencassorla [totalcount]
6 years 2 months ago
deltas. This chart was uploaded by Investor/RT 13.6.15 showing symbol: @ES#. |
View |
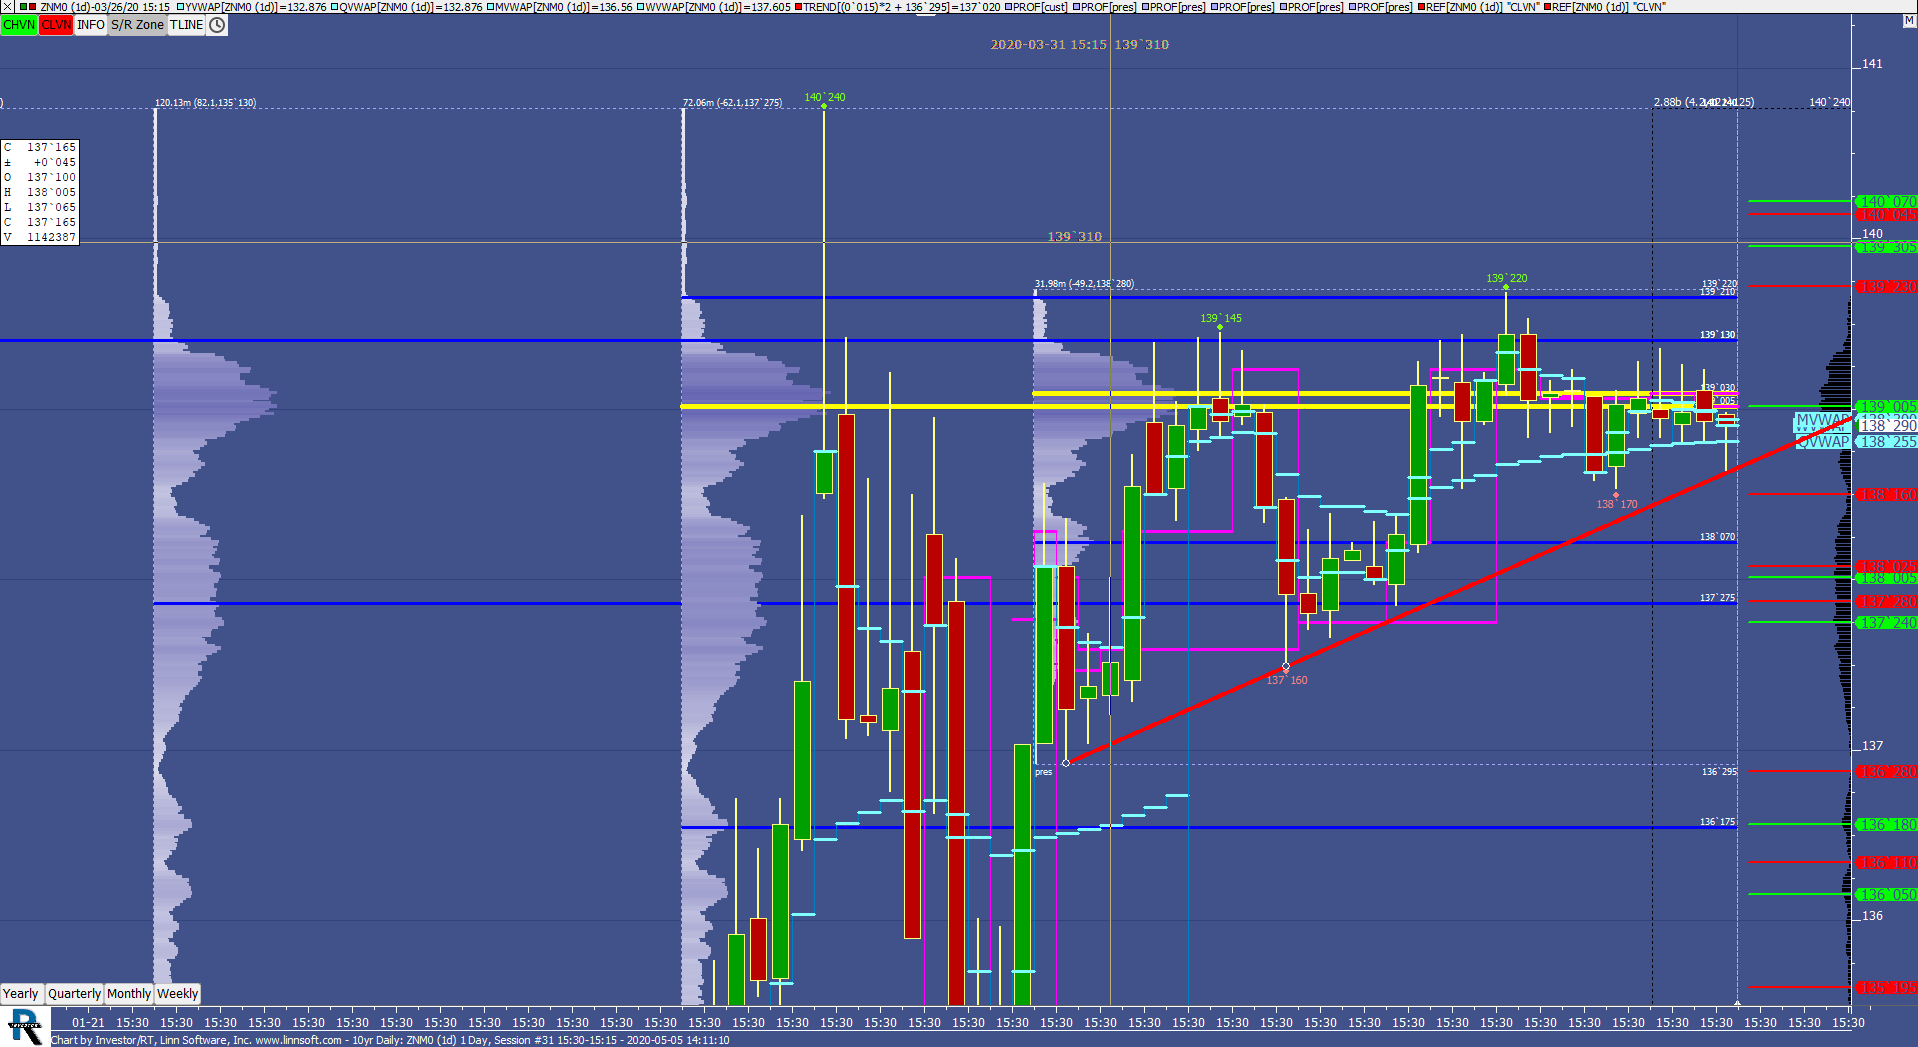 |
10yr Daily (ZNM0) scottz46 [totalcount]
6 years 2 months ago
This chart was uploaded by Investor/RT 13.6.15 showing symbol: ZNM0. |
View |
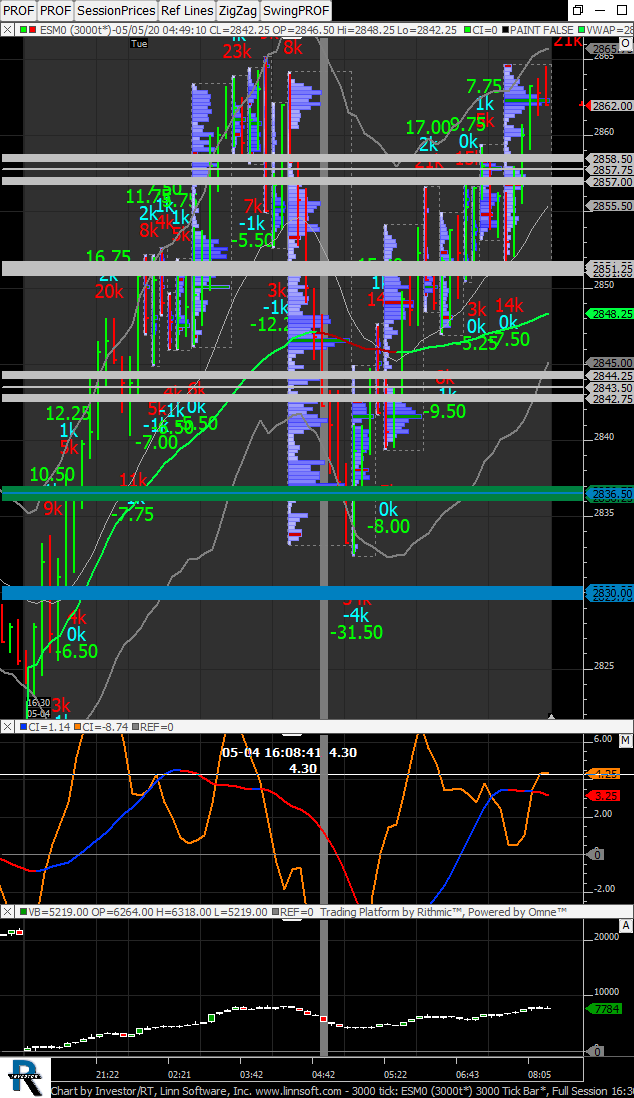 |
3000 tick (ESM0) David Lieberman [totalcount]
6 years 2 months ago
This chart was uploaded by Investor/RT 14.1.6 showing symbol: ESM0. |
View |
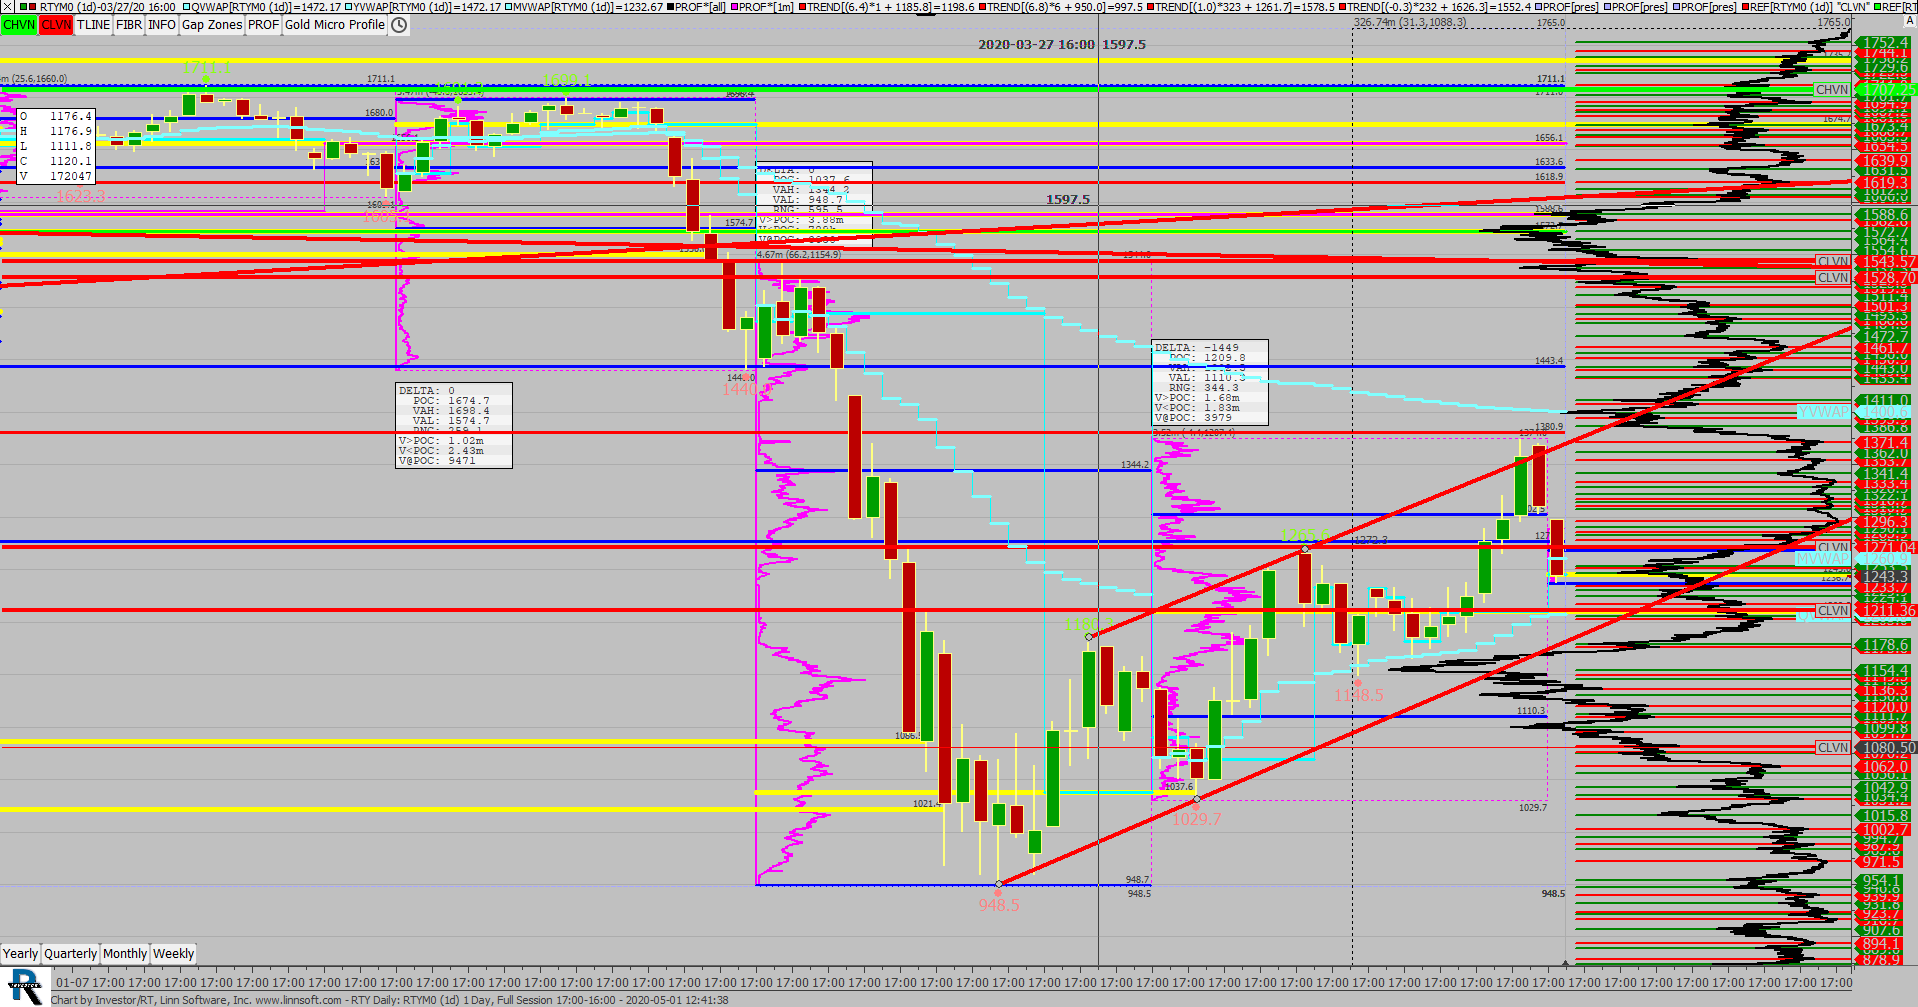 |
RTY Daily (RTYM0) scottz46 [totalcount]
6 years 3 months ago
This chart was uploaded by Investor/RT 13.6.15 showing symbol: RTYM0. |
View |
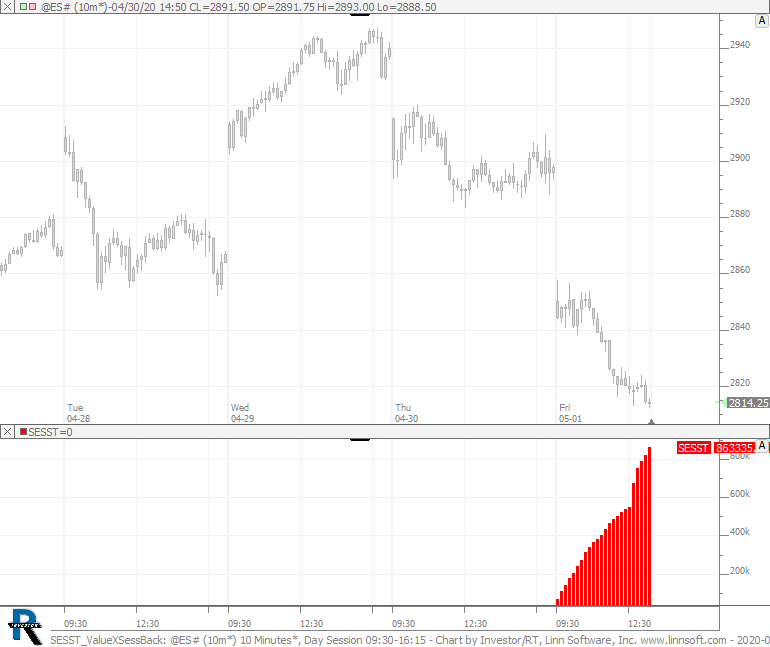 |
SESST ValueXSessBack (@ES#) cpayne [totalcount]
6 years 3 months ago
This chart was uploaded by Investor/RT 14.1.6 showing symbol: @ES#. |
View |