 |
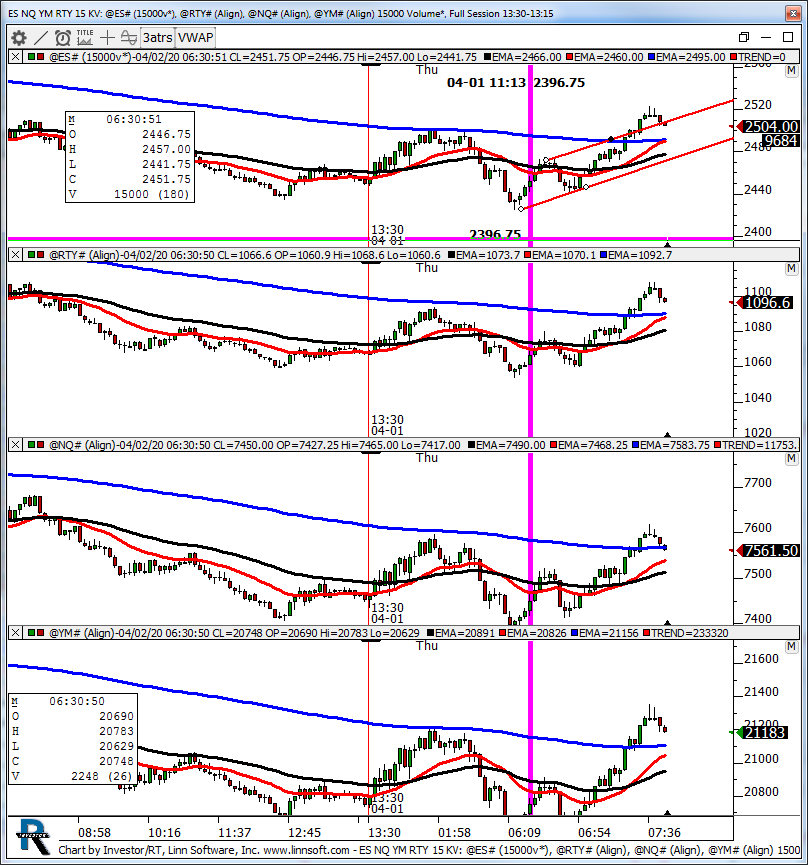
ES NQ YM RTY 15 KV (@ES#) kencassorla [totalcount]
6 years 3 months ago
15 kv indexes. This chart was uploaded by Investor/RT 13.6.15 showing symbol: @ES#. |
View |
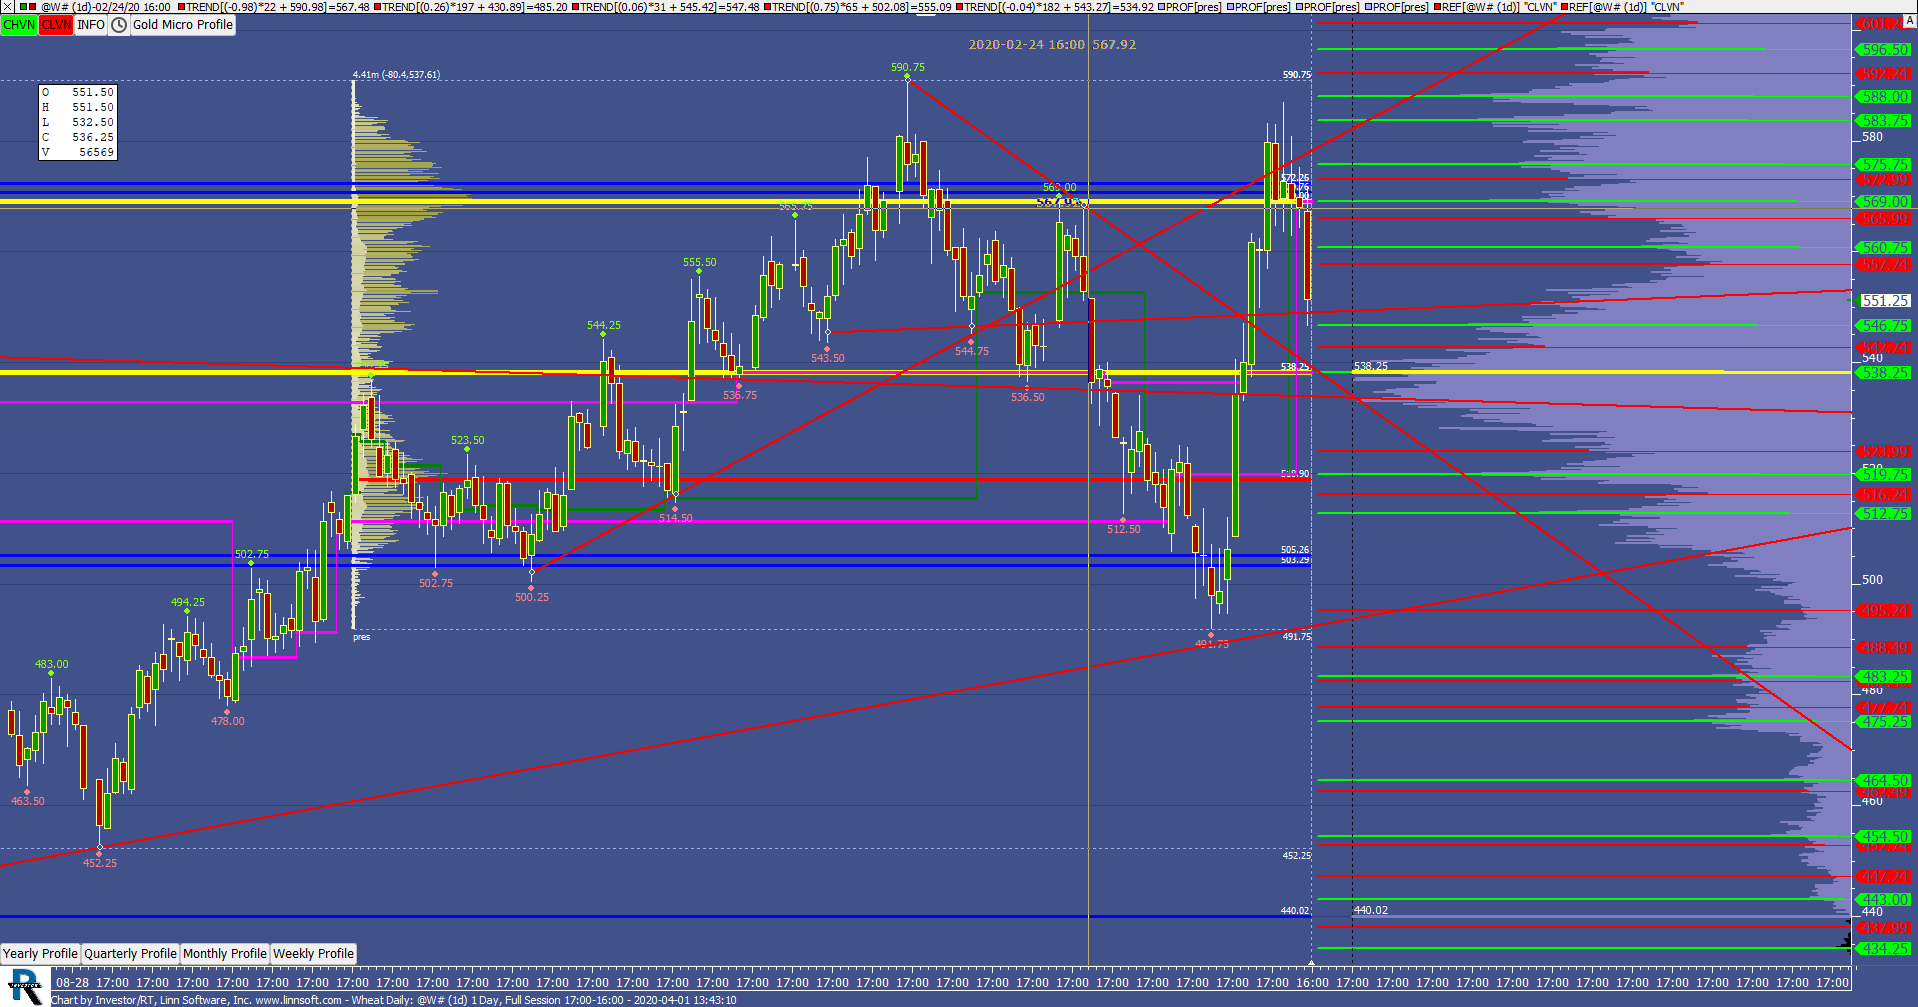 |
Wheat Daily (@W#) scottz46 [totalcount]
6 years 4 months ago
This chart was uploaded by Investor/RT 13.5.24 showing symbol: @W#. |
View |
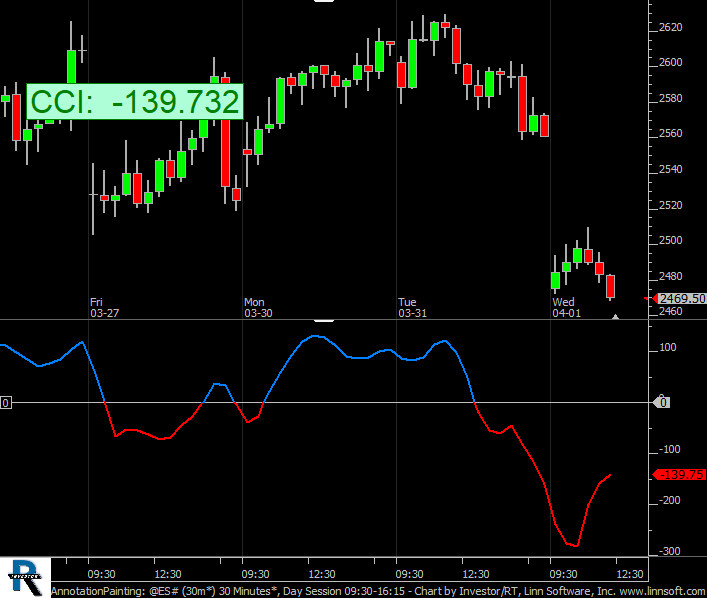 |
AnnotationPainting (@ES#) cpayne [totalcount]
6 years 4 months ago
Annotation Painting Options. This chart was uploaded by Investor/RT 14.1.4 showing symbol: @ES#. |
View |
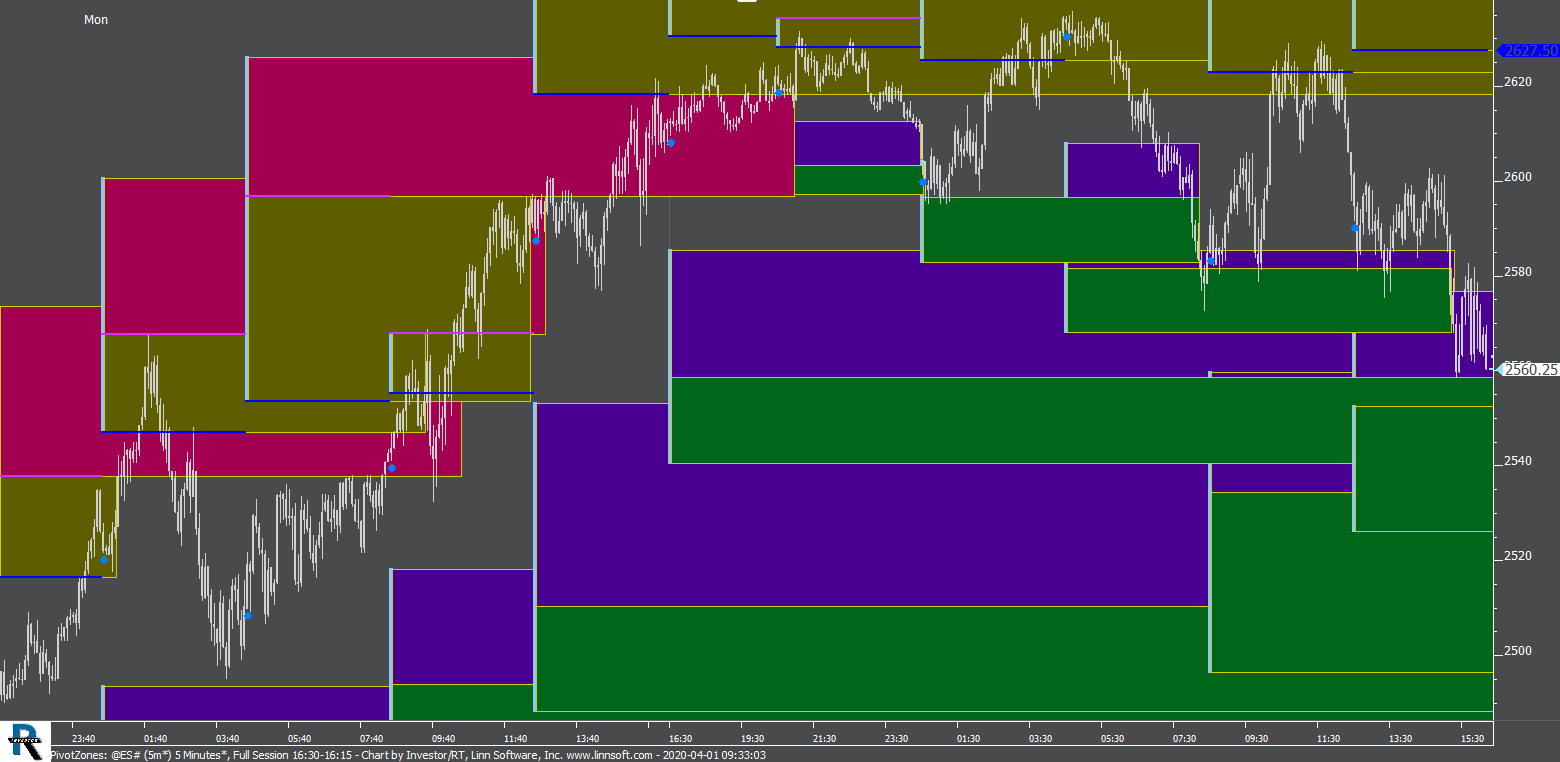 |
PivotZones (@ES#) cpayne [totalcount]
6 years 4 months ago
Pivot Zones. This chart was uploaded by Investor/RT 14.1.4 showing symbol: @ES#. |
View |
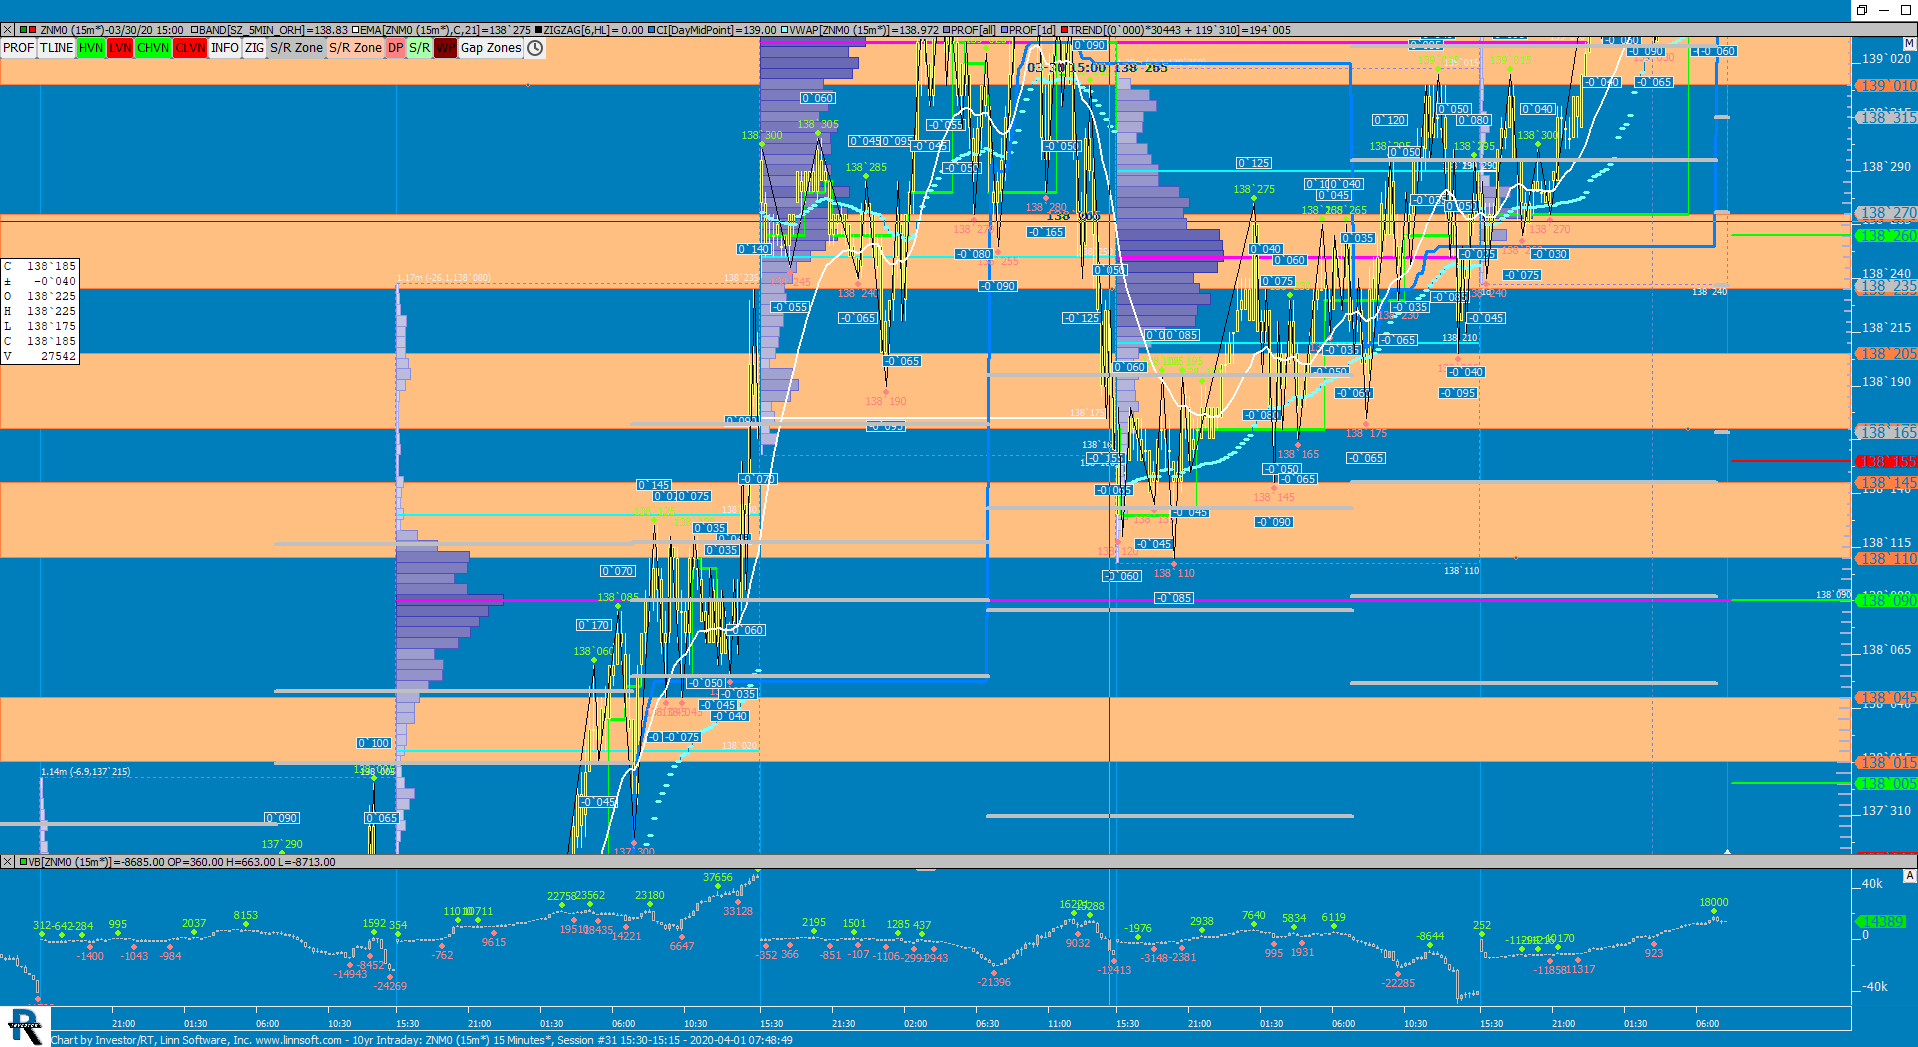 |
10yr Intraday (ZNM0) scottz46 [totalcount]
6 years 4 months ago
This chart was uploaded by Investor/RT 13.6.15 showing symbol: ZNM0. |
View |
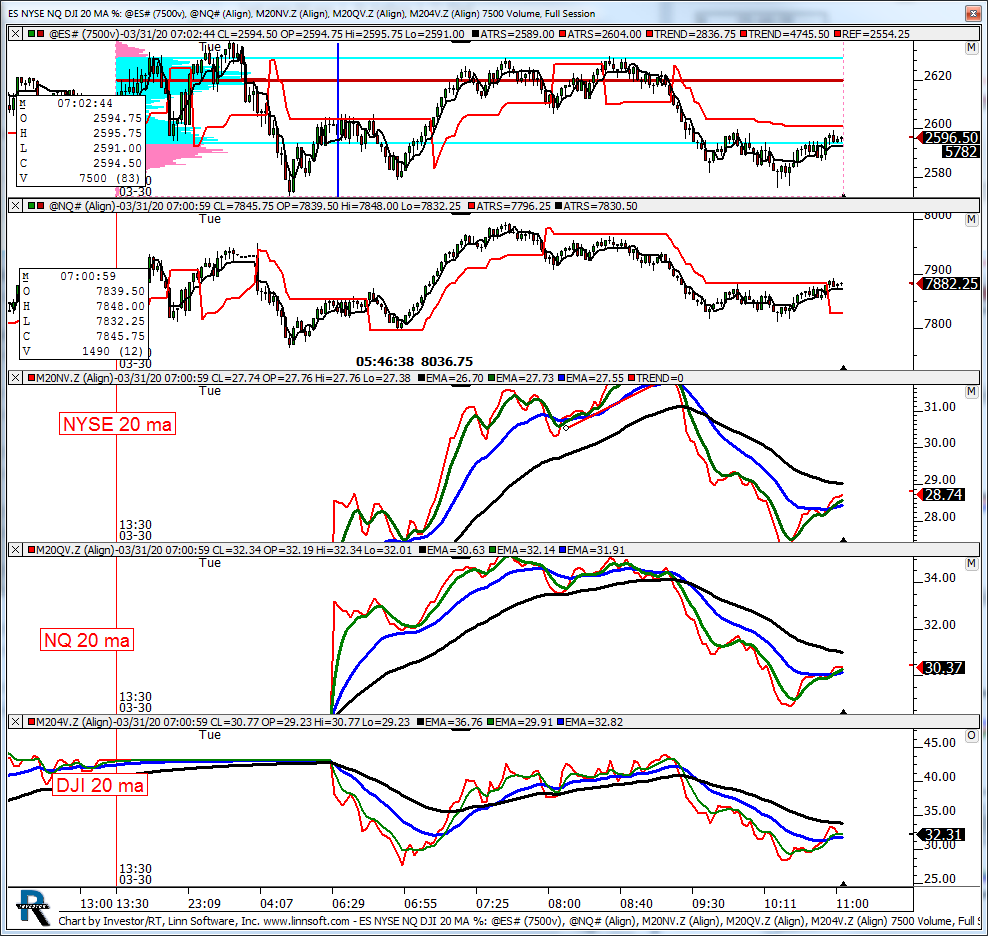 |
ES NYSE NQ DJI 20 MA (@ES#) kencassorla [totalcount]
6 years 4 months ago
ma. This chart was uploaded by Investor/RT 13.6.15 showing symbol: @ES#. |
View |
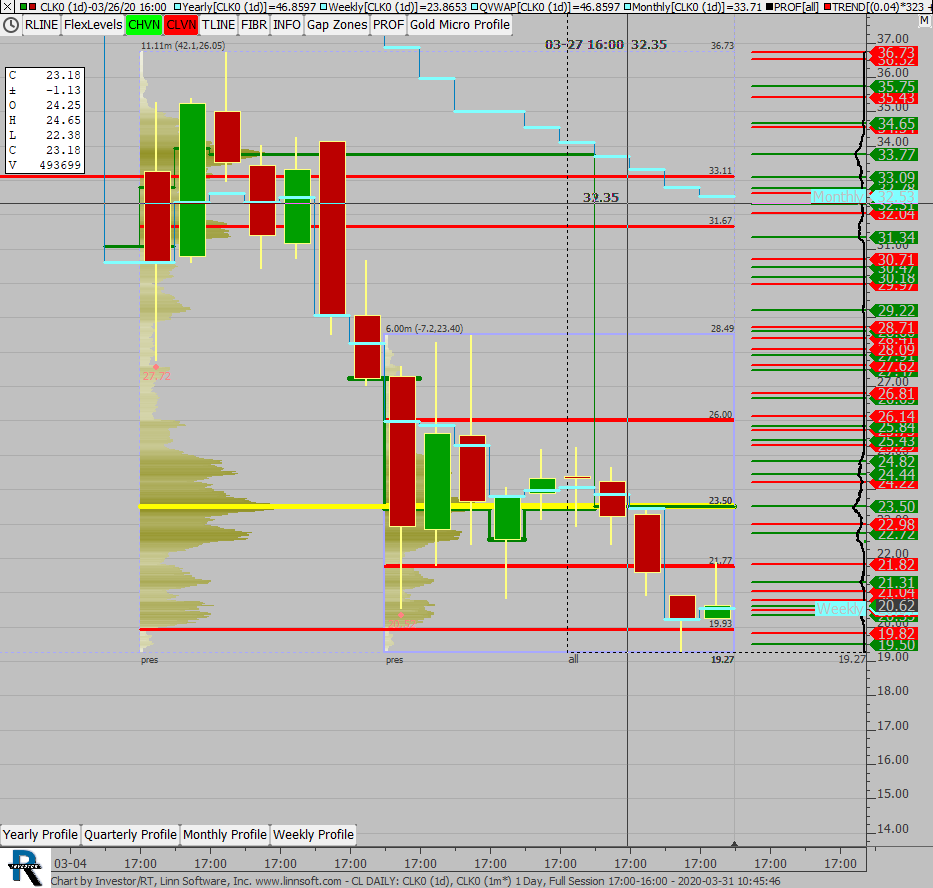 |
CL DAILY (CLK0) scottz46 [totalcount]
6 years 4 months ago
This chart was uploaded by Investor/RT 13.6.15 showing symbol: CLK0. |
View |
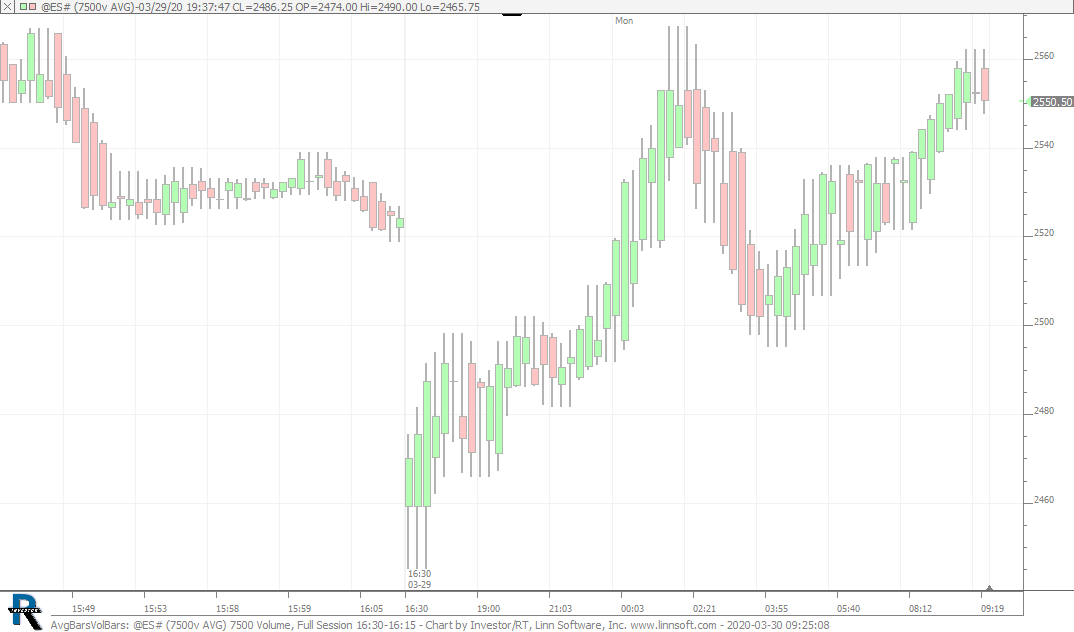 |
AvgBarsVolBars (@ES#) cpayne [totalcount]
6 years 4 months ago
Average Bars of 7500 Vol Bar. This chart was uploaded by Investor/RT 14.1.4 showing symbol: @ES#. |
View |
 |
ESMPWEEKLY (@ES#) ES42 [totalcount]
6 years 4 months ago
This chart was uploaded by Investor/RT 13.3.5 showing symbol: @ES#. |
View |
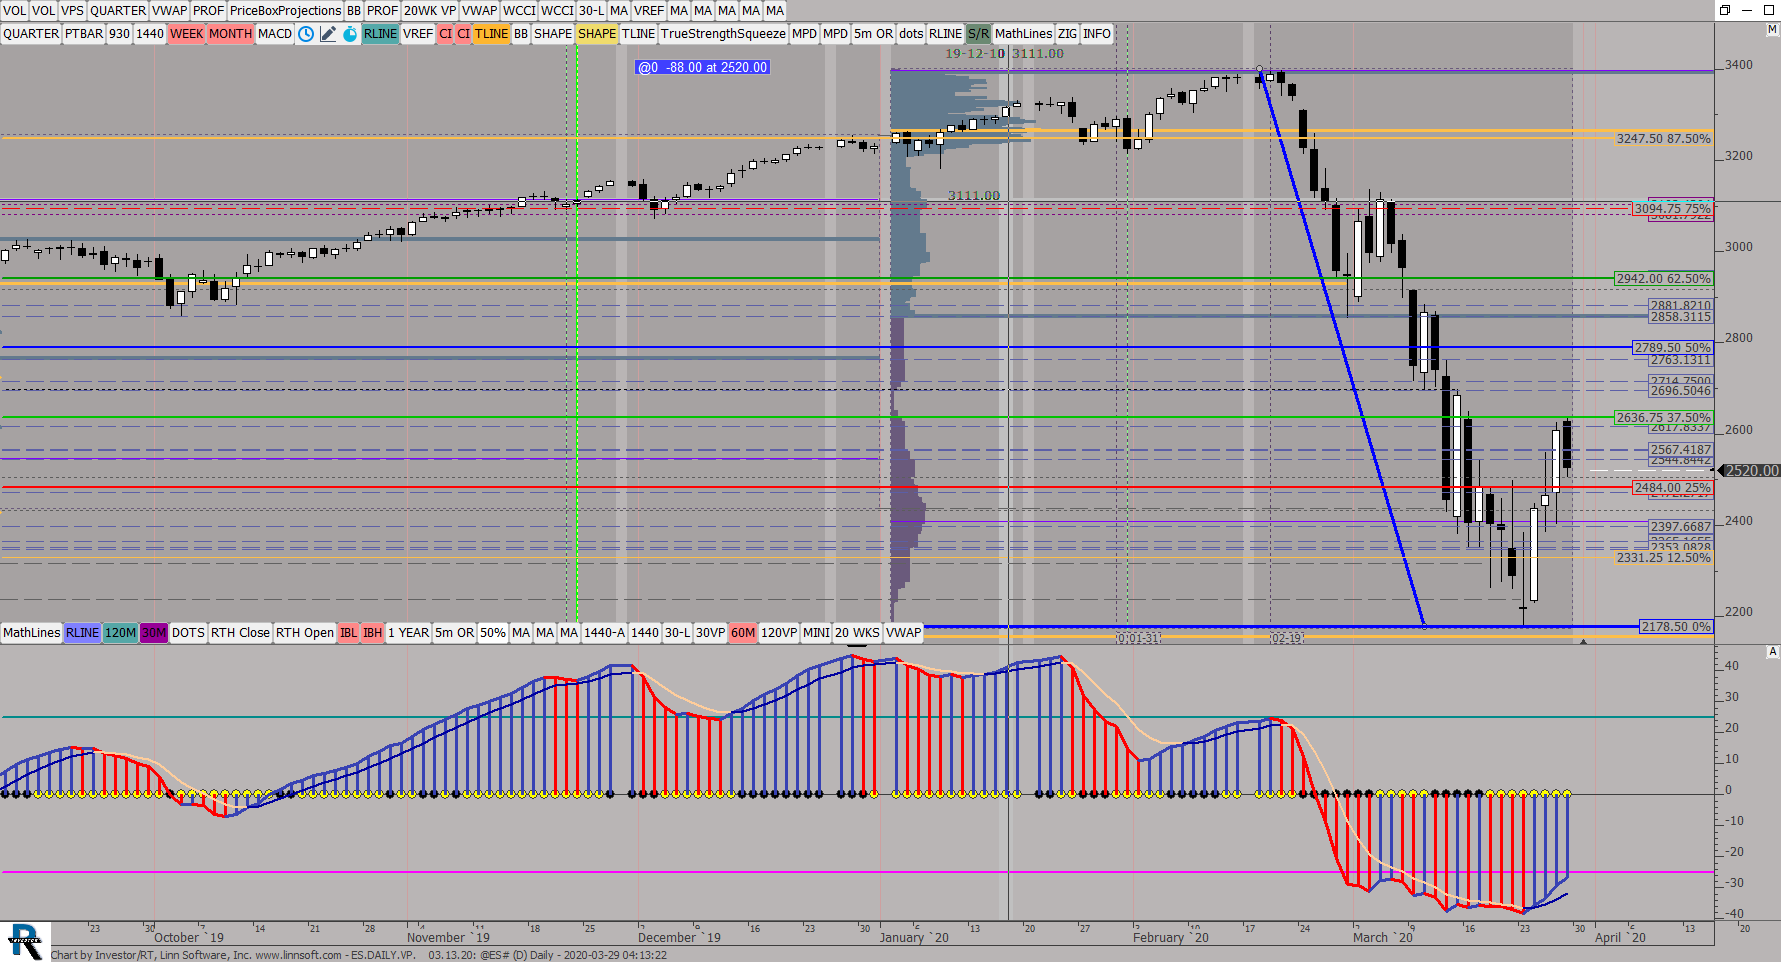 |
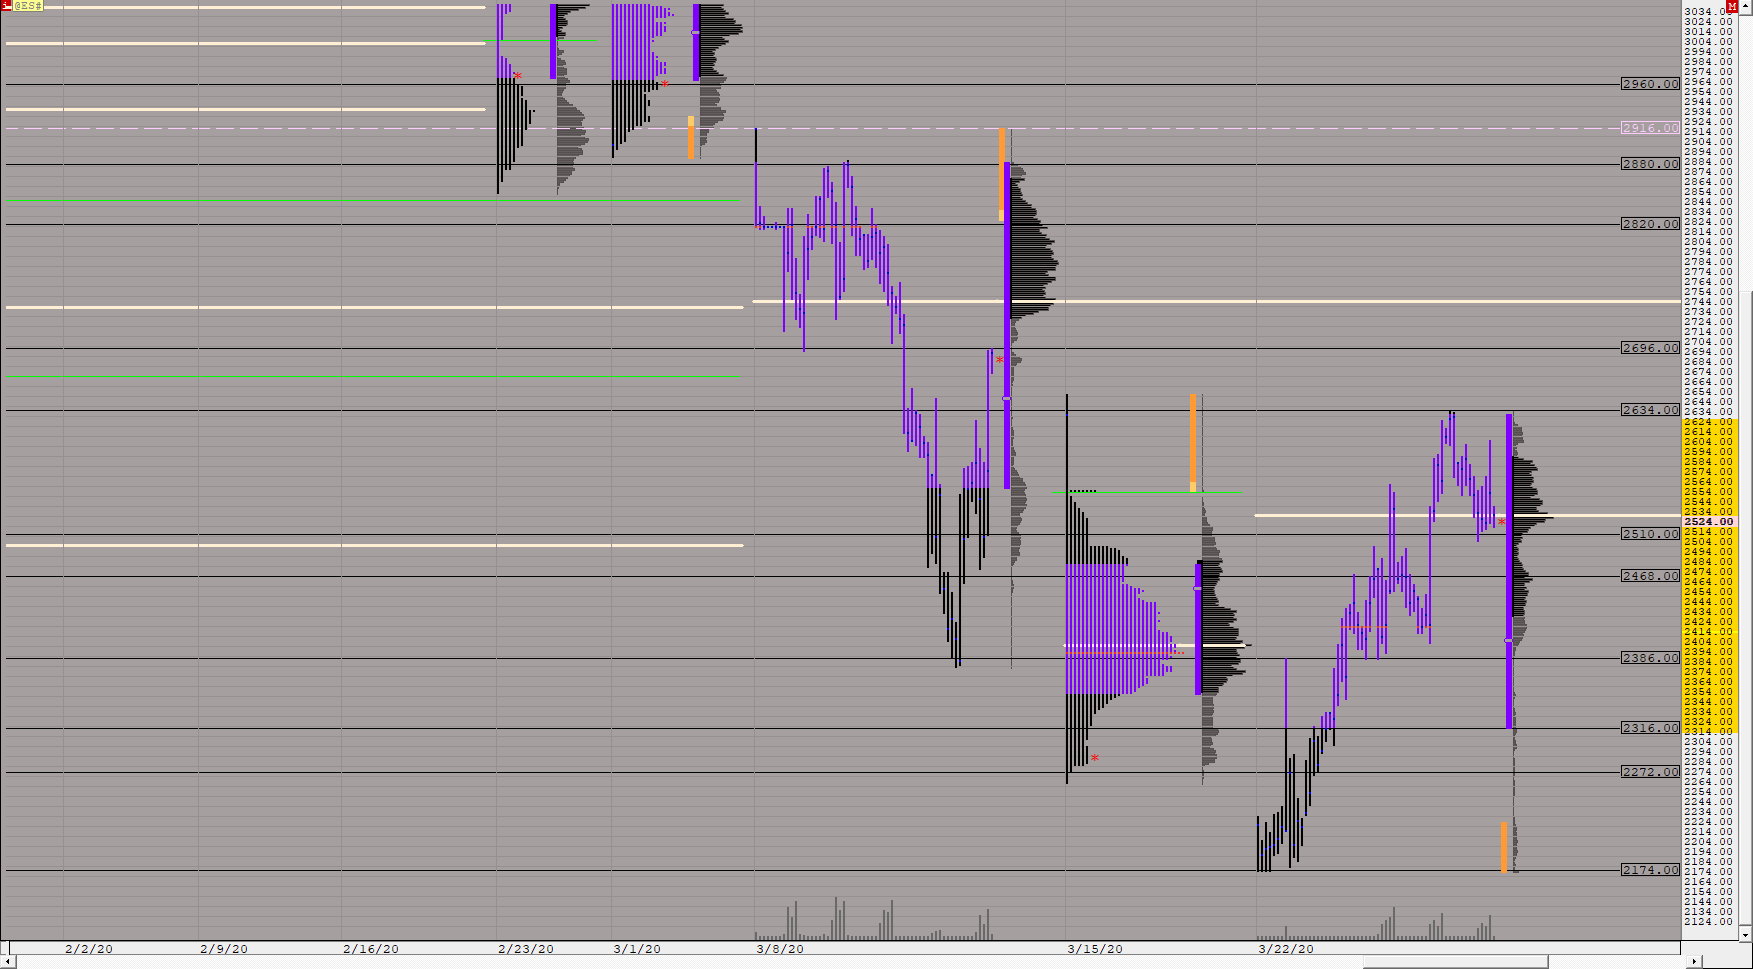
ESDAILYVP (@ES#) ES42 [totalcount]
6 years 4 months ago
Measured move to the tick. This chart was uploaded by Investor/RT 13.6.15 showing symbol: @ES#. |
View |
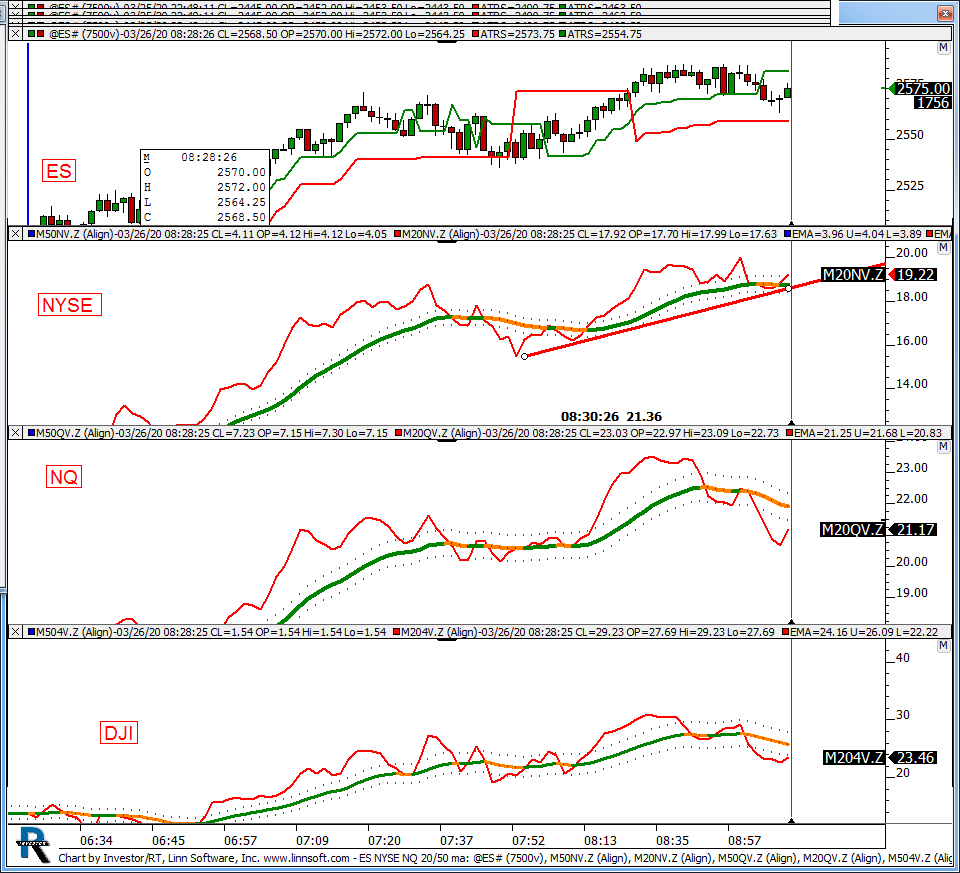 |
ES NYSE NQ 20 50 ma (@ES#) kencassorla [totalcount]
6 years 4 months ago
ma. This chart was uploaded by Investor/RT 13.6.15 showing symbol: @ES#. |
View |
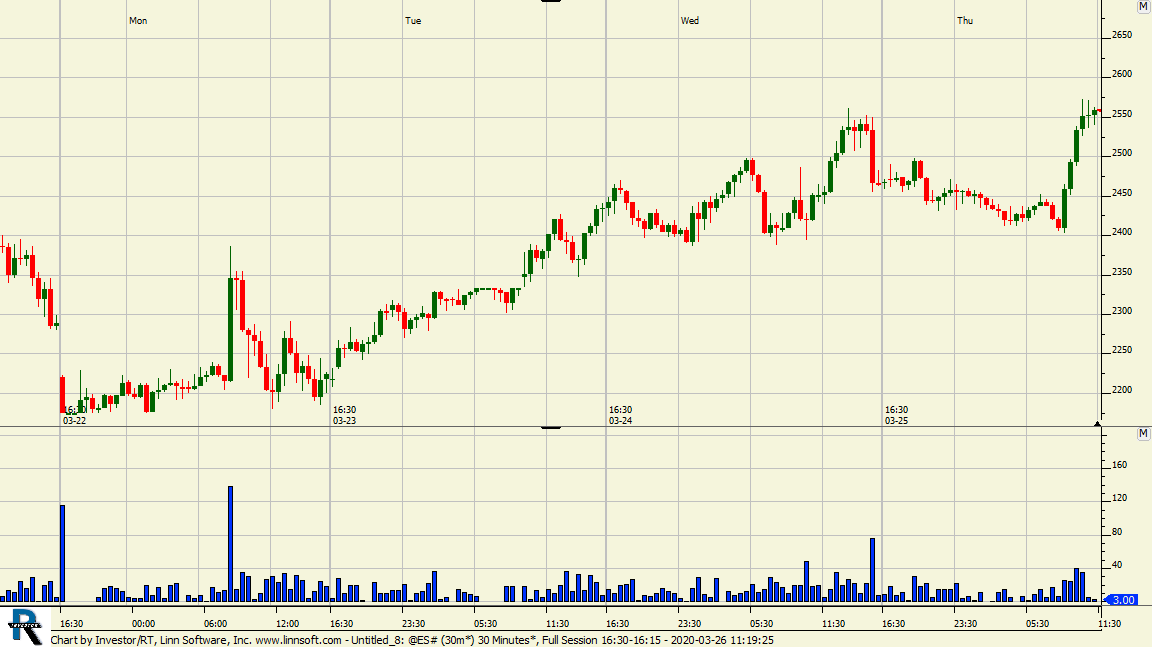 |
Untitled 8 (@ES#) scooke [totalcount]
6 years 4 months ago
This chart was uploaded by Investor/RT 12.7.1 showing symbol: @ES#. |
View |
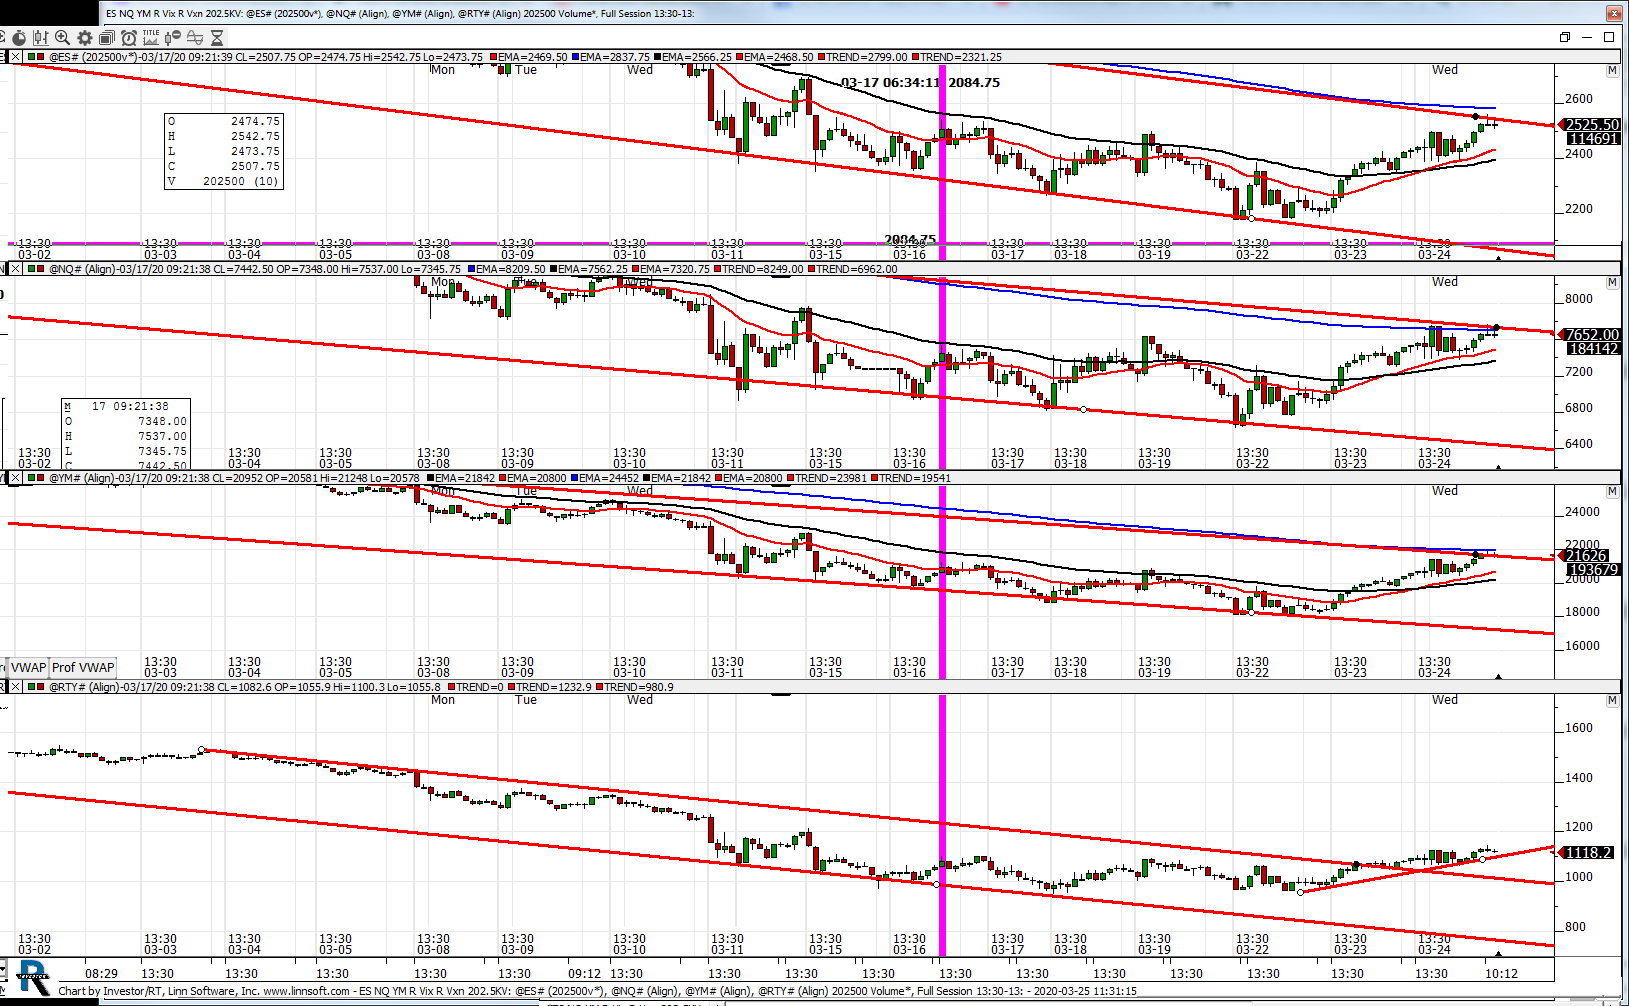 |
ES NQ YM R Vix R Vxn 2025KV (@ES#) kencassorla [totalcount]
6 years 4 months ago
202.5 KV. This chart was uploaded by Investor/RT 13.6.3 showing symbol: @ES#. |
View |
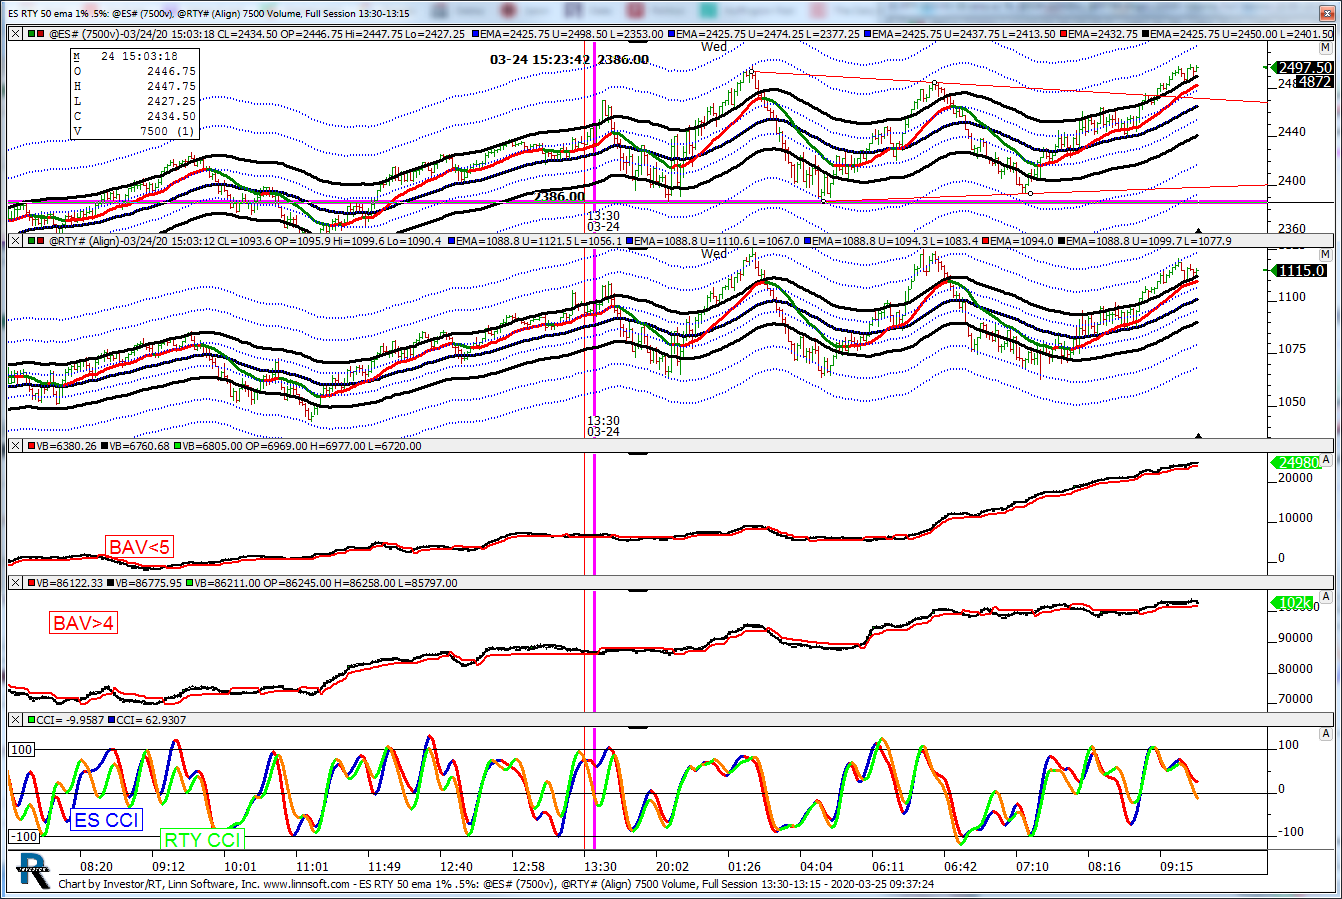 |
ES RTY 50 ema 1 5 (@ES#) kencassorla [totalcount]
6 years 4 months ago
ema %. This chart was uploaded by Investor/RT 13.6.15 showing symbol: @ES#. |
View |
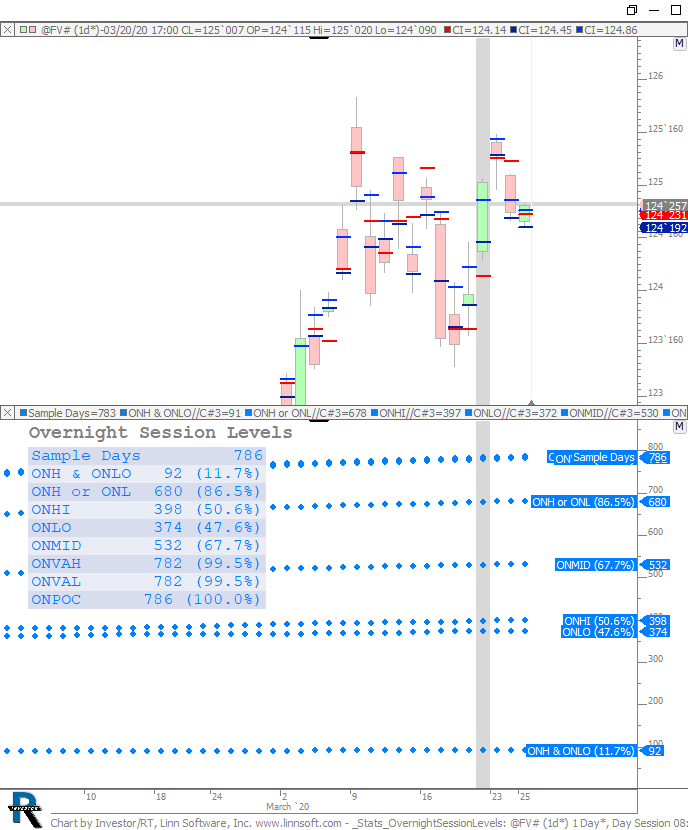 |
Stats OvernightSessionLevels (@FV#) egpaulson [totalcount]
6 years 4 months ago
This chart was uploaded by Investor/RT 13.6.15 showing symbol: @FV#. |
View |
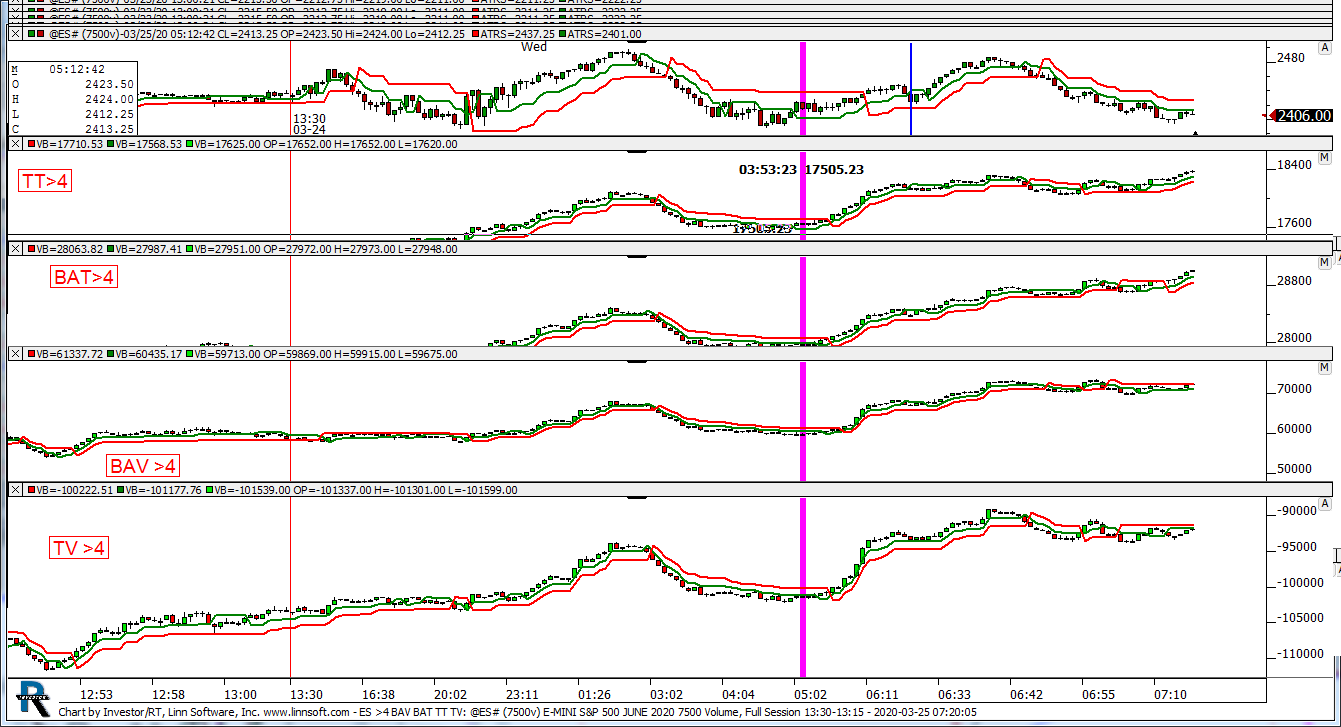 |
ES 4 BAV BAT TT TV (@ES#) kencassorla [totalcount]
6 years 4 months ago
>4. This chart was uploaded by Investor/RT 13.6.15 showing symbol: @ES#. |
View |
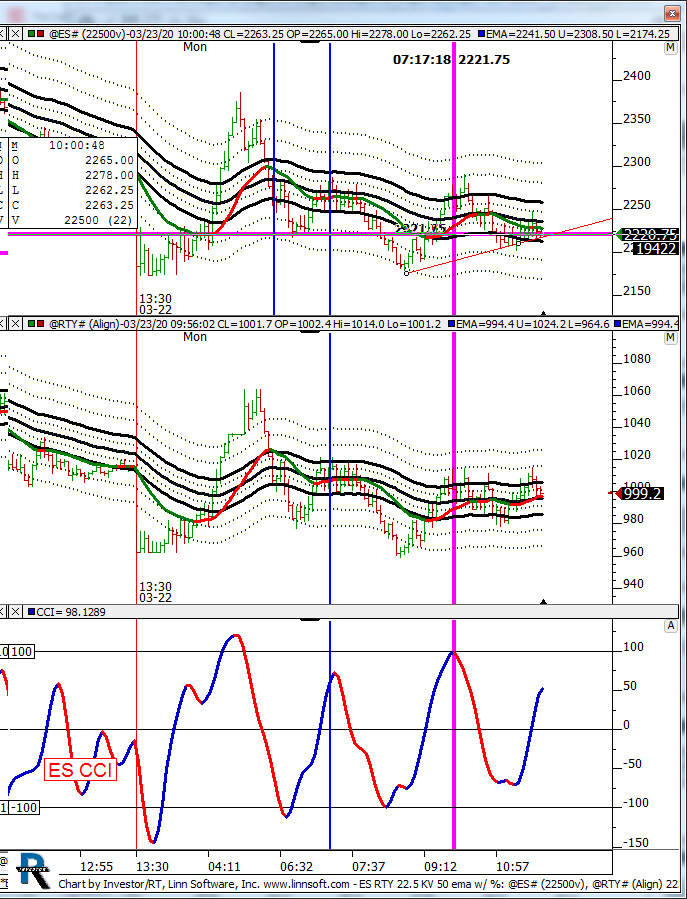 |
ES RTY 225 KV 50 ema w (@ES#) kencassorla [totalcount]
6 years 4 months ago
ema %. This chart was uploaded by Investor/RT 13.6.15 showing symbol: @ES#. |
View |
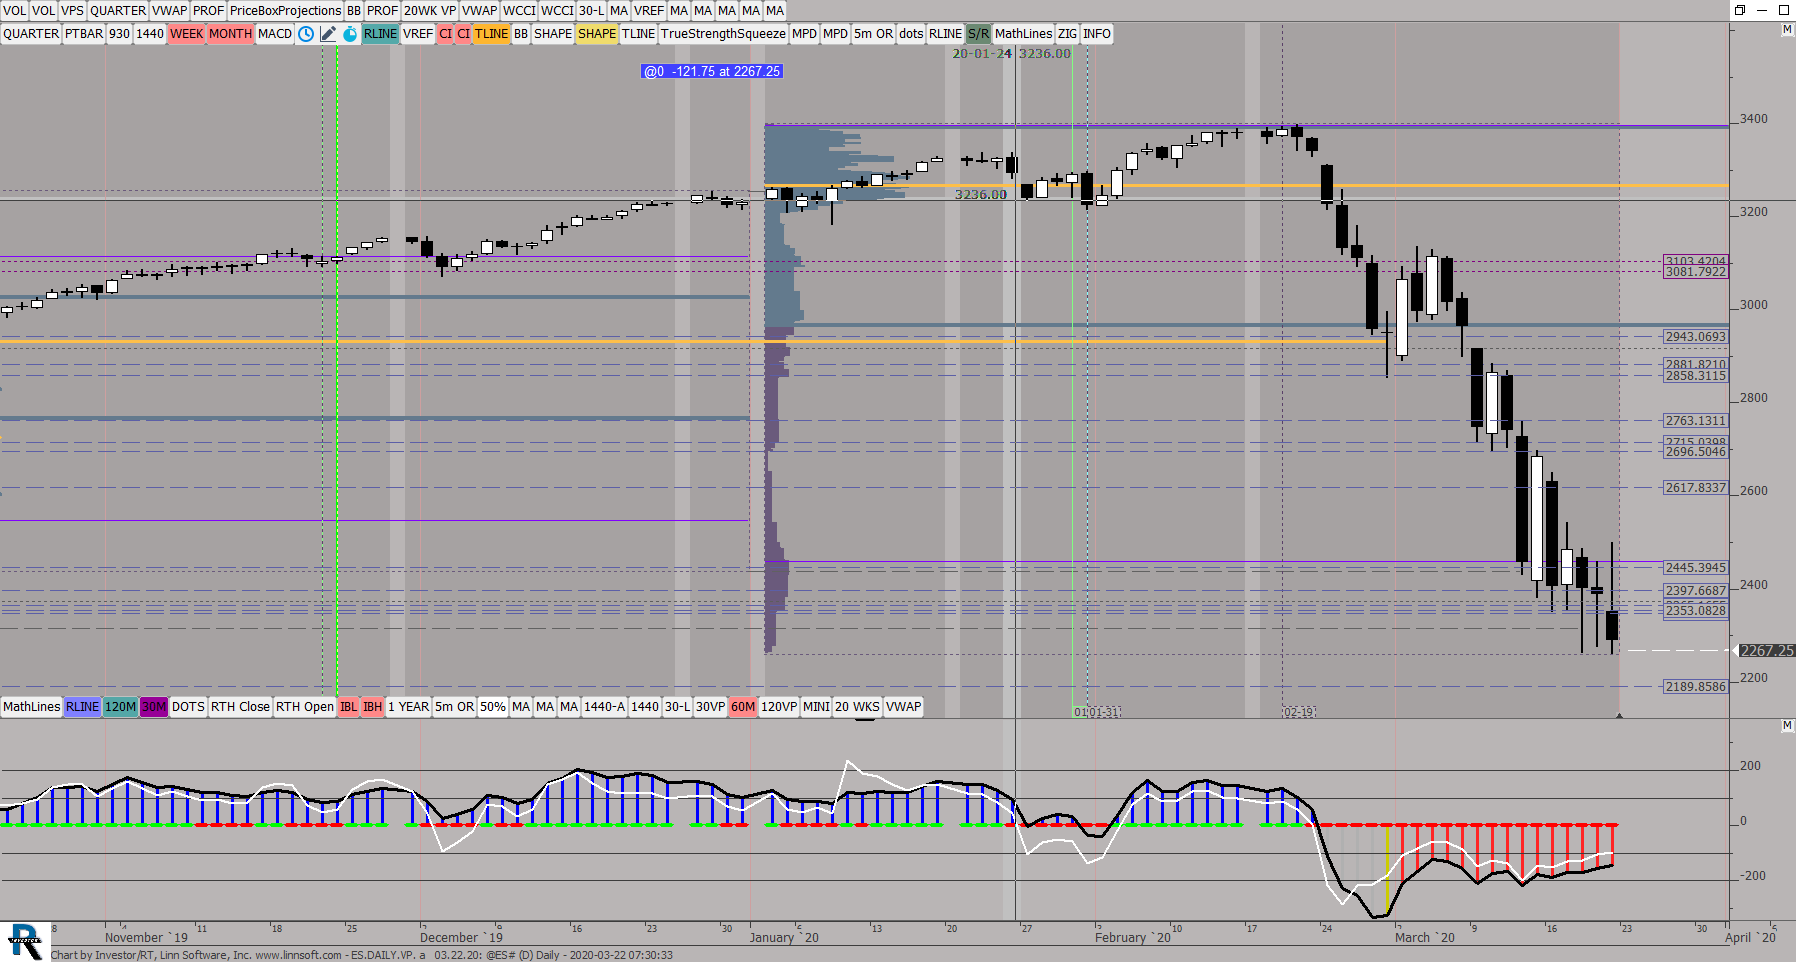 |
ESDAILYVP a (@ES#) ES42 [totalcount]
6 years 4 months ago
This chart was uploaded by Investor/RT 13.6.15 showing symbol: @ES#. |
View |
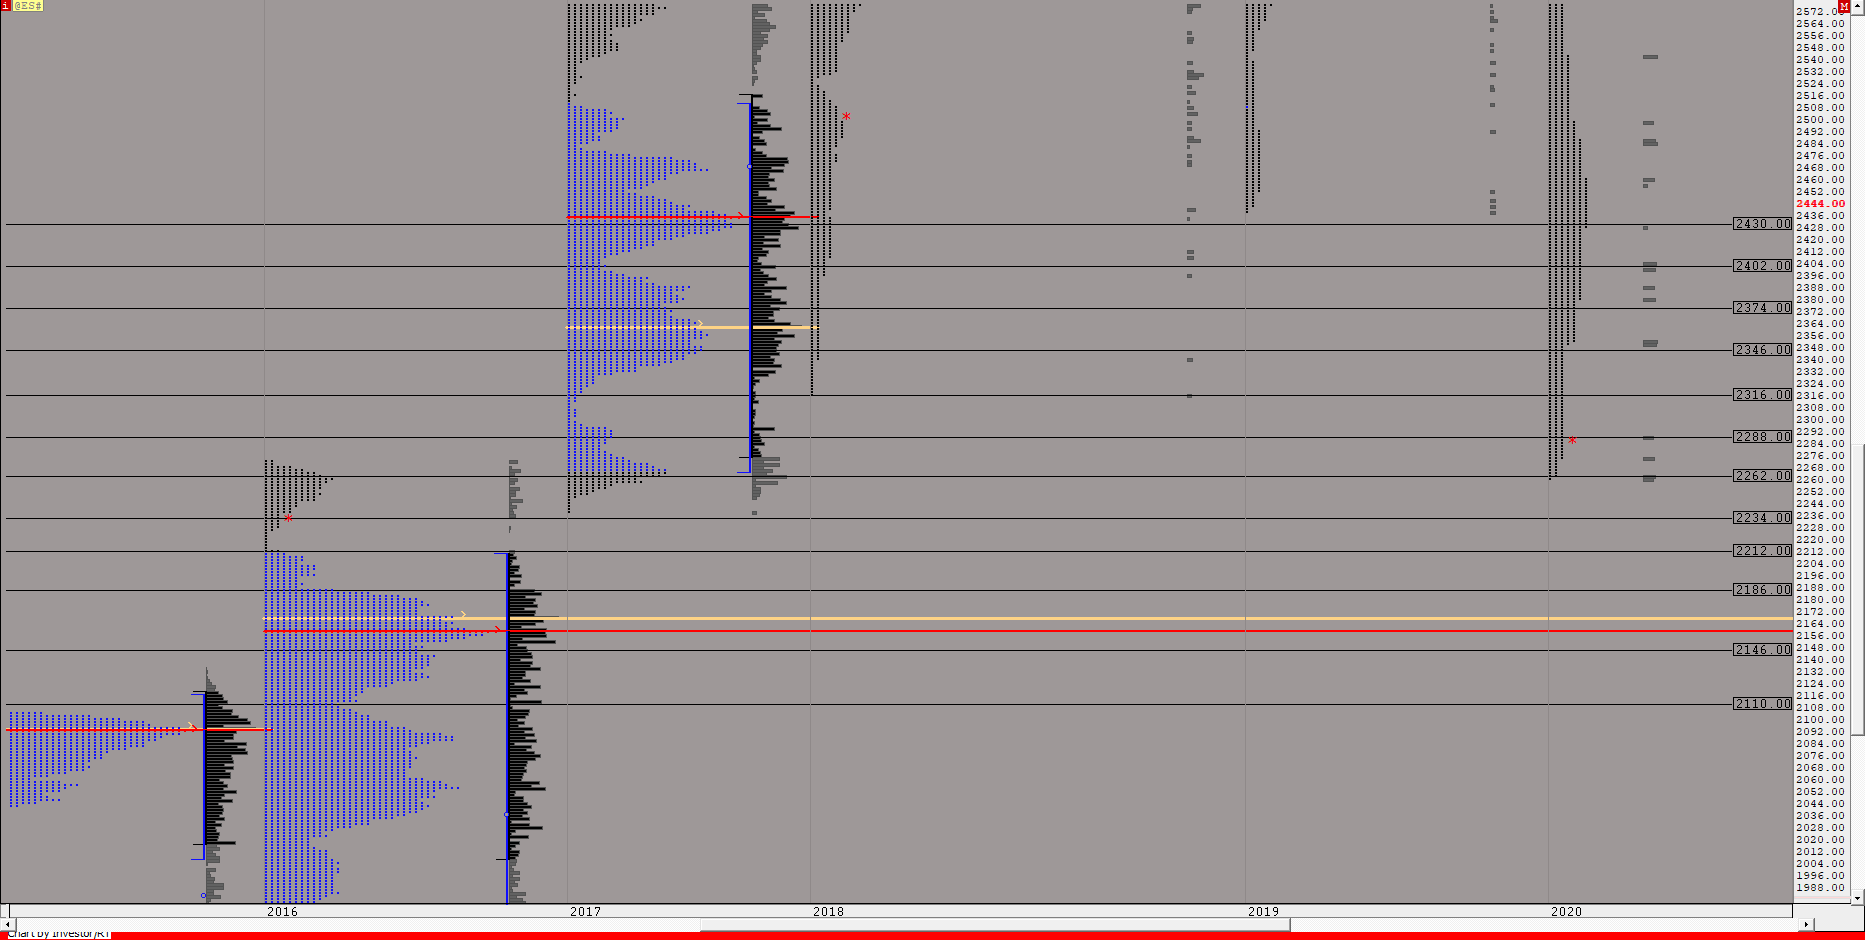 |
YEARLY TPO CHART (@ES#) ES42 [totalcount]
6 years 4 months ago
Yearly profiles. This chart was uploaded by Investor/RT 13.5.24 showing symbol: @ES#. |
View |
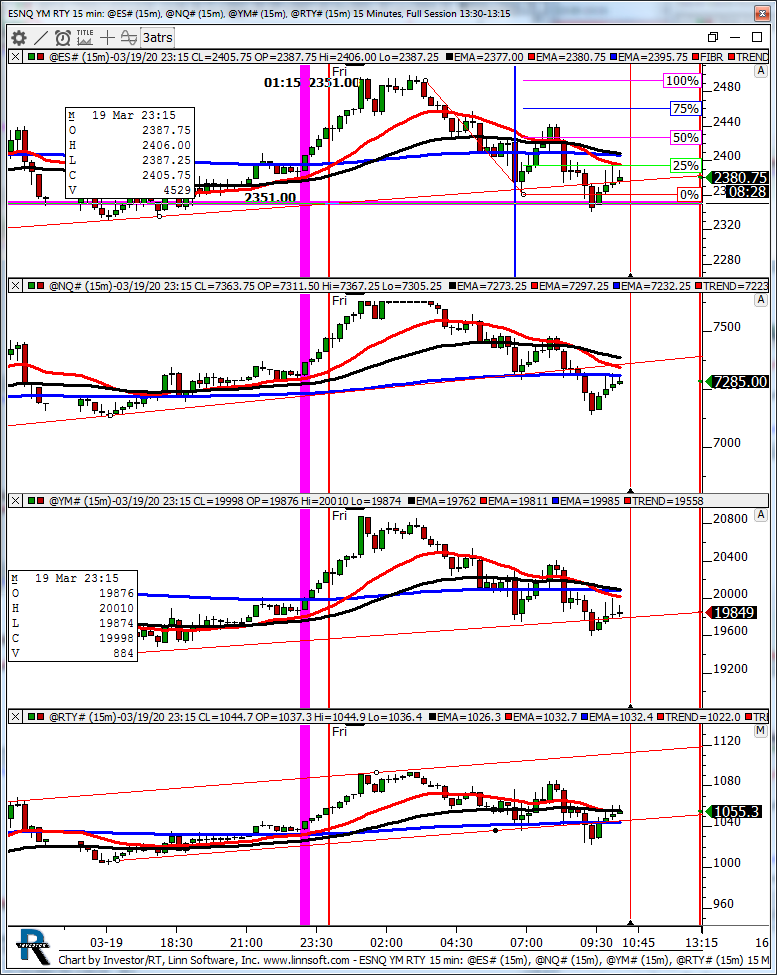 |
ESNQ YM RTY 15 min (@ES#) kencassorla [totalcount]
6 years 4 months ago
15 min indexes. This chart was uploaded by Investor/RT 13.6.15 showing symbol: @ES#. |
View |
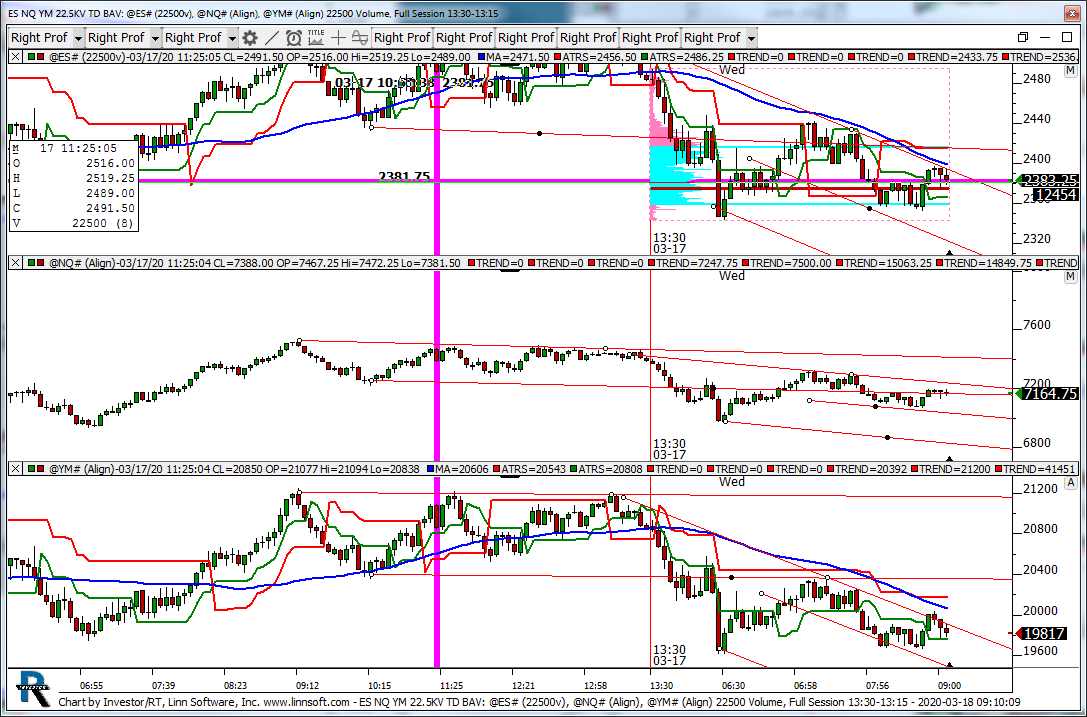 |
ES NQ YM 225KV TD BAV (@ES#) kencassorla [totalcount]
6 years 4 months ago
indexes. This chart was uploaded by Investor/RT 13.6.3 showing symbol: @ES#. |
View |
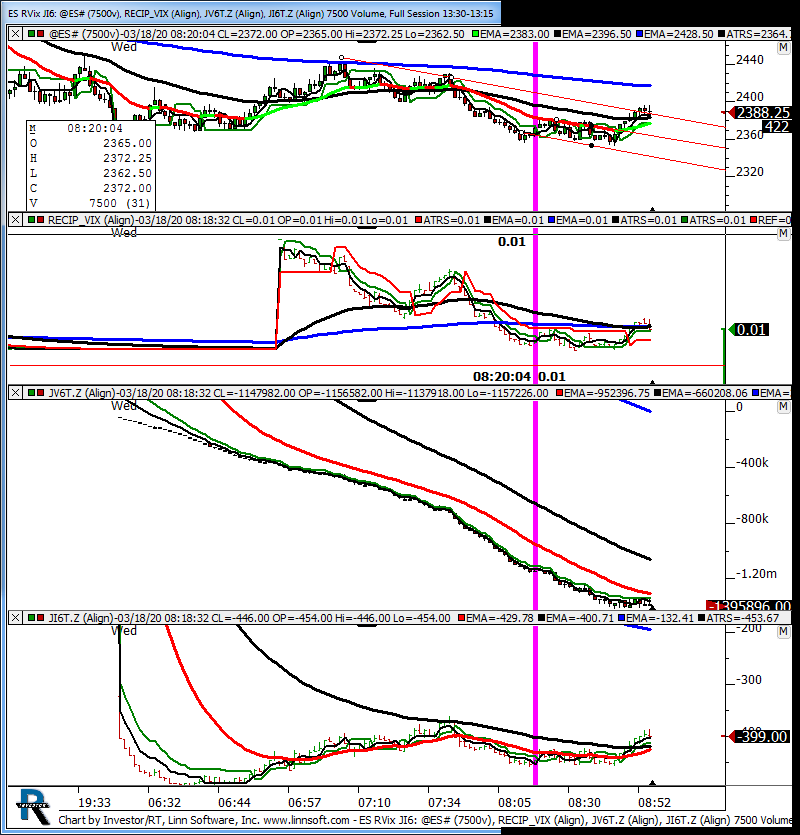 |
ES RVix JI6 (@ES#) kencassorla [totalcount]
6 years 4 months ago
200 ema. This chart was uploaded by Investor/RT 13.6.15 showing symbol: @ES#. |
View |
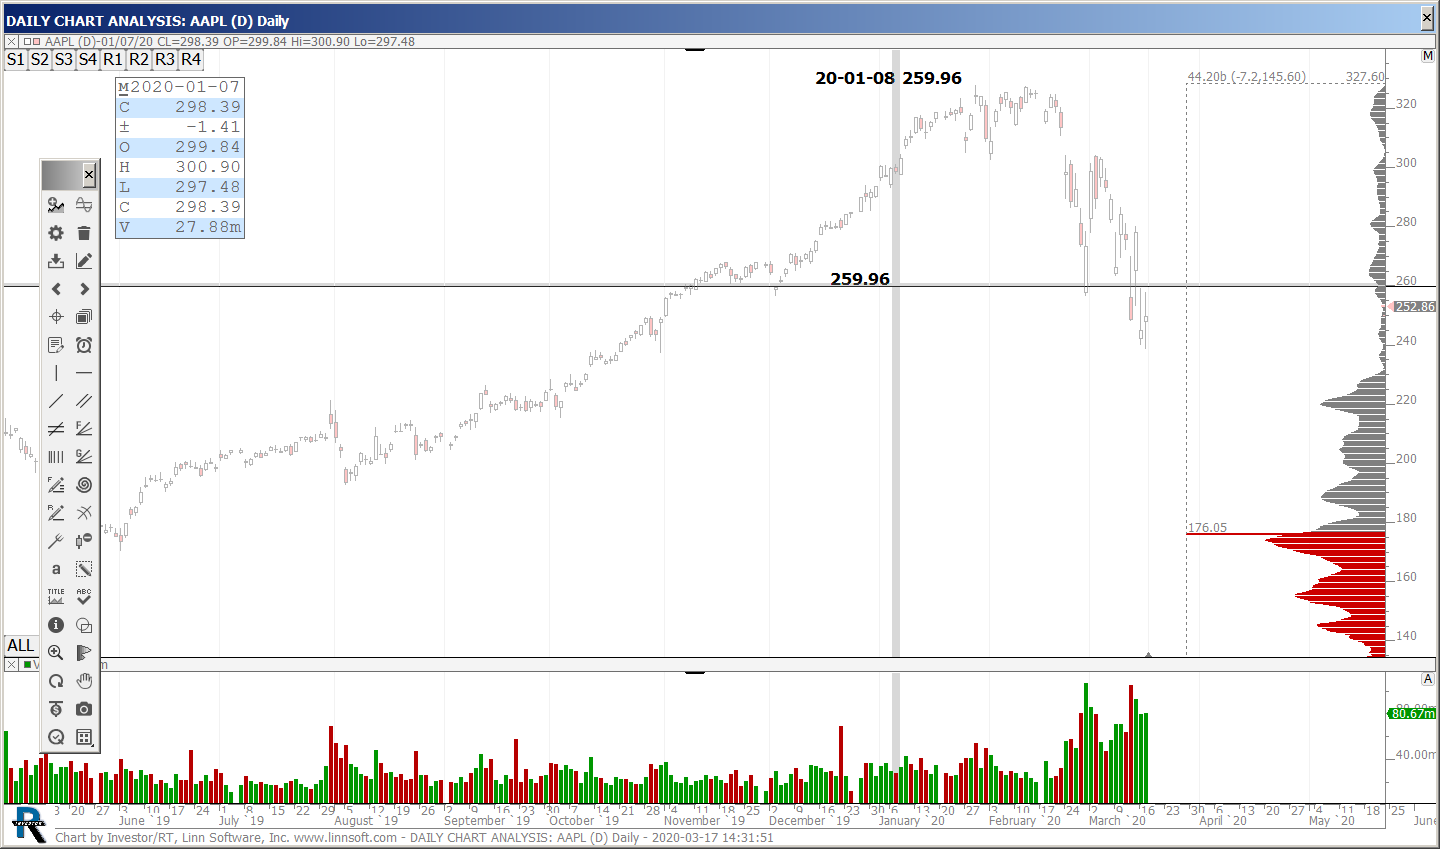 |
DAILY CHART ANALYSIS (AAPL) sss390 [totalcount]
6 years 4 months ago
AAPL GET IN WHEN HIT 239'S . sELL 232 BUY PUT 228. This chart was uploaded by Investor/RT 13.6.15 showing symbol: AAPL. |
View |
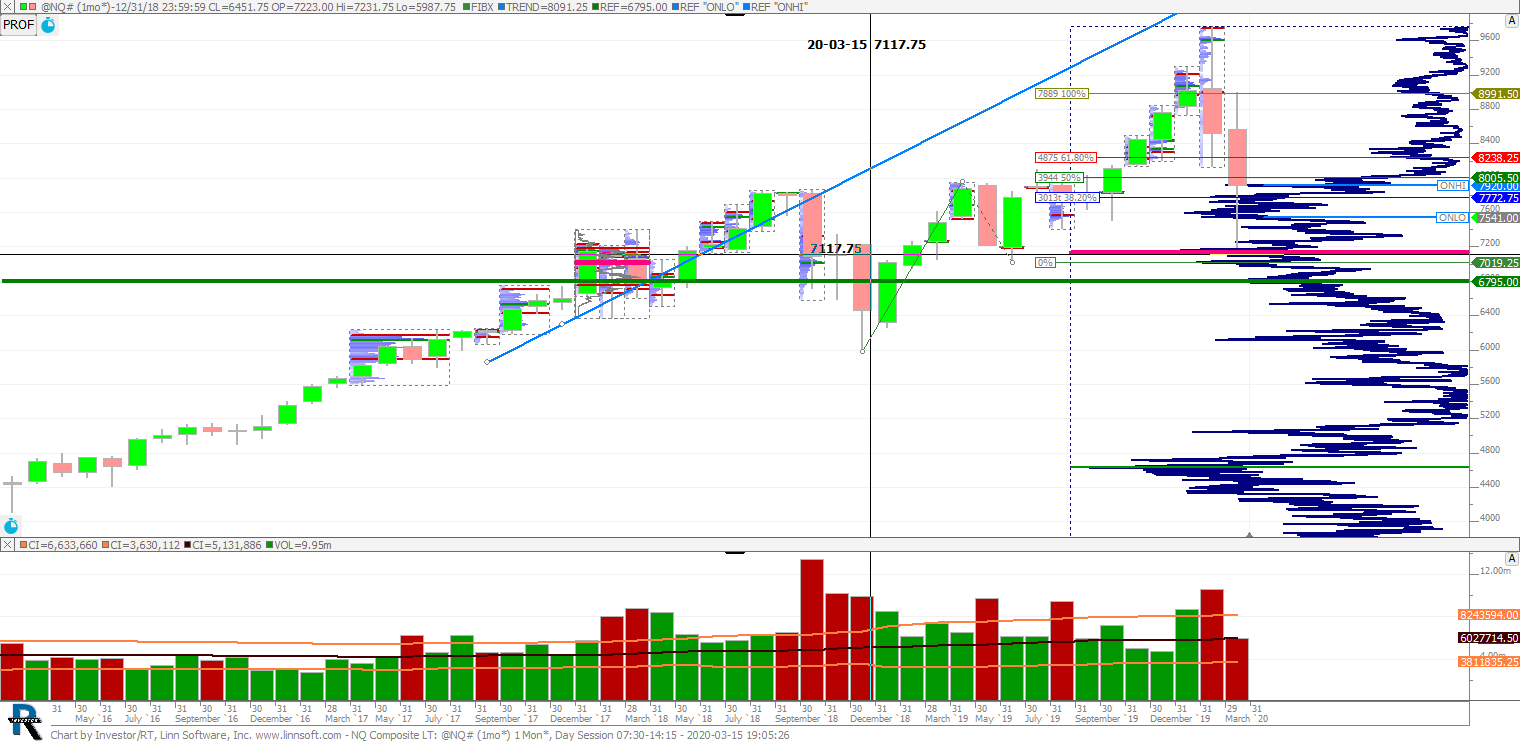 |
NQ Composite LT (@NQ#) rjorintas [totalcount]
6 years 4 months ago
This chart was uploaded by Investor/RT 13.6.15 showing symbol: @NQ#. |
View |
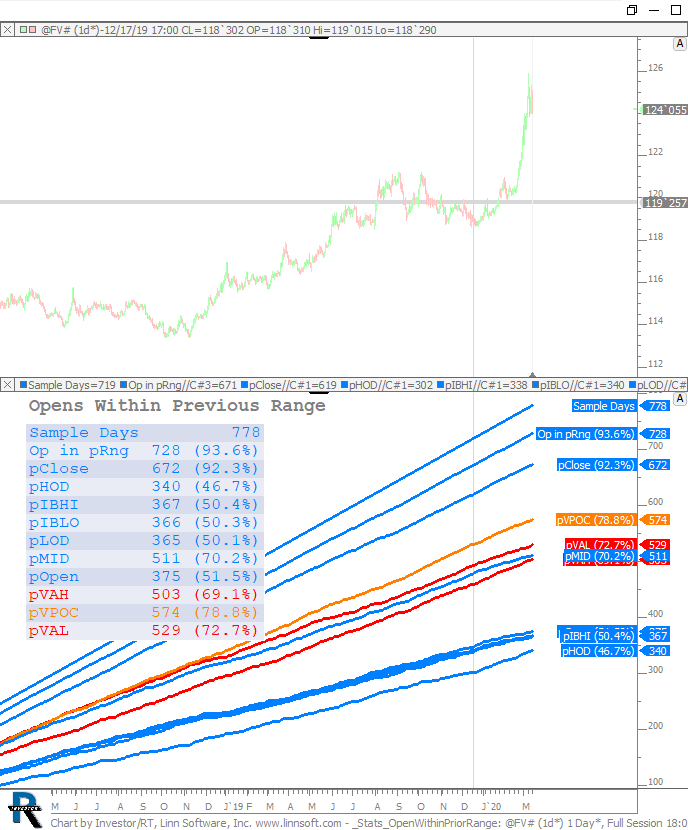 |
Stats OpenWithinPriorRange (@FV#) egpaulson [totalcount]
6 years 4 months ago
This chart was uploaded by Investor/RT 13.6.15 showing symbol: @FV#. |
View |