 |
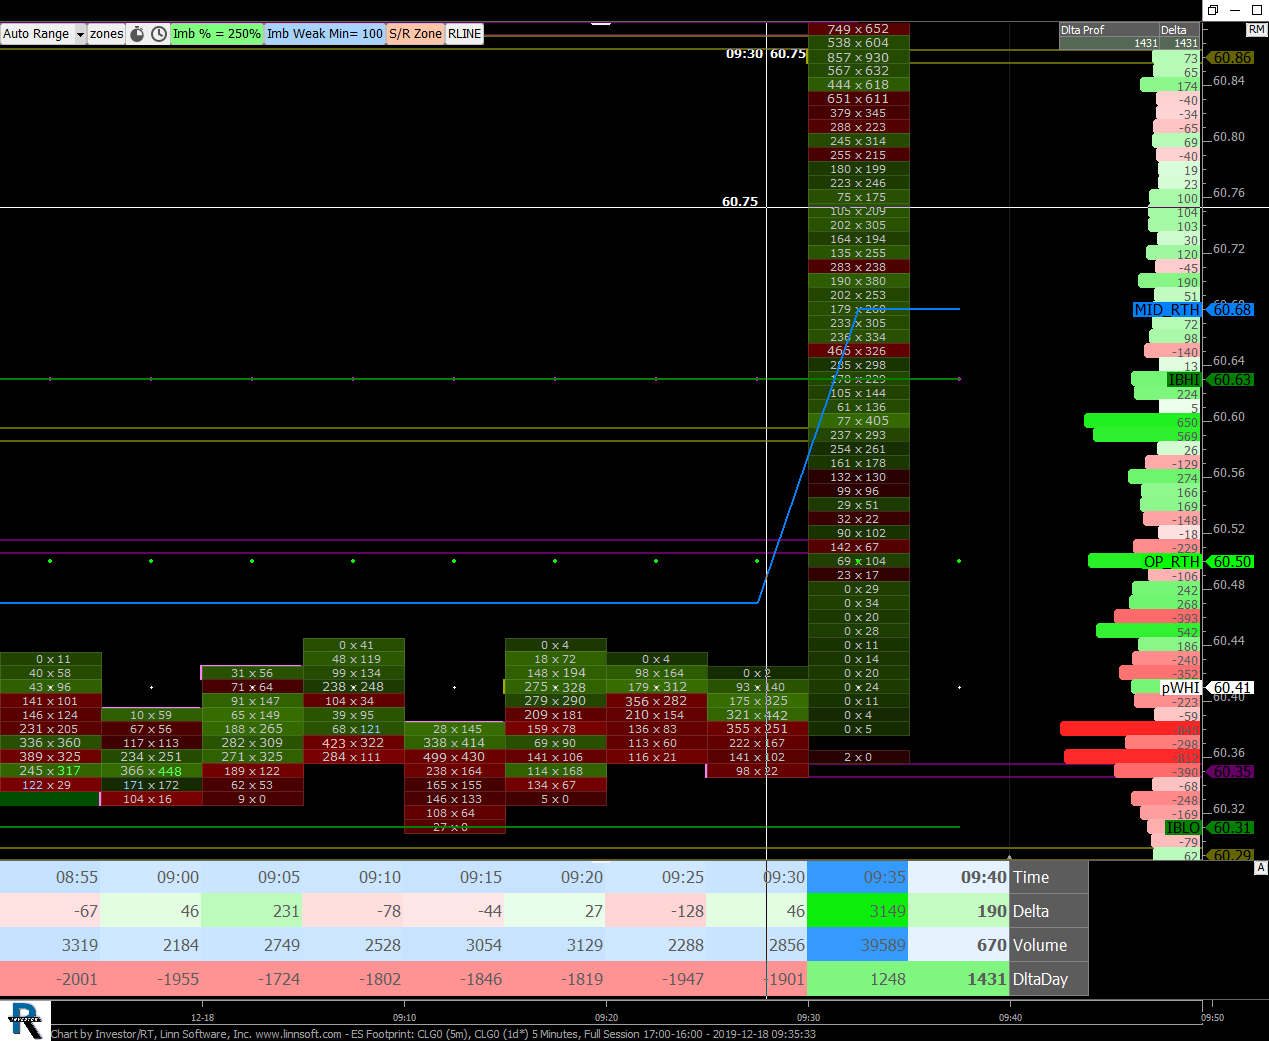
ES Footprint (CLG0) scottz46 [totalcount]
6 years 2 days ago
This chart was uploaded by Investor/RT 13.6.3 showing symbol: CLG0. |
View |
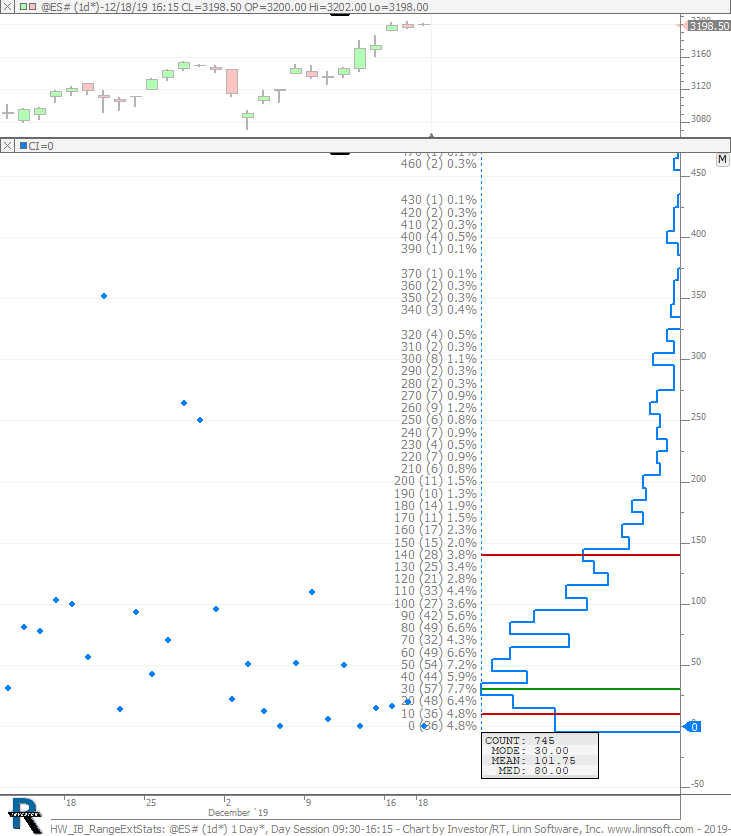 |
HW IB RangeExtStats (@ES#) cpayne [totalcount]
6 years 2 days ago
Initial Balance Range Extension percentage...profiled for accumulation and statistics. 30 (POC) represents 30 to 40% with 57 of 745 days having such a range extension. |
View |
 |
Monthly TPOINDEXES (@ES#) ES42 [totalcount]
6 years 6 days ago
Monthly TPO Profiles-4 hour candles. This chart was uploaded by Investor/RT 13.6.3 showing symbol: @ES#. |
View |
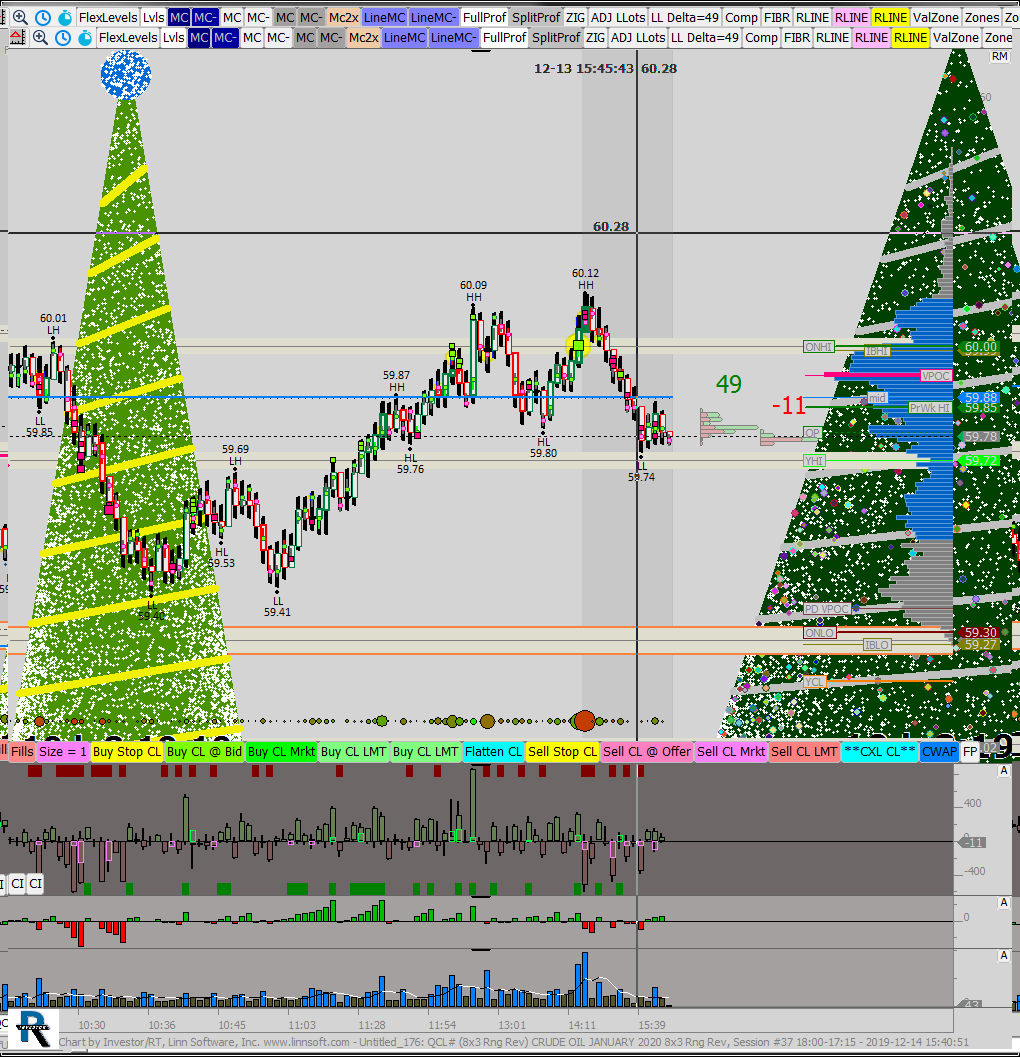 |
Untitled (QCL#) jayski51369 [totalcount]
6 years 6 days ago
This chart was uploaded by Investor/RT 12.5.9 showing symbol: QCL#. |
View |
 |
MP ES MONTHLY (@ES#) ES42 [totalcount]
6 years 6 days ago
Monthly Profiles, 240 Min Candles. This chart was uploaded by Investor/RT 13.6.3 showing symbol: @ES#. |
View |
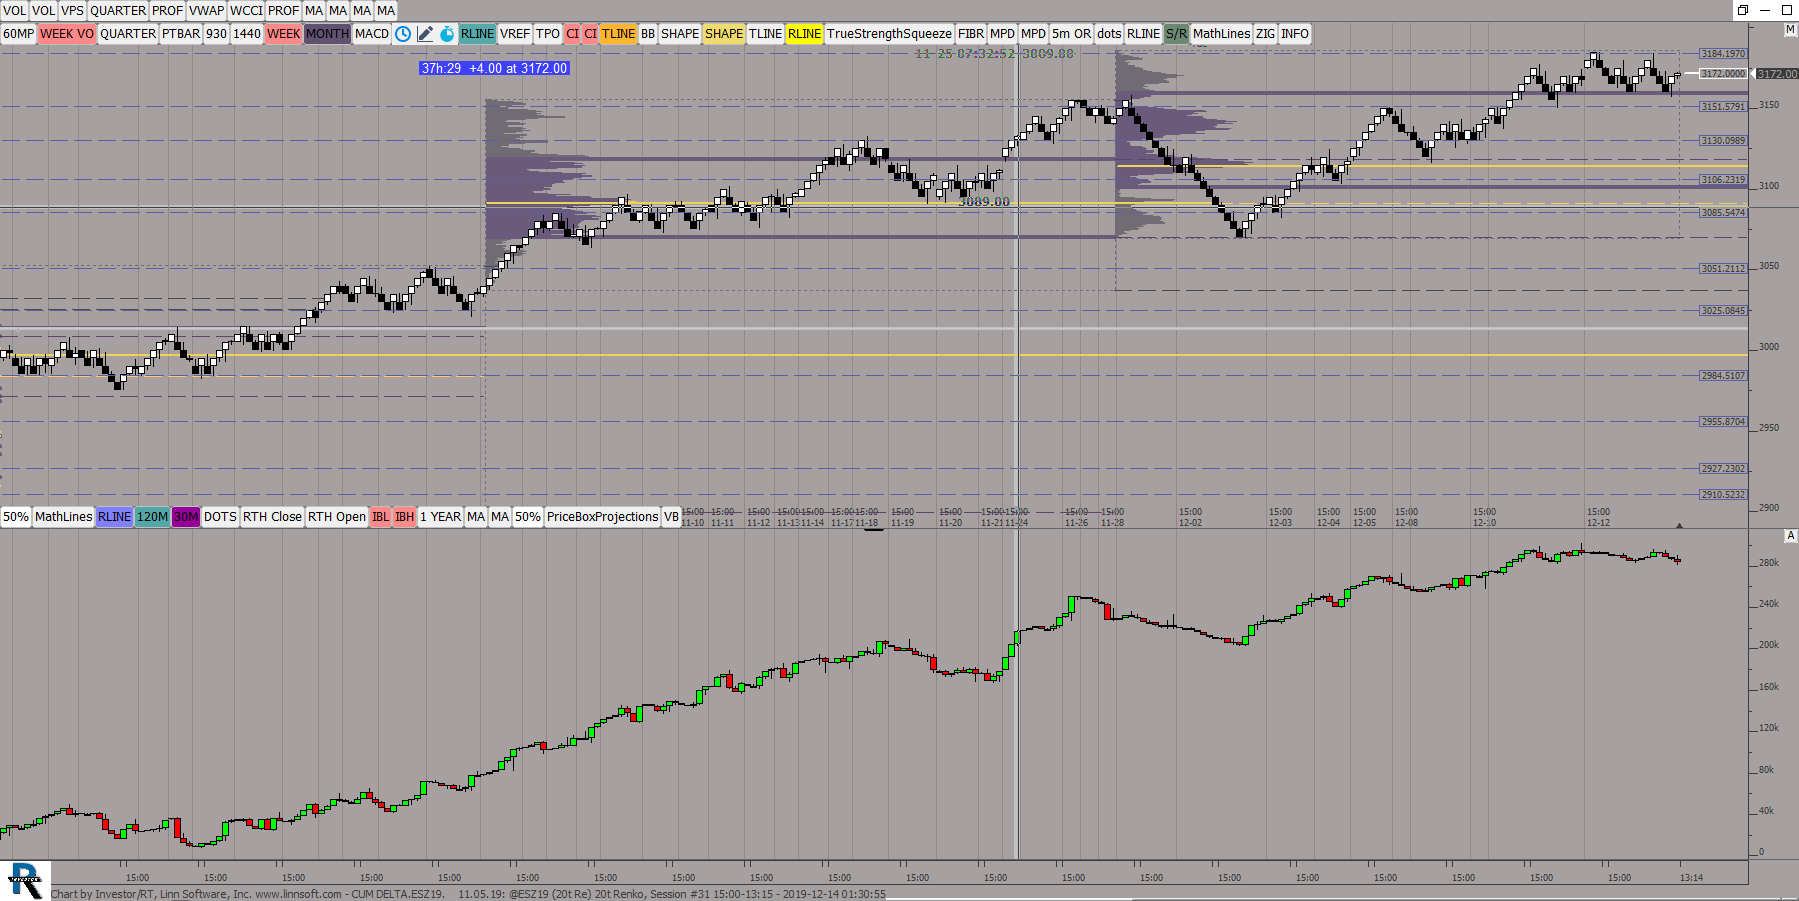 |
CUM DELTAESZ19 (@ESZ19) ES42 [totalcount]
6 years 6 days ago
This chart was uploaded by Investor/RT 13.6.3 showing symbol: @ESZ19. |
View |
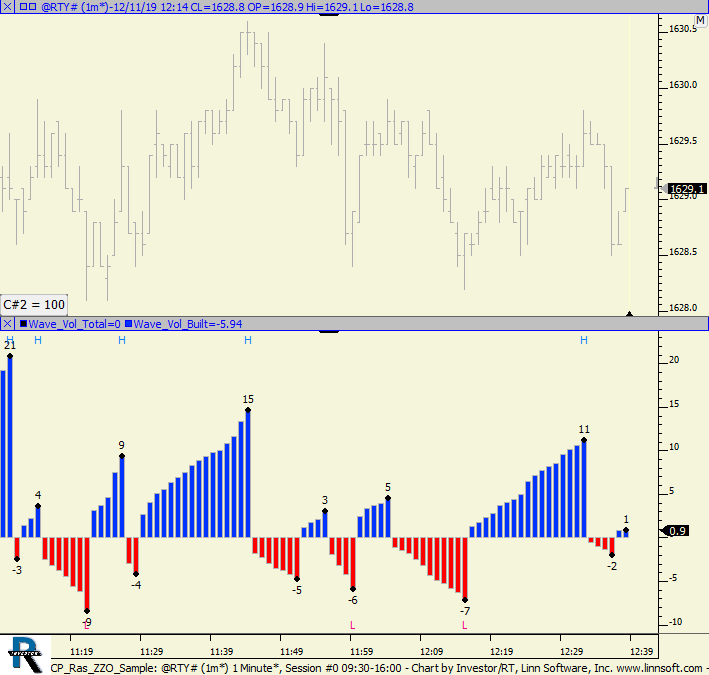 |
CP Ras ZZO Sample (@RTY#) cpayne [totalcount]
6 years 1 week ago
This chart was uploaded by Investor/RT 14.1.7 showing symbol: @RTY#. |
View |
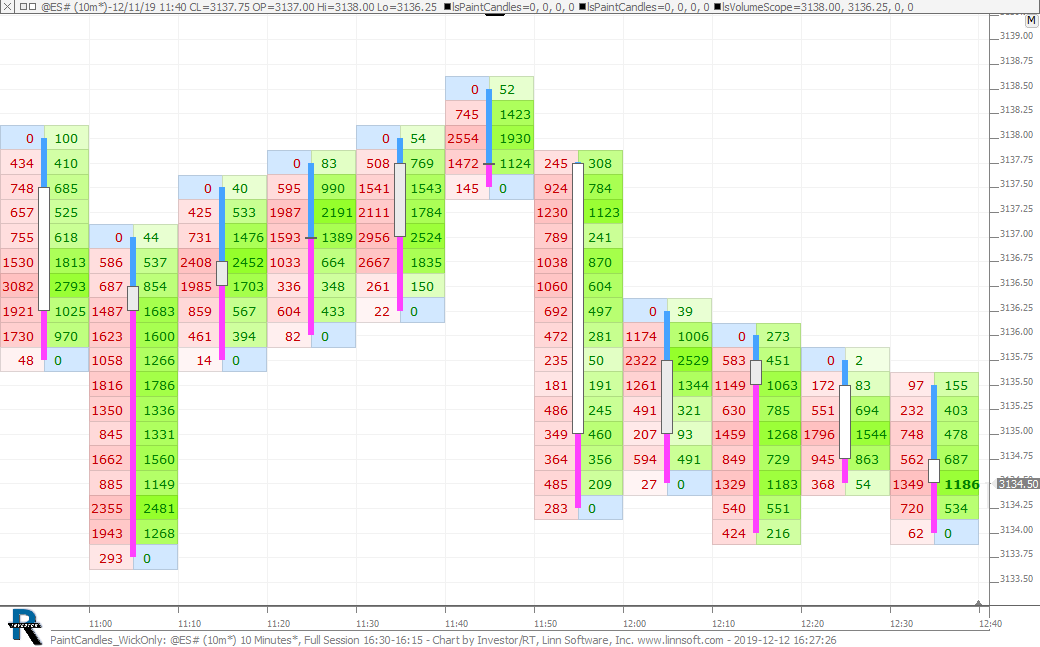 |
PaintCandles WickOnly (@ES#) cpayne [totalcount]
6 years 1 week ago
PaintCandles painting upper and lower wick different color and centered on top of VolumeScope. This chart was uploaded by Investor/RT 14.1.7 showing symbol: @ES#. |
View |
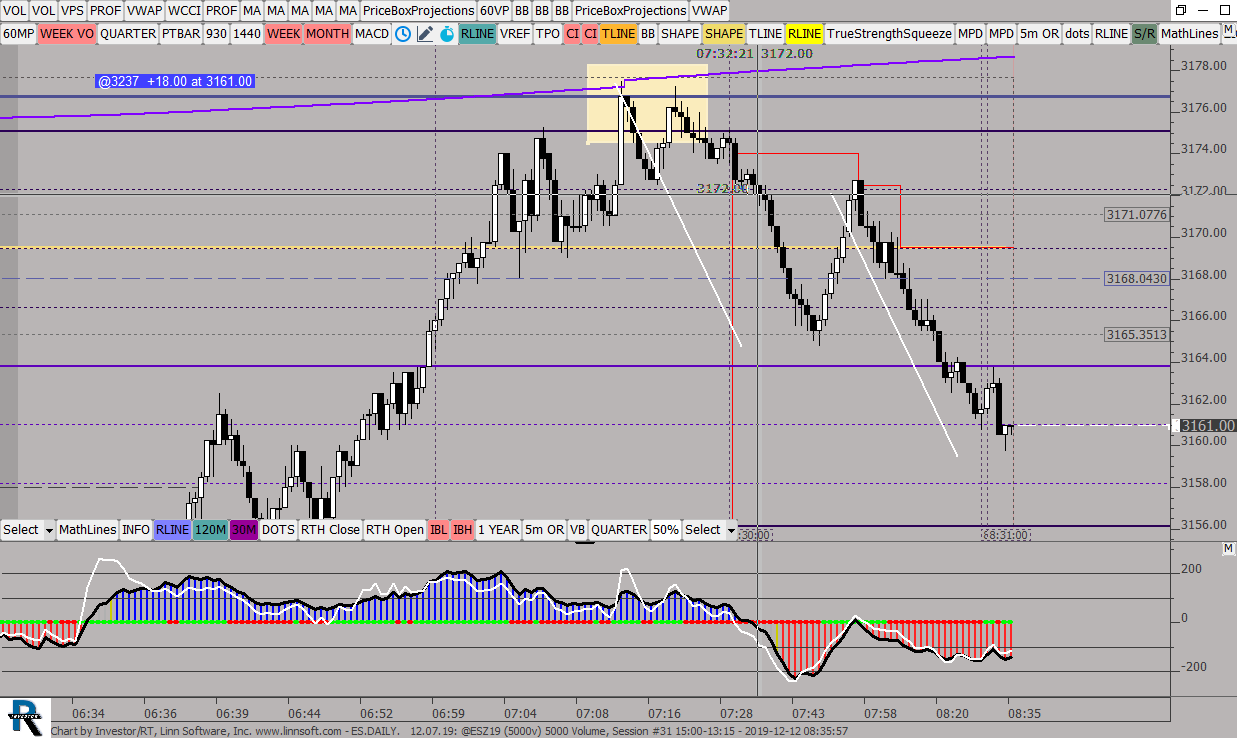 |
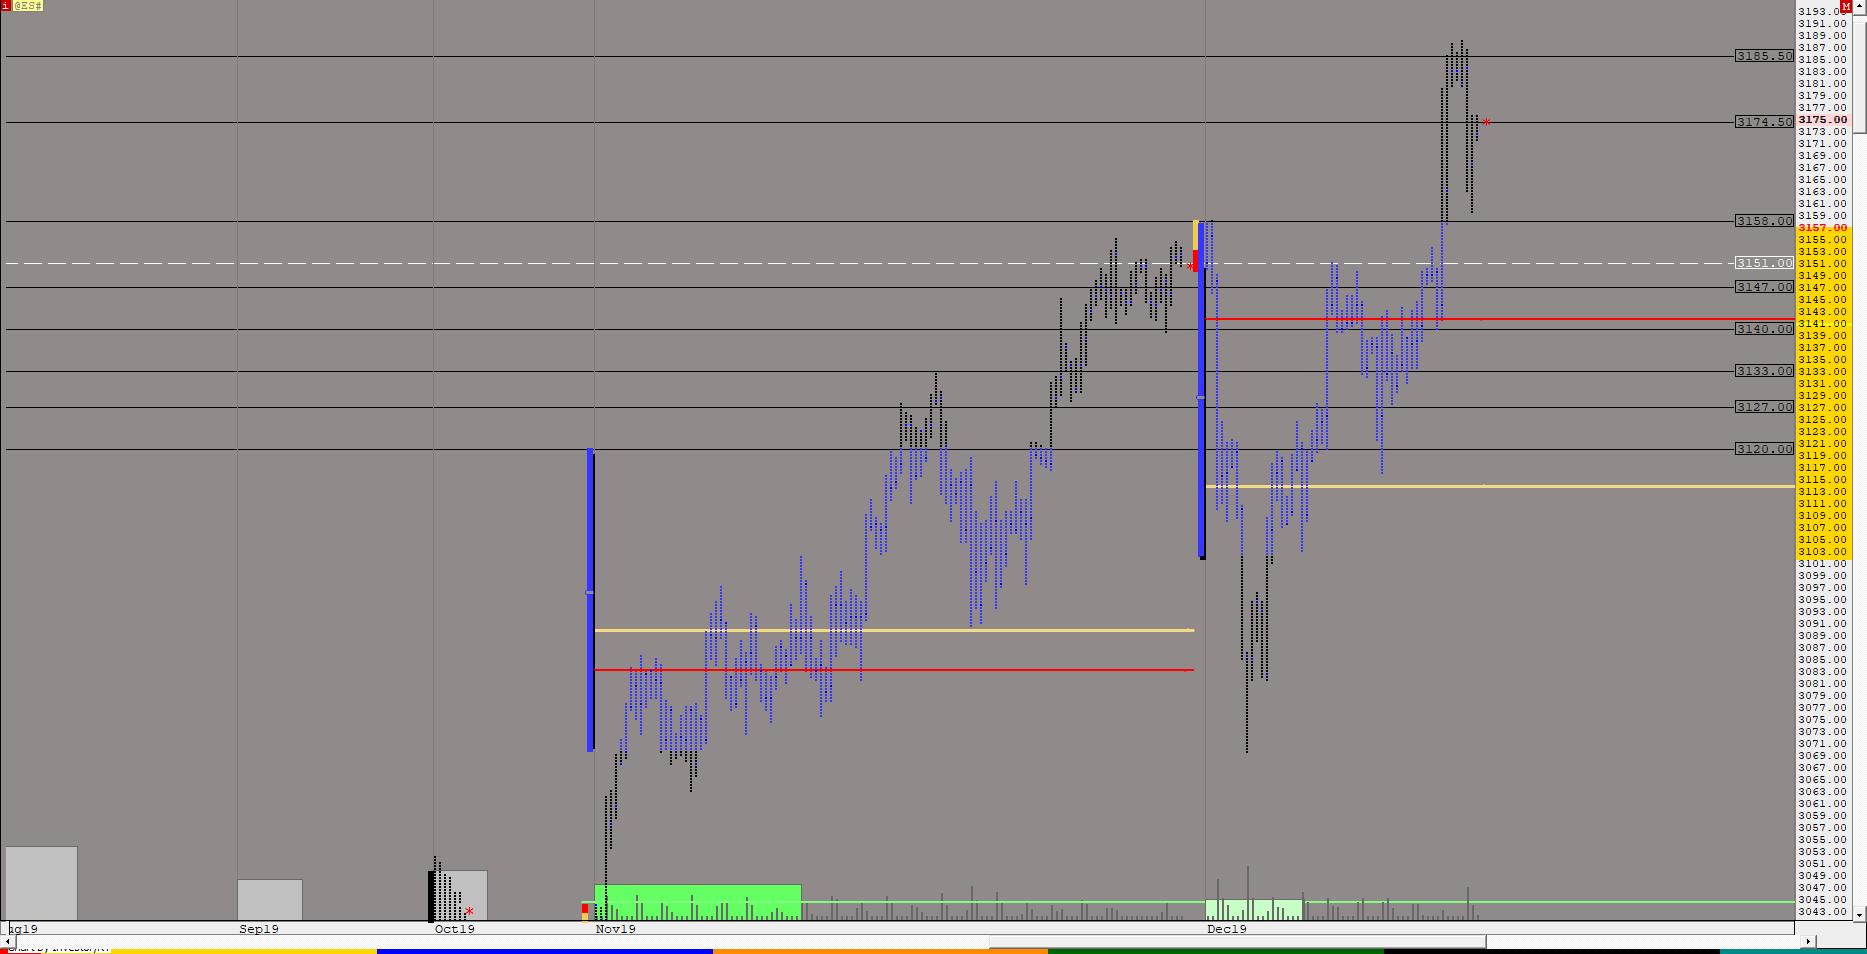
ESDAILY (@ESZ19) ES42 [totalcount]
6 years 1 week ago
This chart was uploaded by Investor/RT 13.6.3 showing symbol: @ESZ19. |
View |
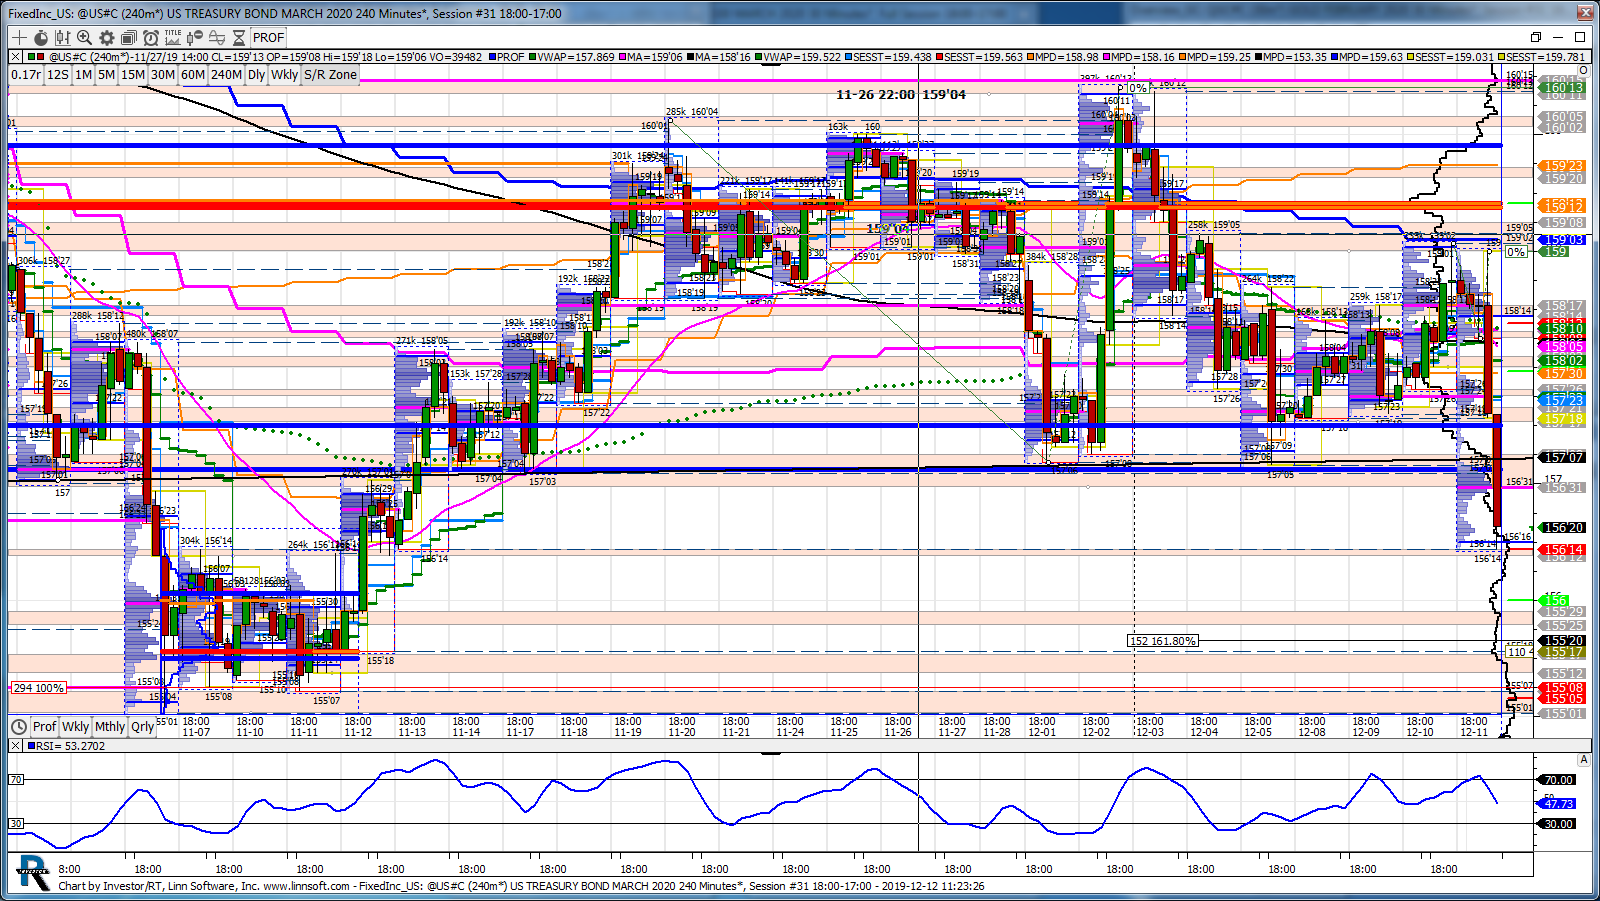 |
FixedInc US (@US#C) npettinato [totalcount]
6 years 1 week ago
This chart was uploaded by Investor/RT 13.5.24 showing symbol: @US#C. |
View |
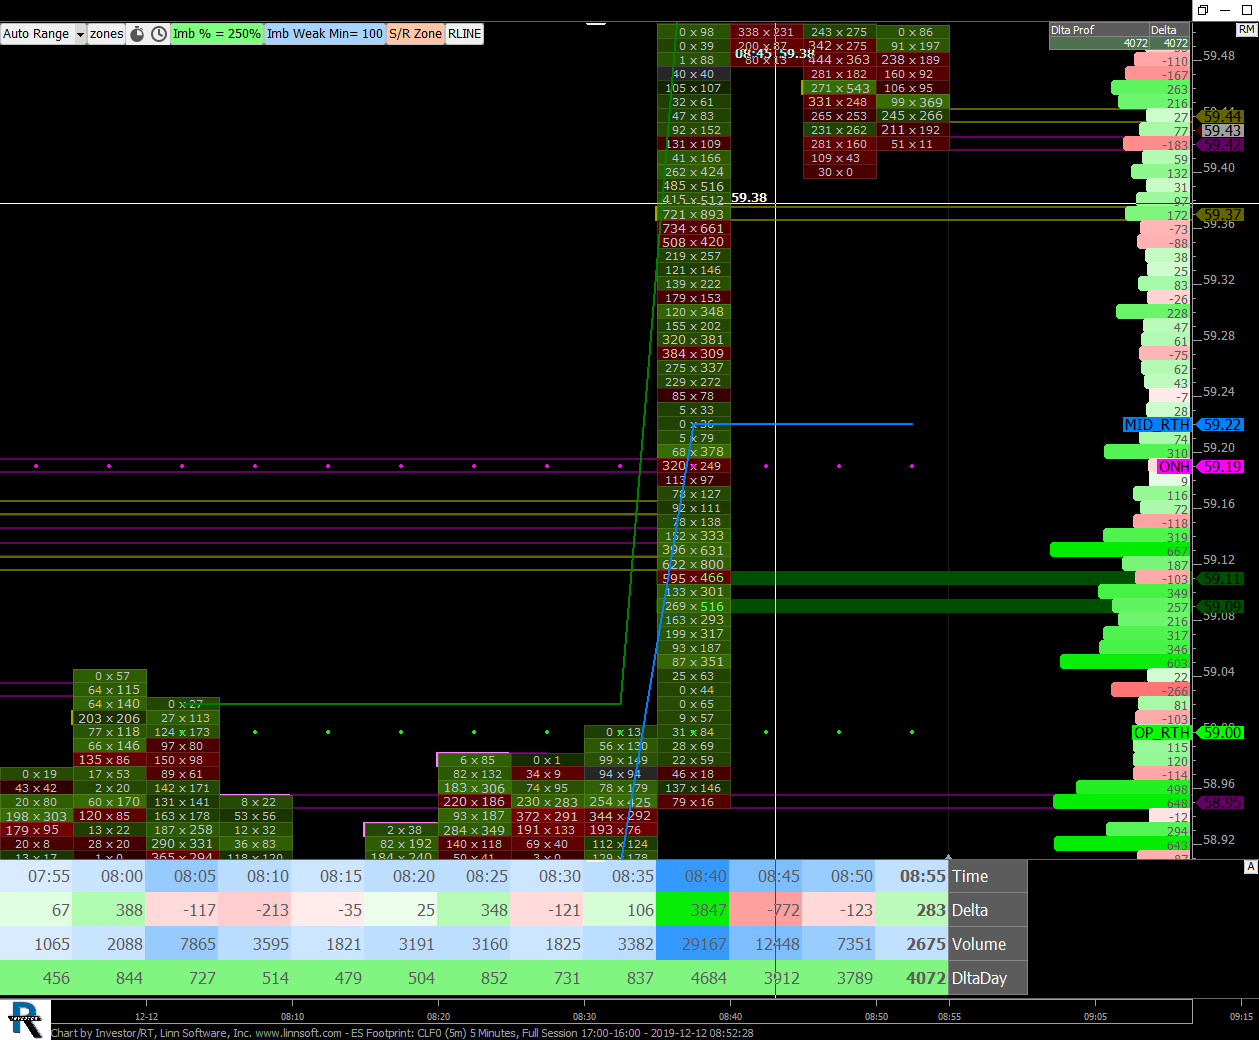 |
ES Footprint (CLF0) scottz46 [totalcount]
6 years 1 week ago
This chart was uploaded by Investor/RT 13.6.3 showing symbol: CLF0. |
View |
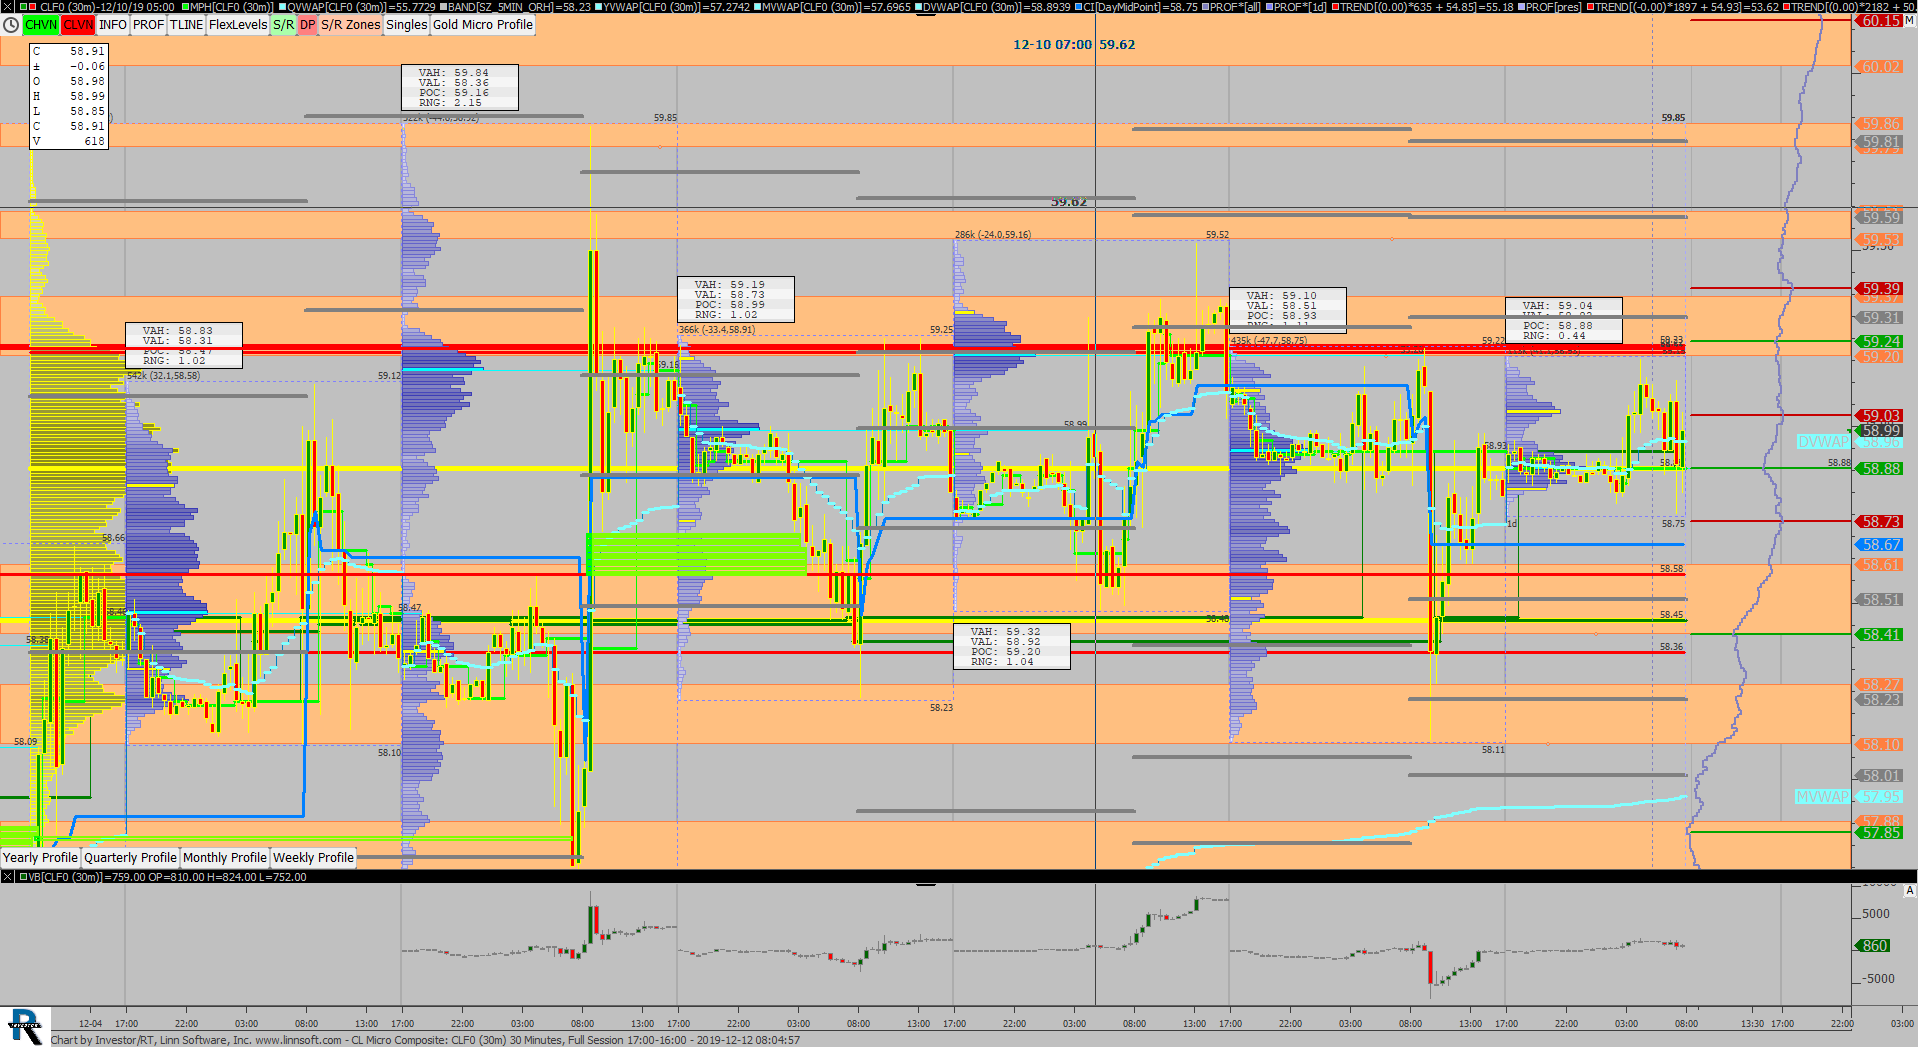 |
CL Micro Composite (CLF0) scottz46 [totalcount]
6 years 1 week ago
This chart was uploaded by Investor/RT 13.6.3 showing symbol: CLF0. |
View |
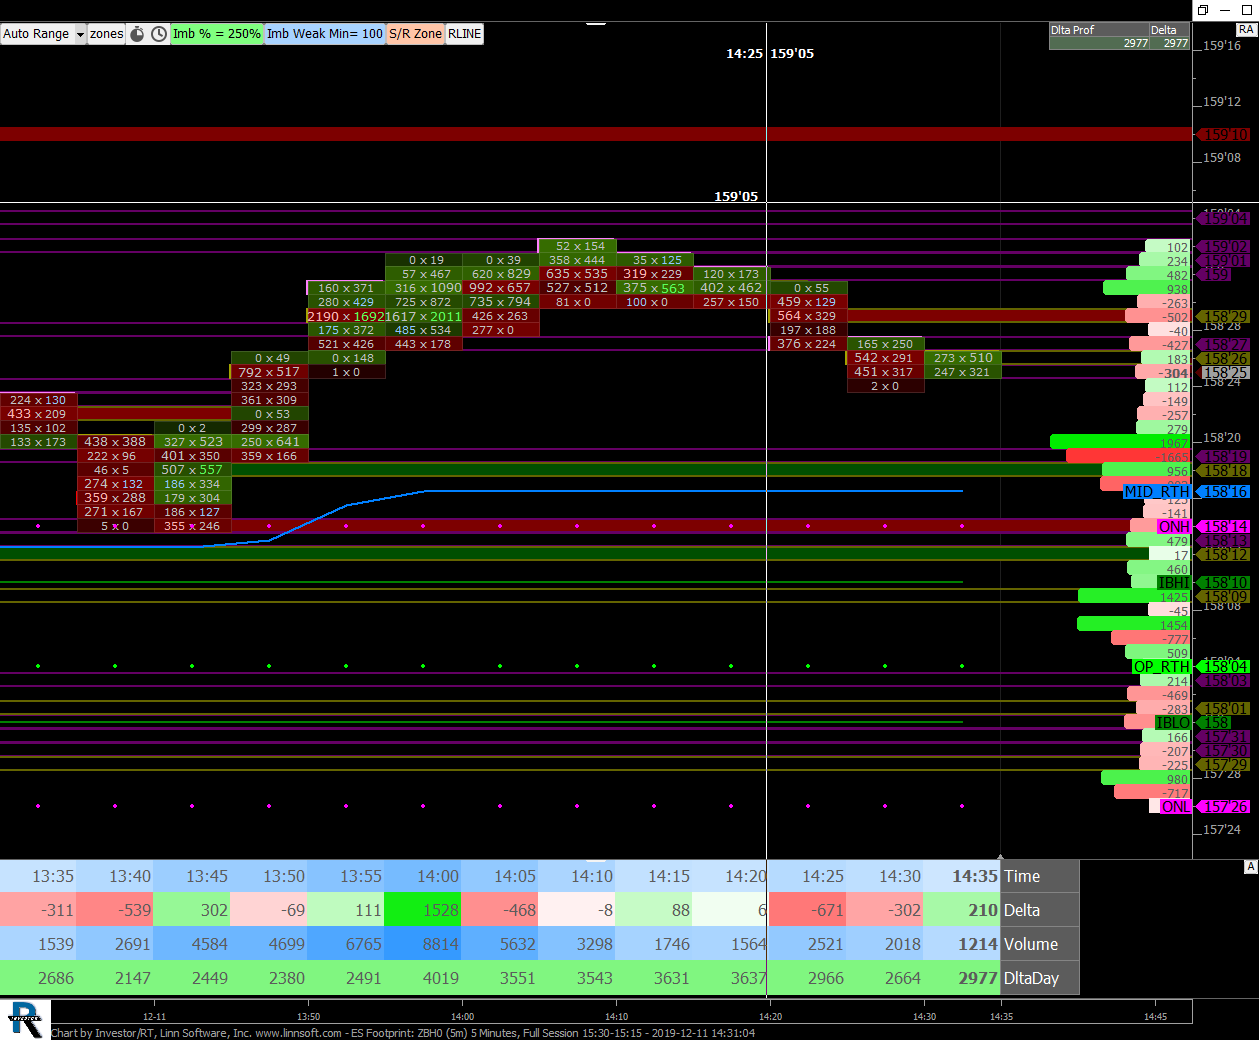 |
ES Footprint (ZBH0) scottz46 [totalcount]
6 years 1 week ago
This chart was uploaded by Investor/RT 13.6.3 showing symbol: ZBH0. |
View |
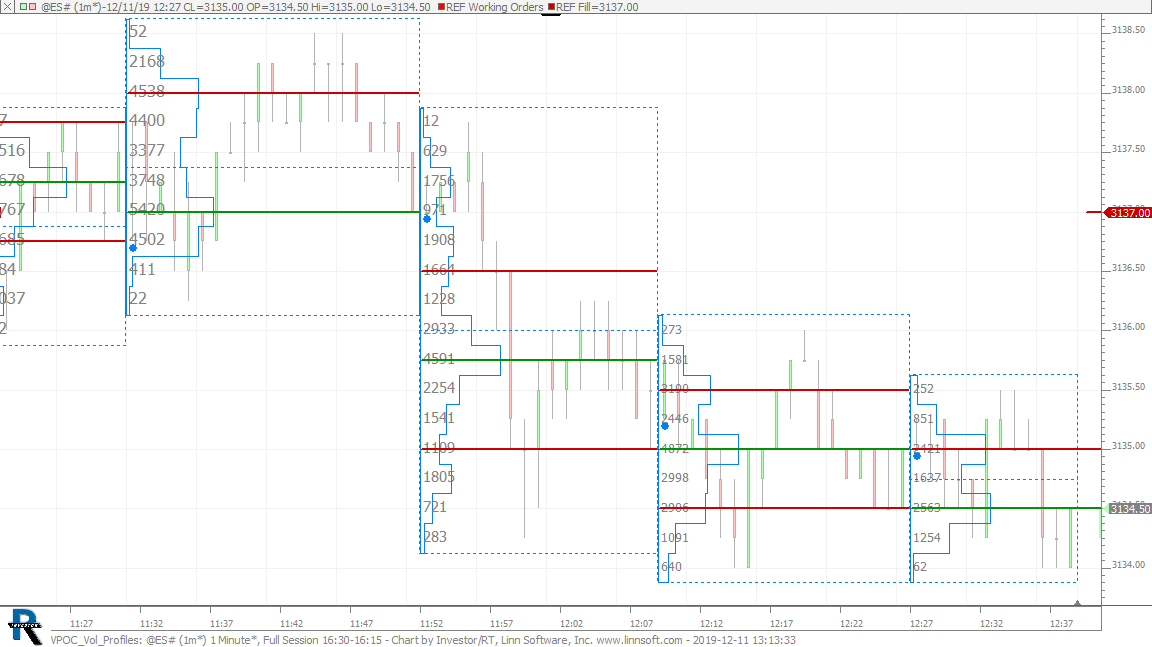 |
VPOC Vol Profiles (@ES#) cpayne [totalcount]
6 years 1 week ago
VPOC Volume Profiles. This chart was uploaded by Investor/RT 14.1.6 showing symbol: @ES#. |
View |
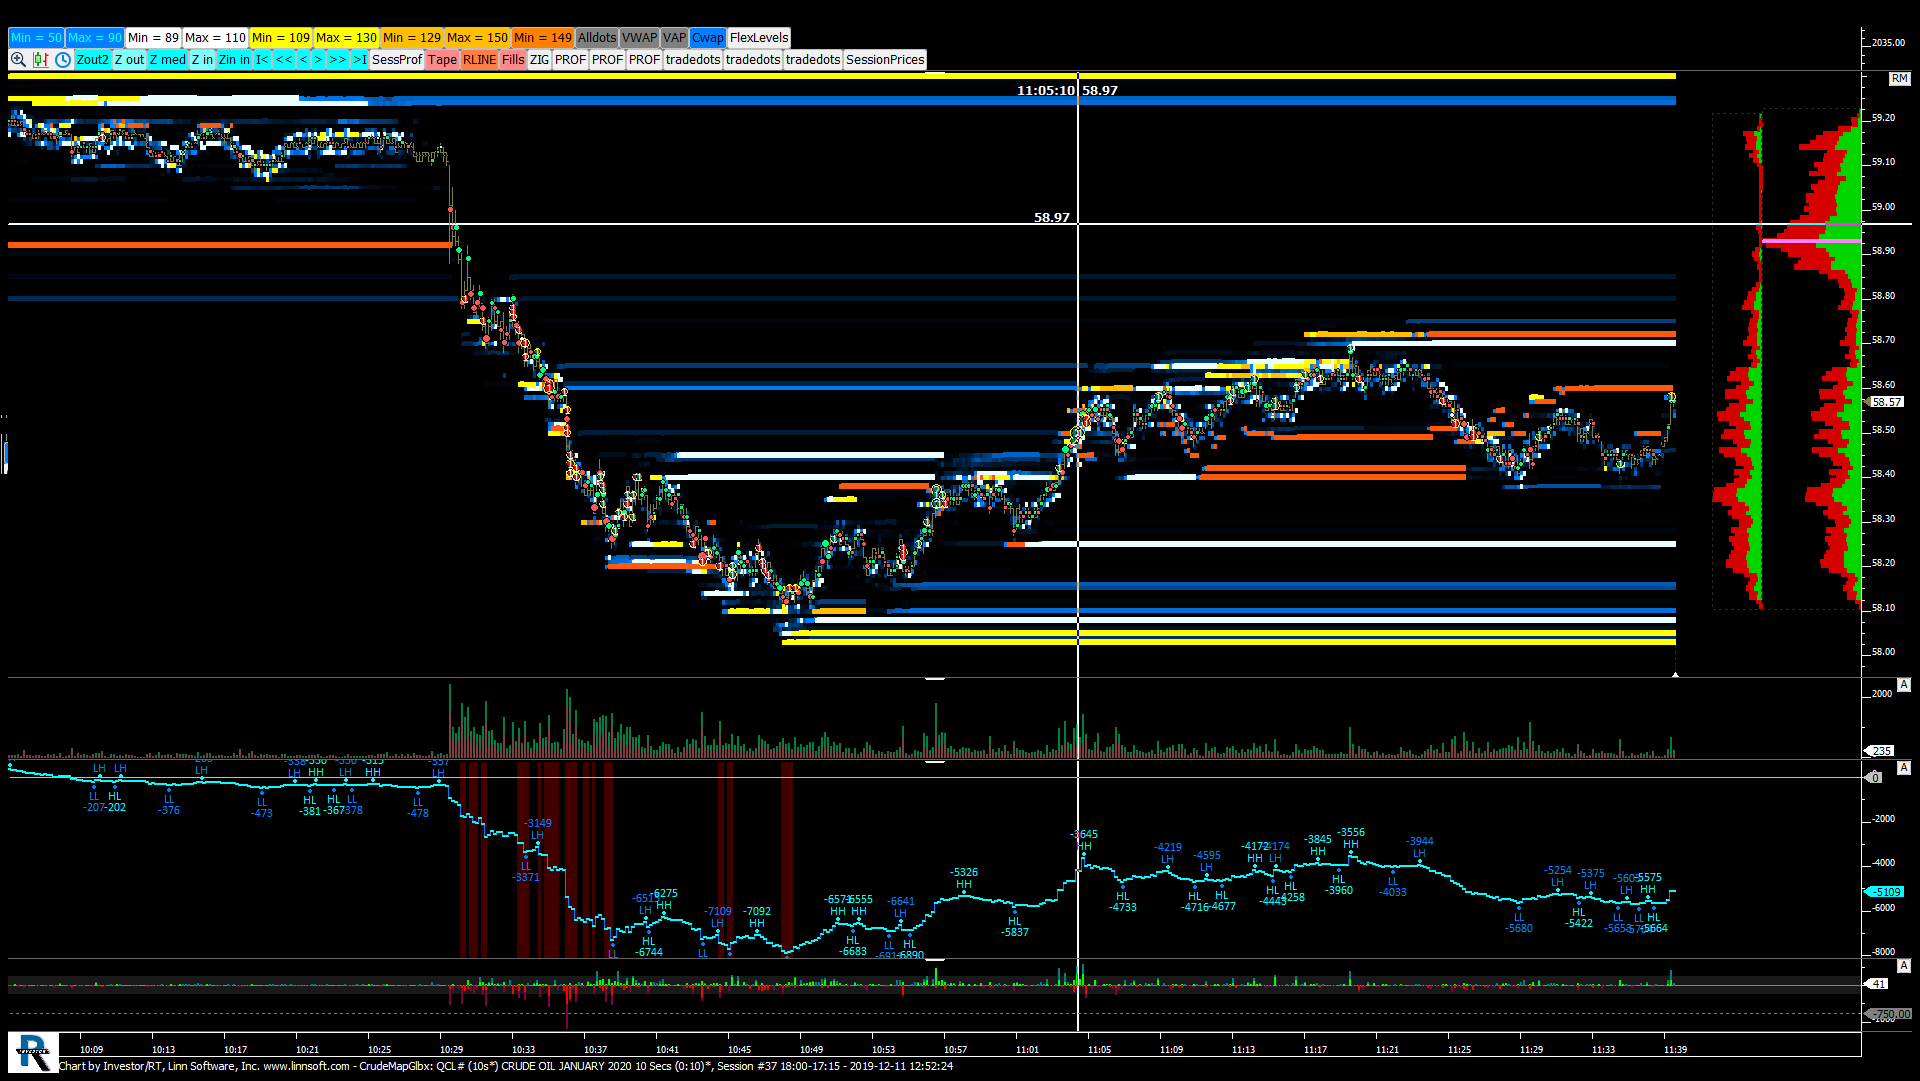 |
CrudeMapGlbx (QCL#) jayski51369 [totalcount]
6 years 1 week ago
This chart was uploaded by Investor/RT 13.6.11 showing symbol: QCL#. |
View |
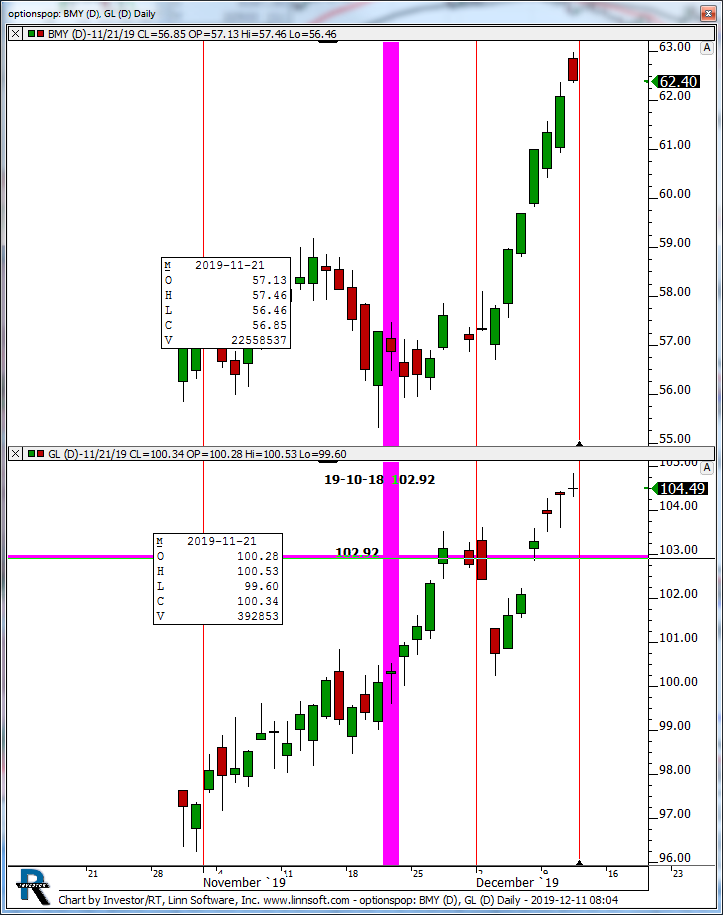 |
optionspop (BMY) kencassorla [totalcount]
6 years 1 week ago
optionspop. This chart was uploaded by Investor/RT 13.6.3 showing symbol: BMY. |
View |
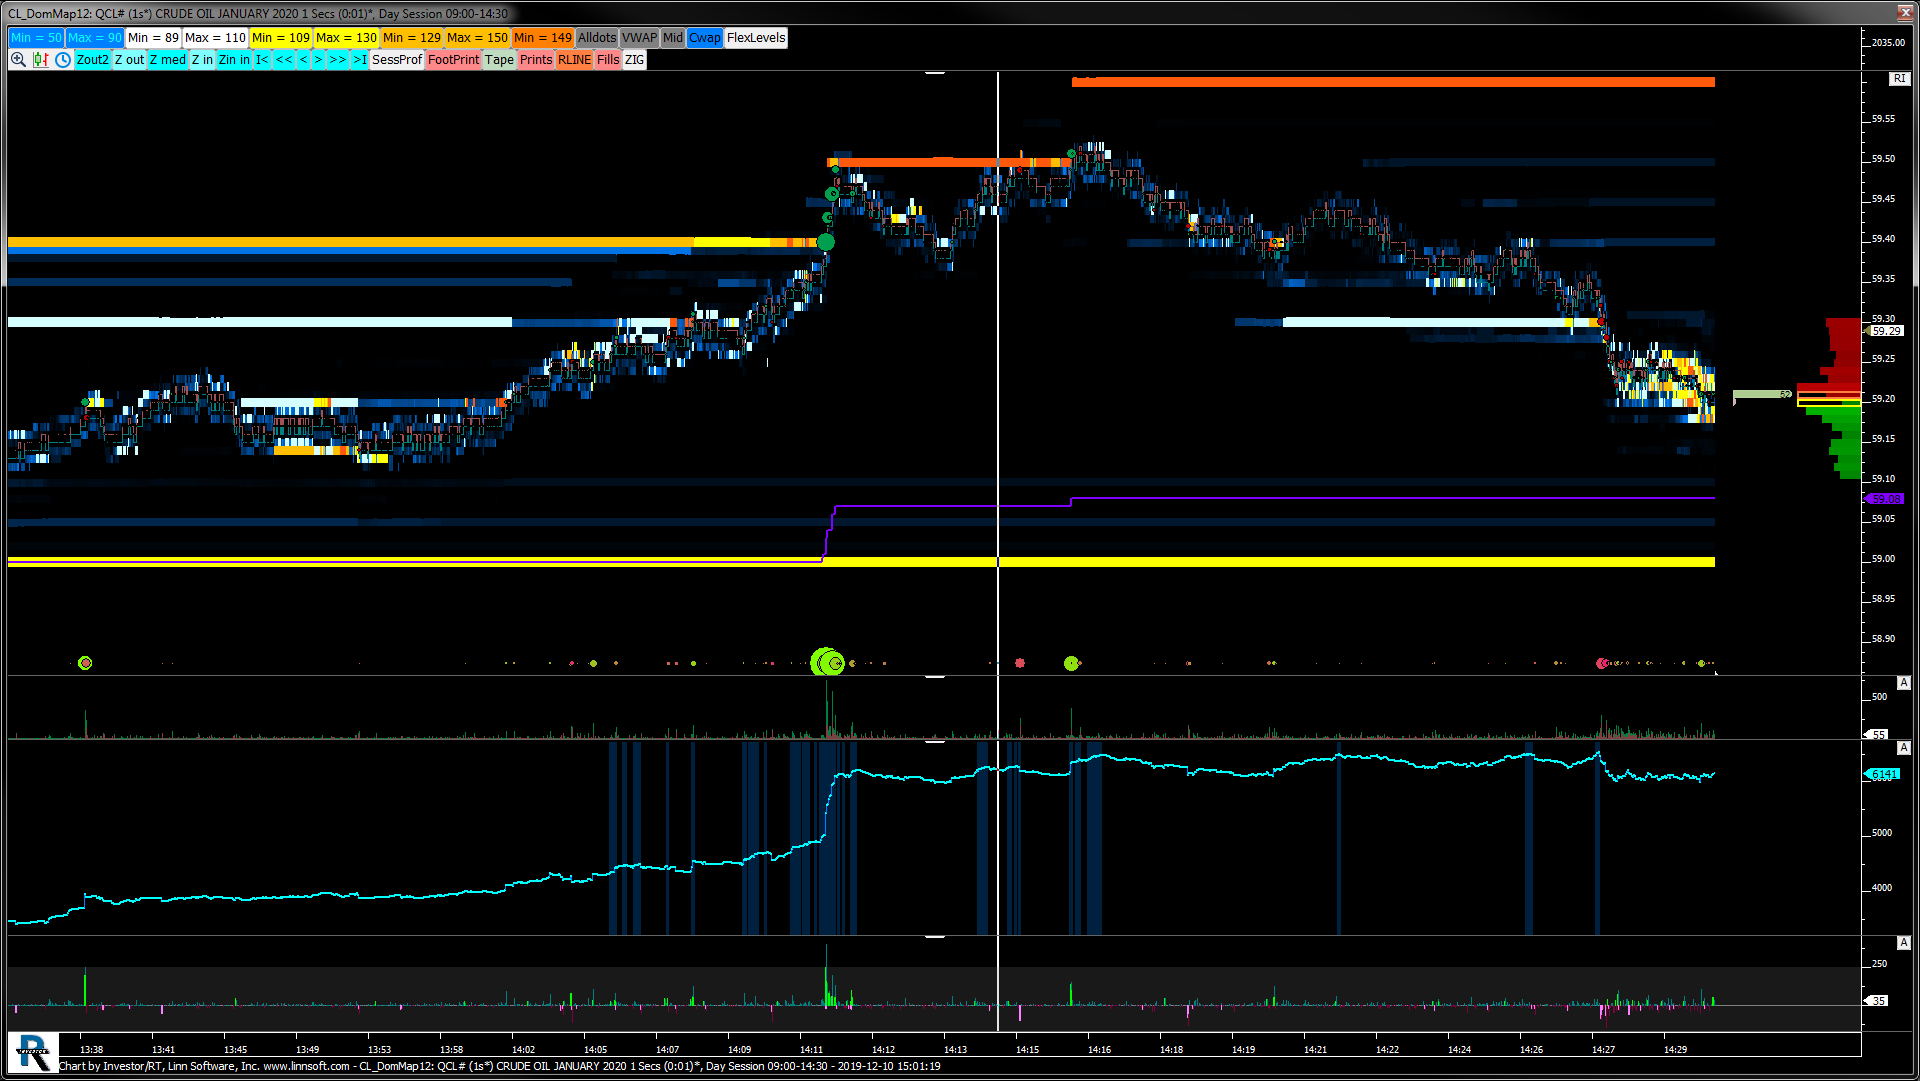 |
CL DomMap (QCL#) jayski51369 [totalcount]
6 years 1 week ago
This chart was uploaded by Investor/RT 13.1.2 showing symbol: QCL#. |
View |
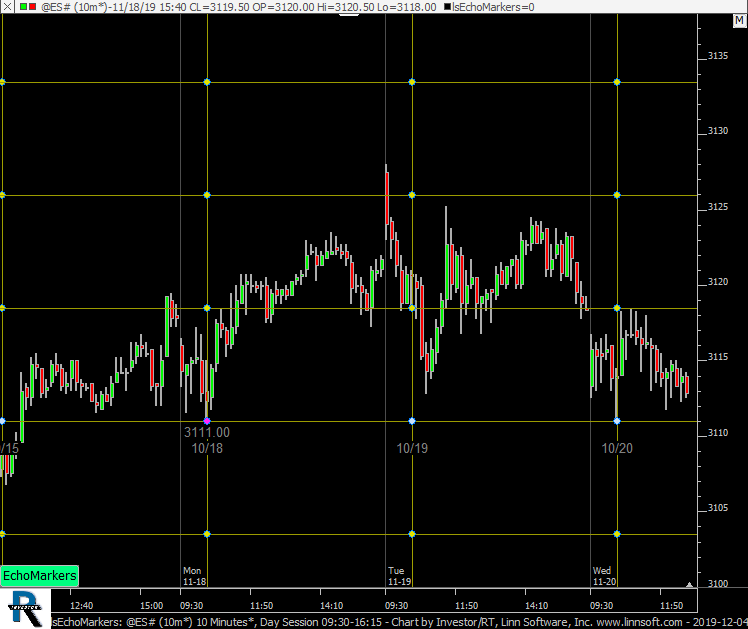 |
lsEchoMarkers (@ES#) cpayne [totalcount]
6 years 2 weeks ago
EchoMarkers (RTX). This chart was uploaded by Investor/RT 14.1.5 showing symbol: @ES#. |
View |
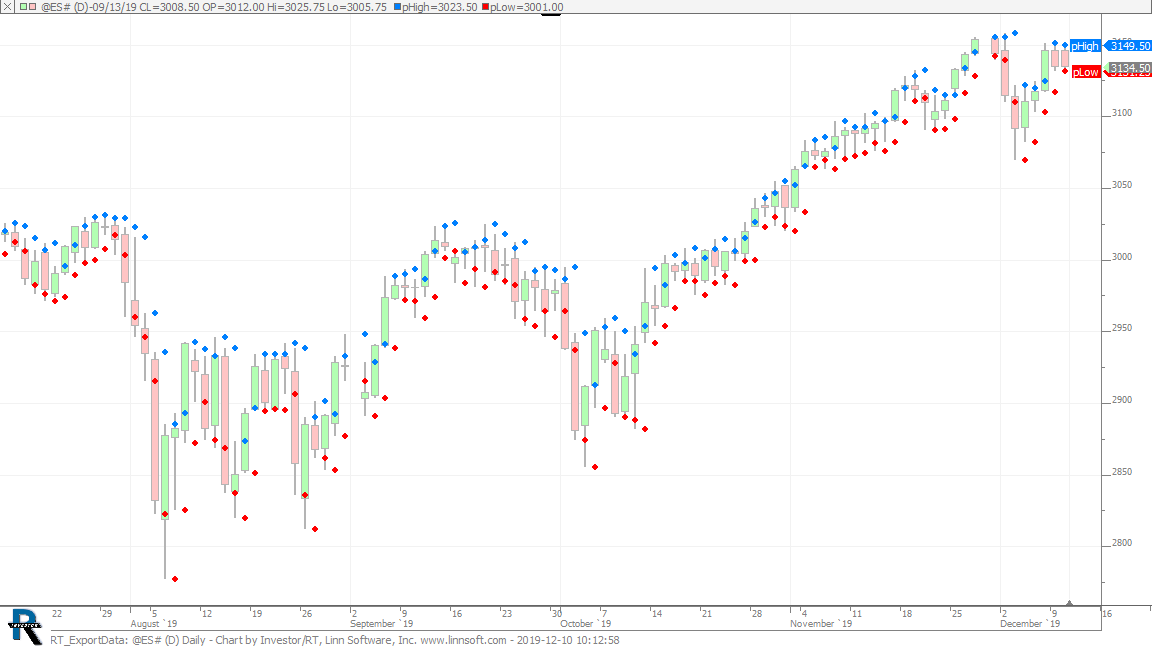 |
RT ExportData (@ES#) cpayne [totalcount]
6 years 1 week ago
Export Chart Data - Prev High and Low. This chart was uploaded by Investor/RT 14.1.5 showing symbol: @ES#. |
View |
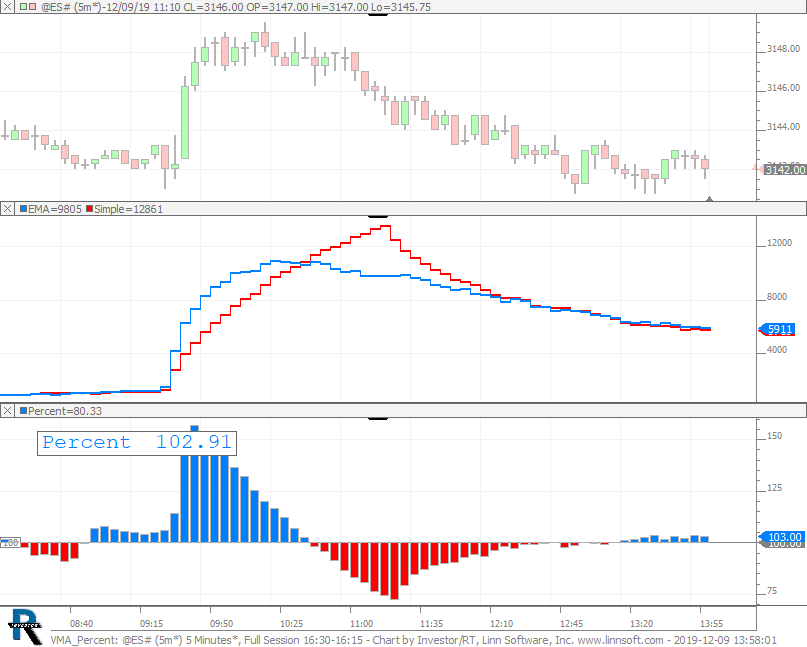 |
VMA Percent (@ES#) cpayne [totalcount]
6 years 1 week ago
Percent of Exp VMA vs Simple VMA. This chart was uploaded by Investor/RT 14.1.5 showing symbol: @ES#. |
View |
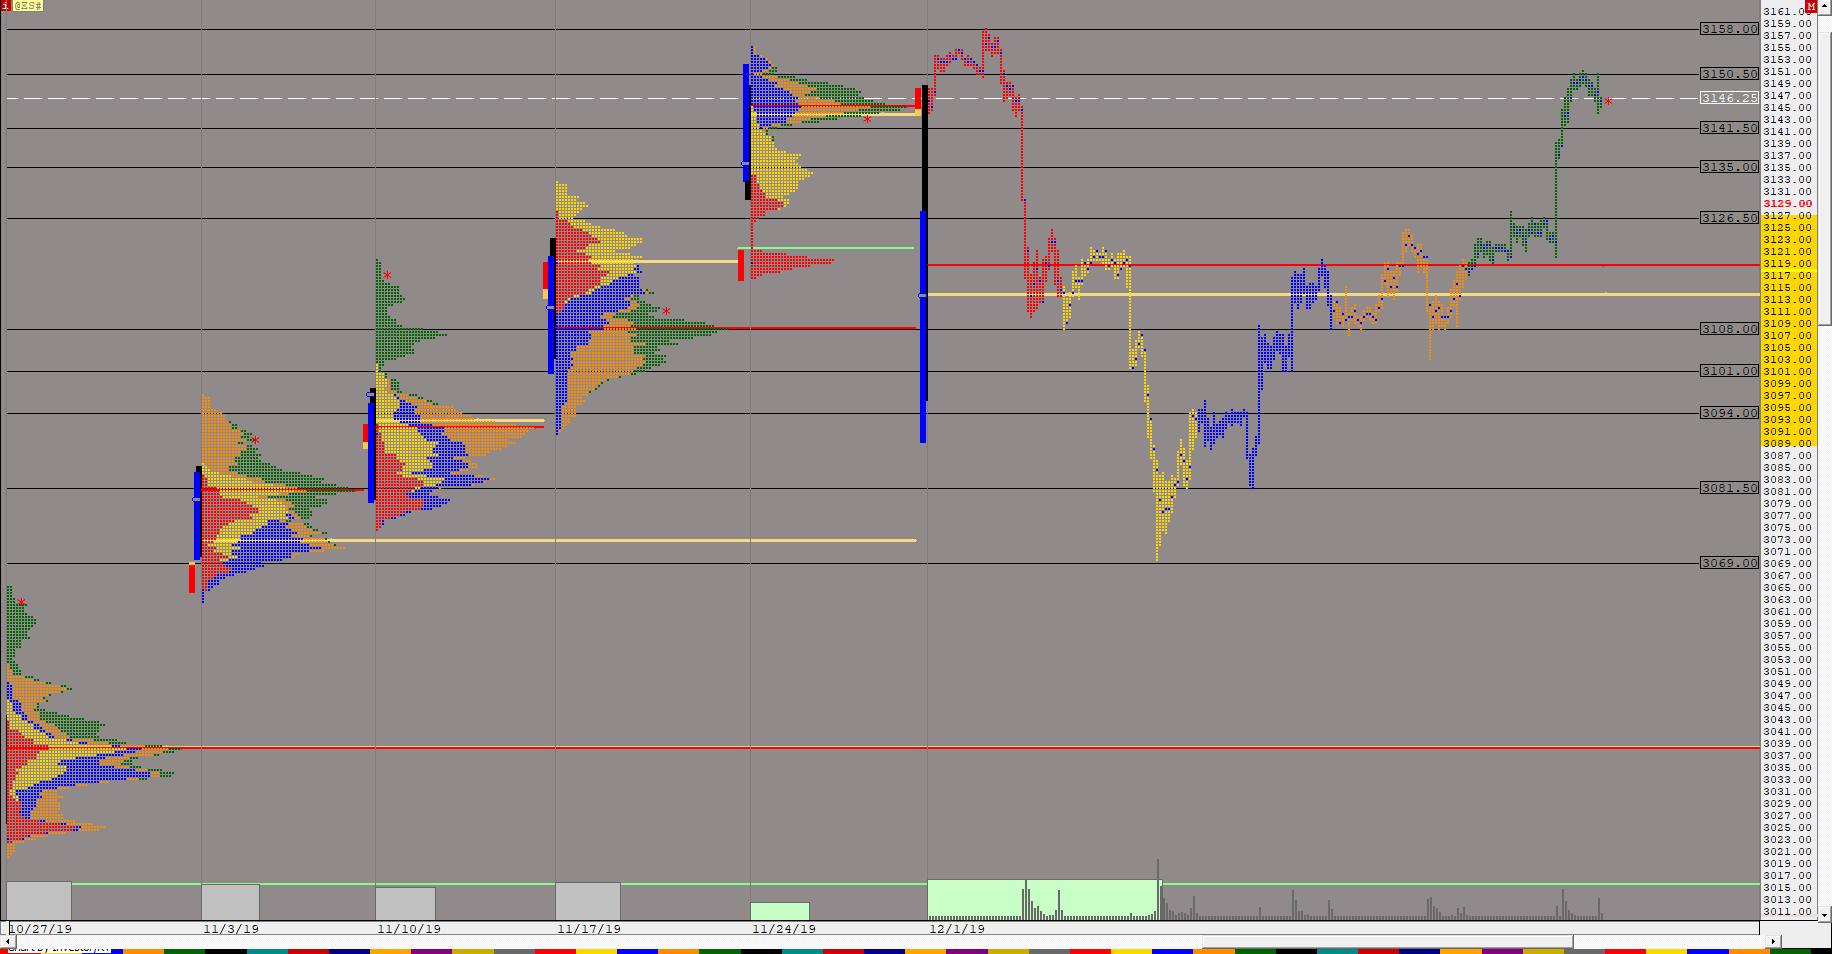 |
TPOWeekly Rainbow (@ES#) ES42 [totalcount]
6 years 1 week ago
WEEKLY TPO. 120 Min Candles. This chart was uploaded by Investor/RT 13.6.3 showing symbol: @ES#. |
View |
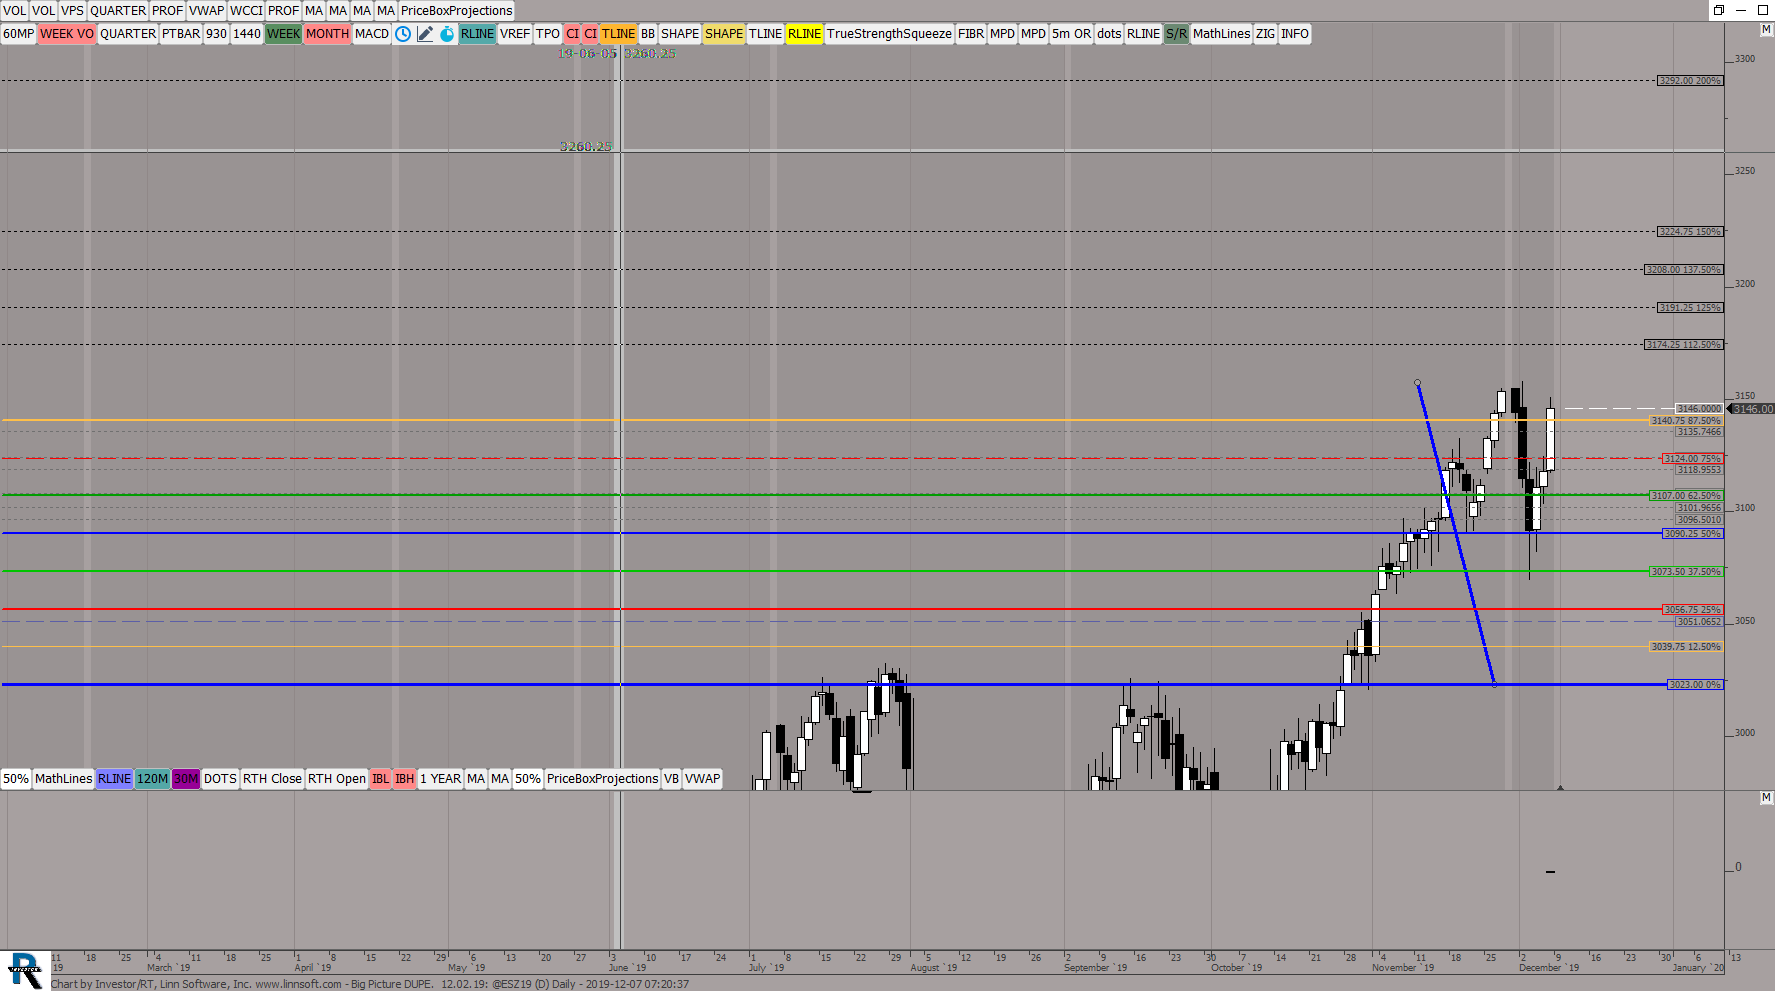 |
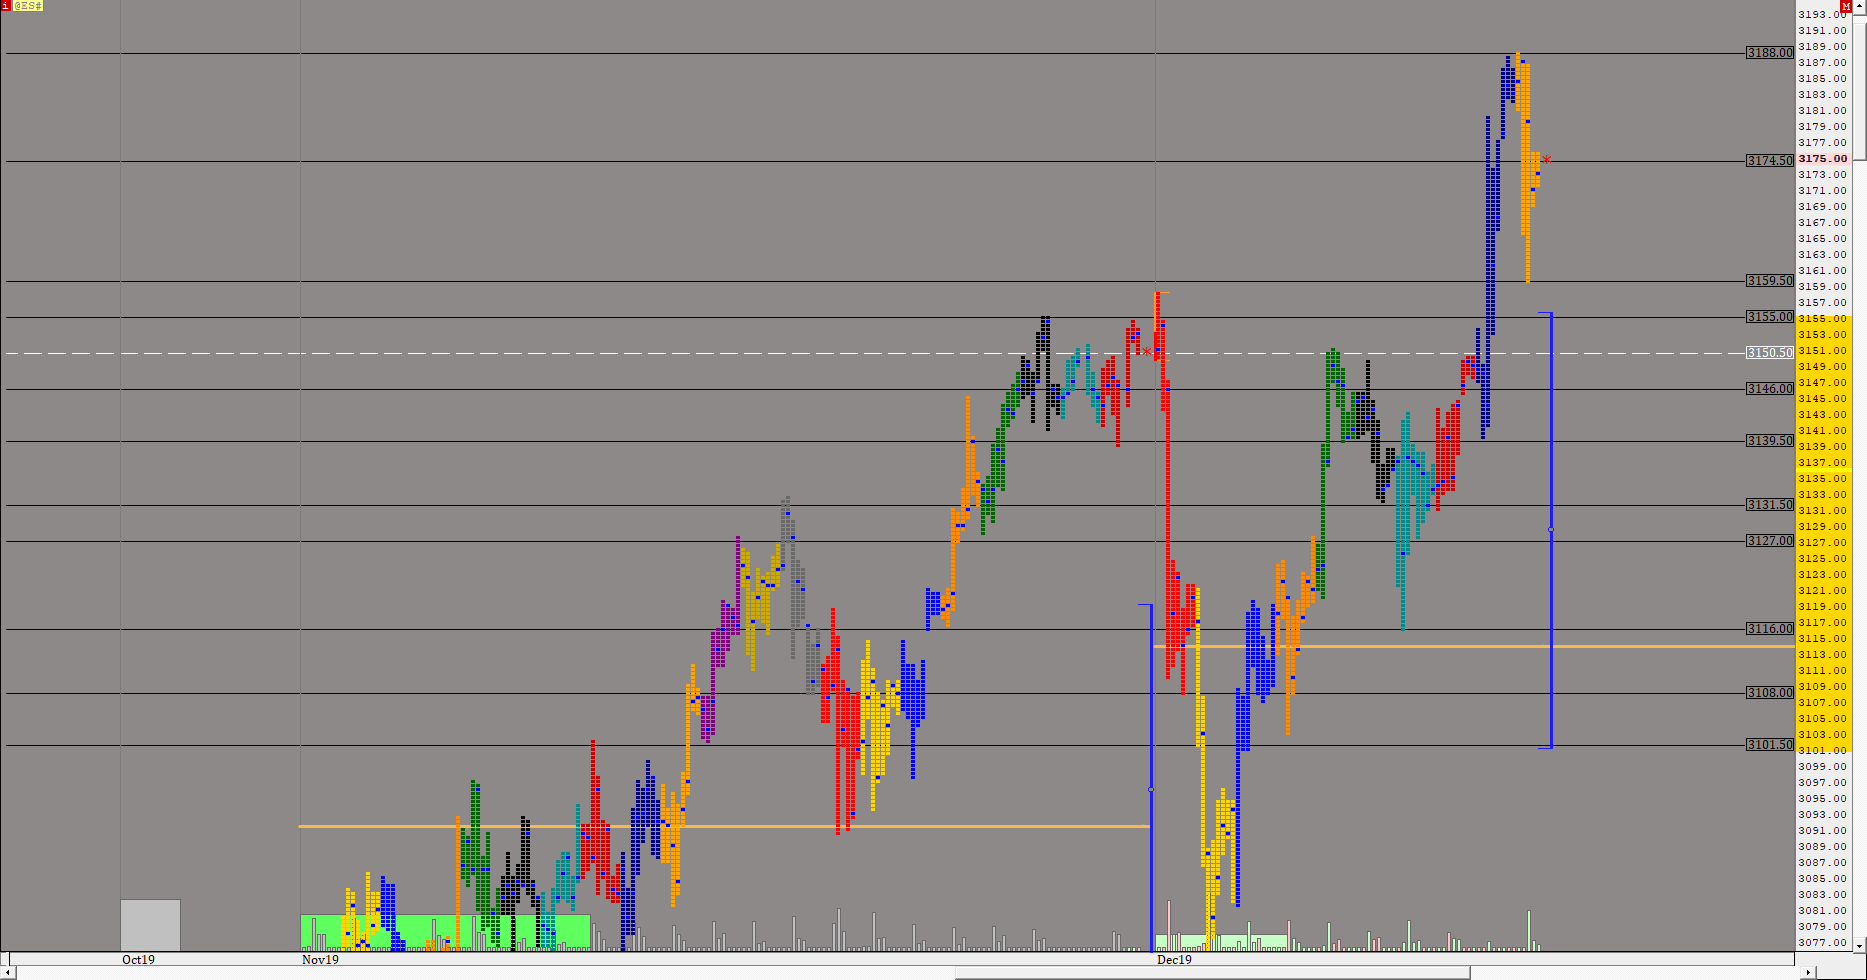
Big Picture DUPE (@ESZ19) ES42 [totalcount]
6 years 1 week ago
Daily Candles. This chart was uploaded by Investor/RT 13.6.3 showing symbol: @ESZ19. |
View |
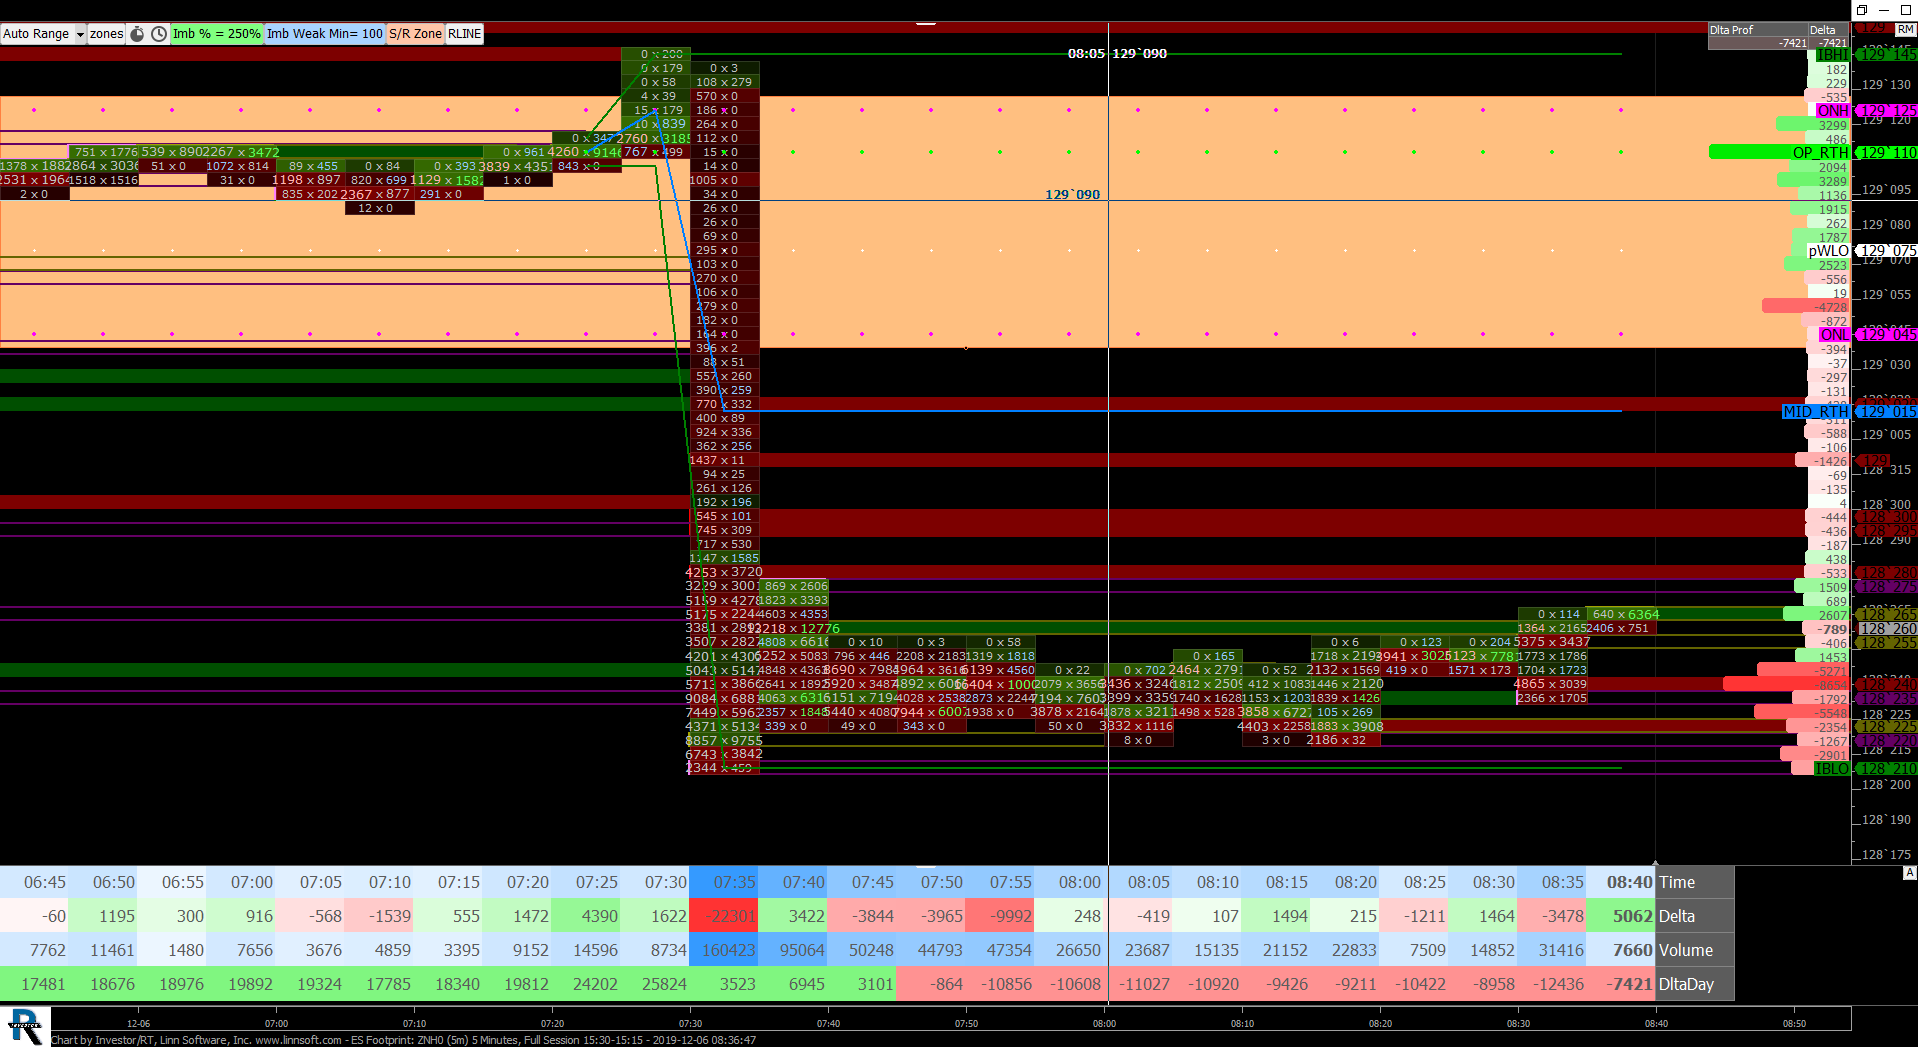 |
ES Footprint (ZNH0) scottz46 [totalcount]
6 years 2 weeks ago
This chart was uploaded by Investor/RT 13.6.3 showing symbol: ZNH0. |
View |
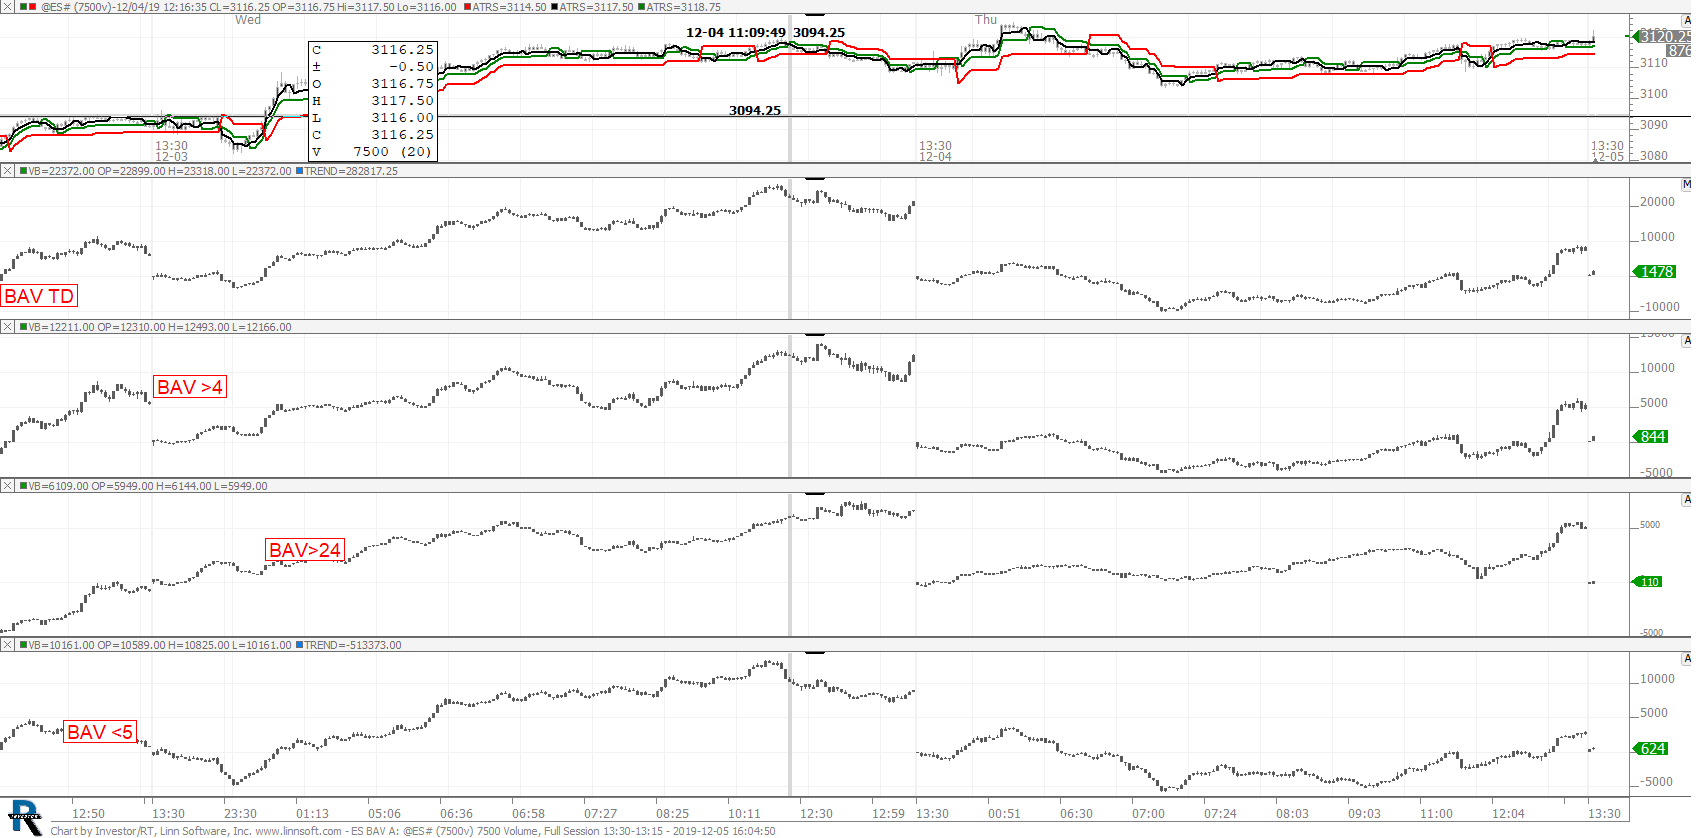 |
ES BAV A (@ES#) kencassorla [totalcount]
6 years 2 weeks ago
delta gaps. This chart was uploaded by Investor/RT 13.6.4 showing symbol: @ES#. |
View |
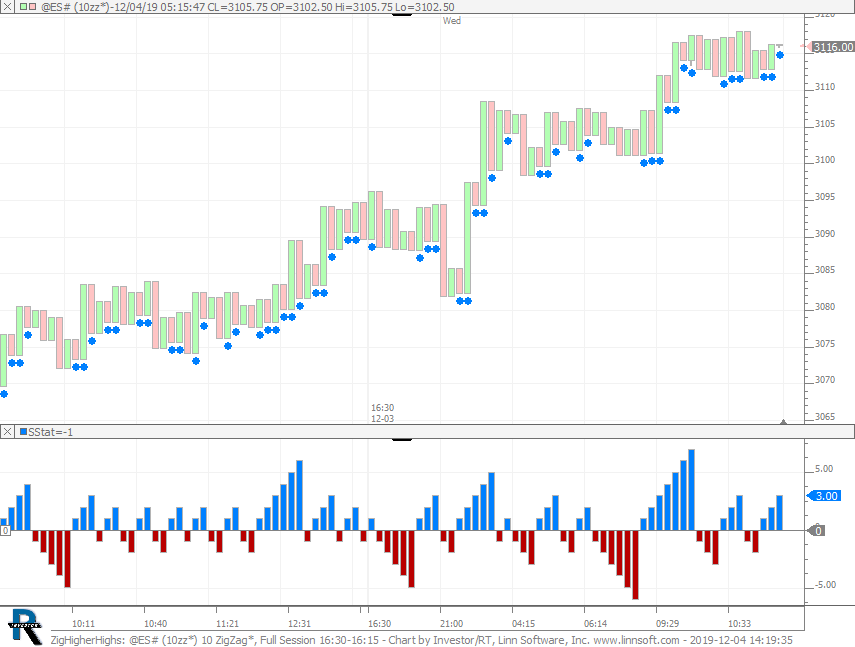 |
ZigHigherHighs (@ES#) cpayne [totalcount]
6 years 2 weeks ago
This chart was uploaded by Investor/RT 14.1.5 showing symbol: @ES#. |
View |