HighlightOpeningCandle (@ES#)
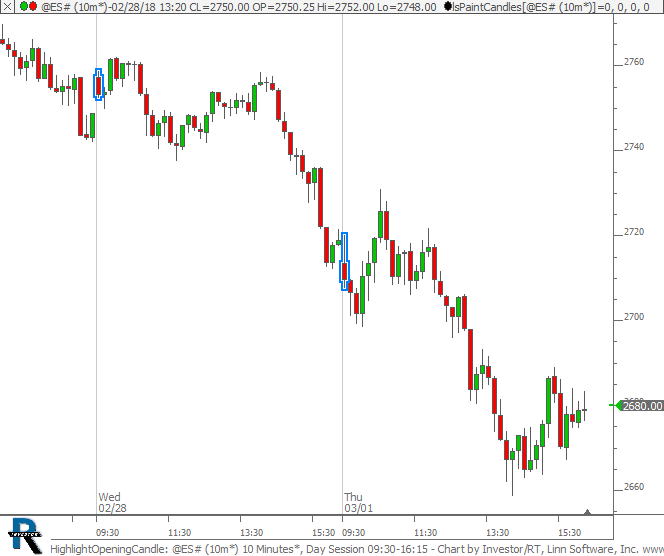
Highlight First Bar of Session. This chart was uploaded by Investor/RT 13.2.5 showing symbol: @ES#.
Highlight First Bar of Session. This chart was uploaded by Investor/RT 13.2.5 showing symbol: @ES#.
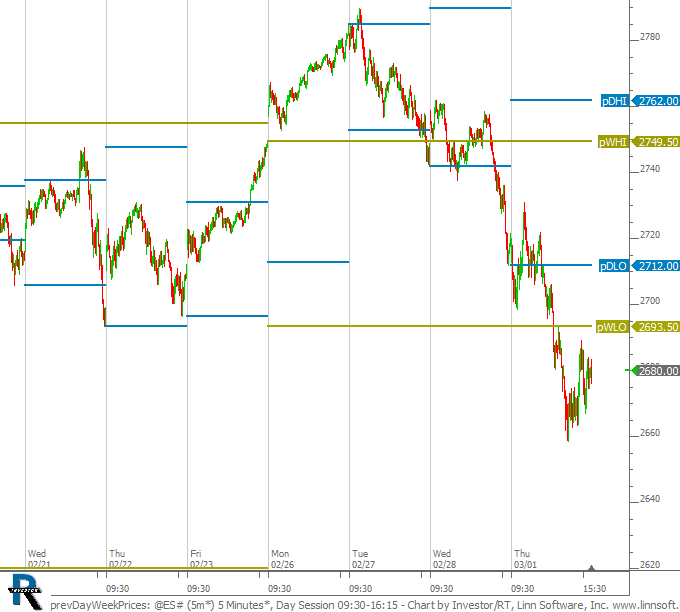
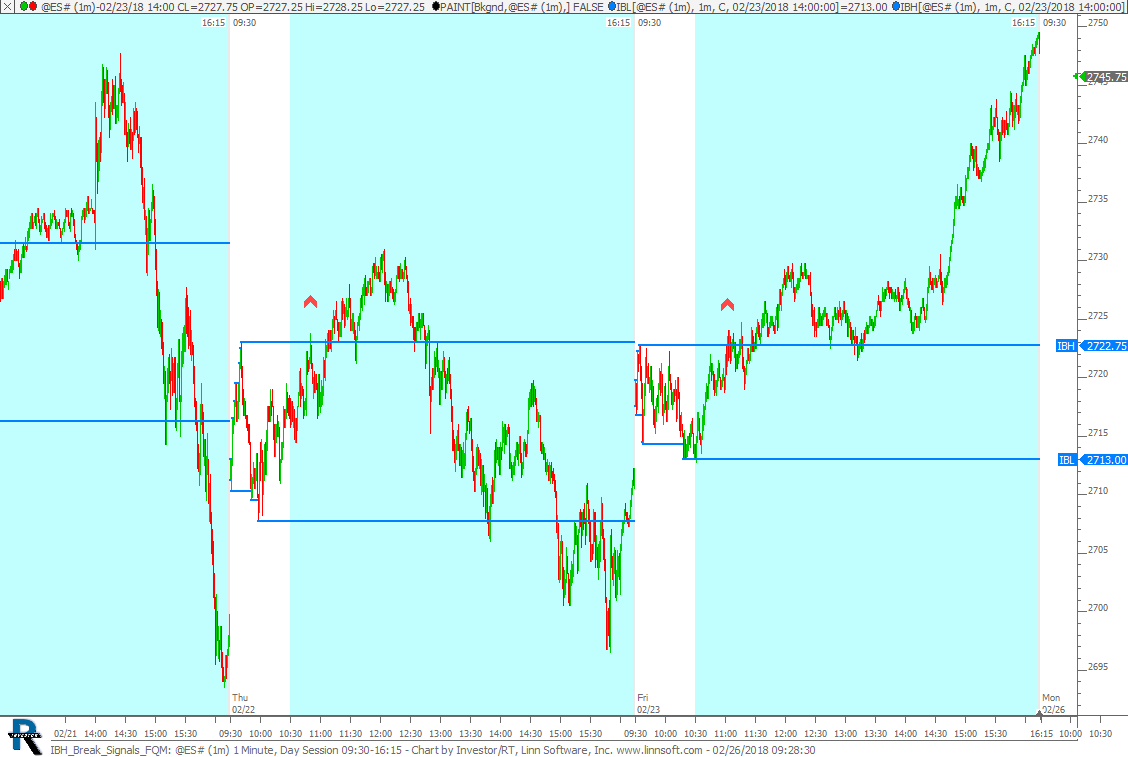
Previous Day and Week High and Low Price Lines. This chart was uploaded by Investor/RT 13.2.5 showing symbol: @ES#.
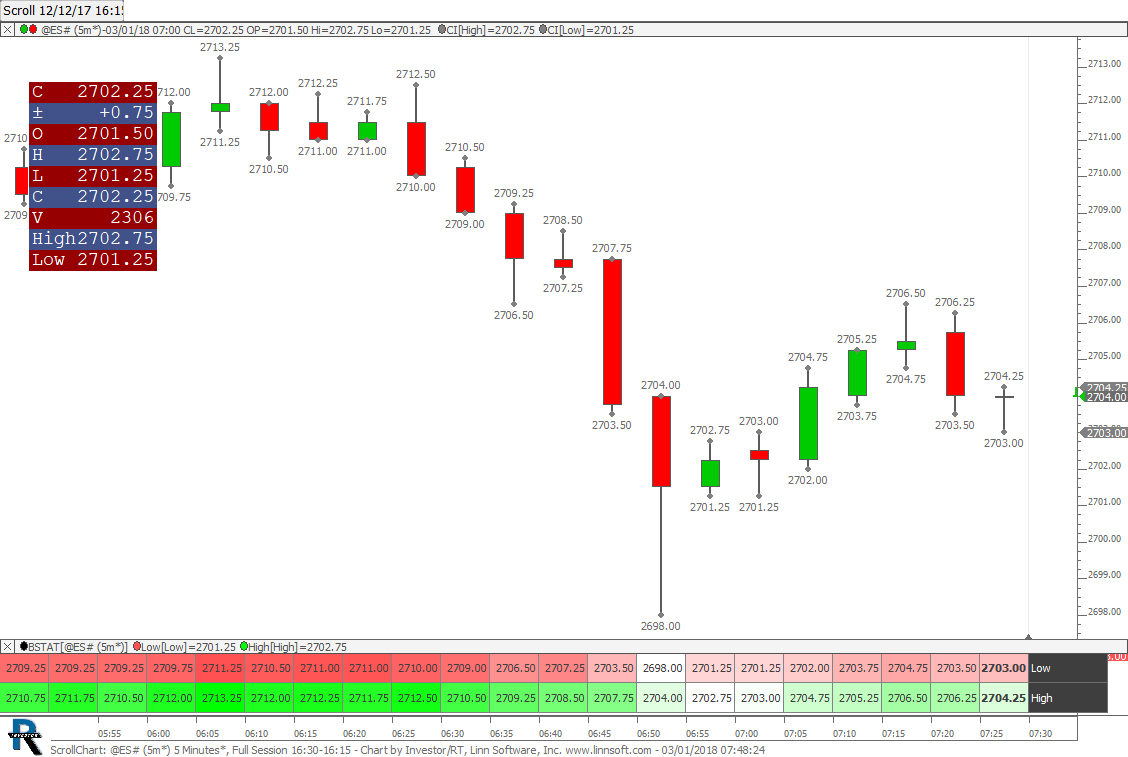
Variety of ways to see the high and low of each bar. This chart was uploaded by Investor/RT 13.2.5 showing symbol: @ES#.
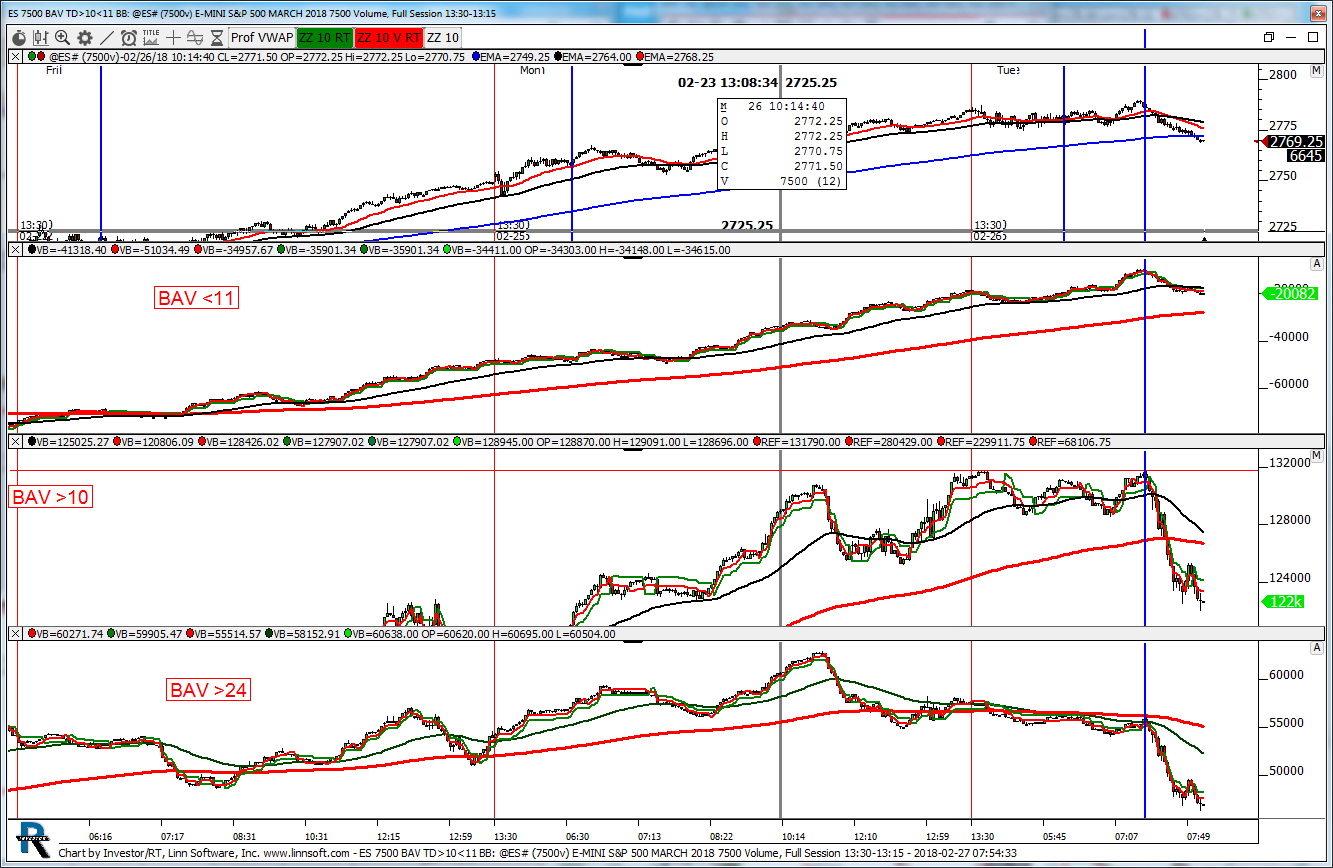
7500V. This chart was uploaded by Investor/RT 13.2.4 showing symbol: @ES#.
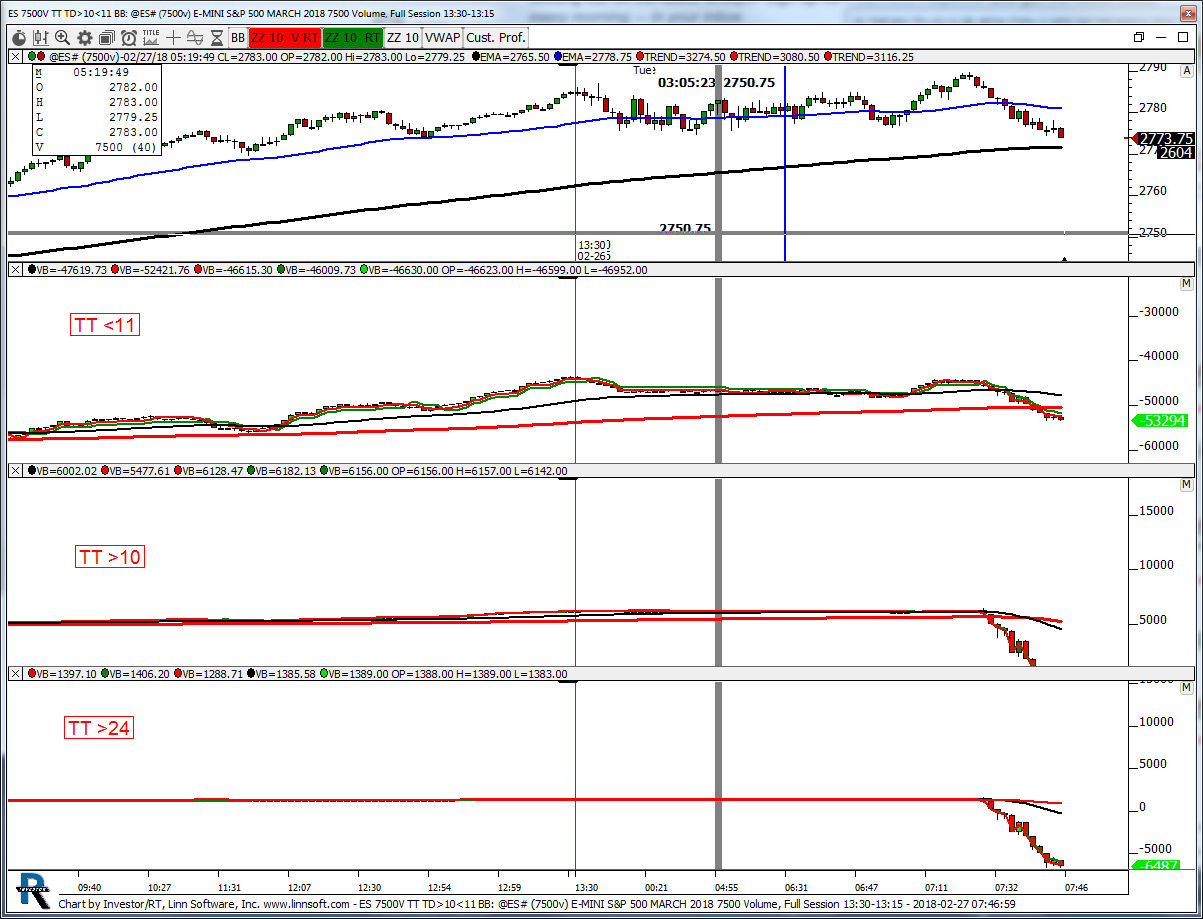
7500V. This chart was uploaded by Investor/RT 13.2.4 showing symbol: @ES#.
This chart was uploaded by Investor/RT 13.2.4 showing symbol: @ES#.
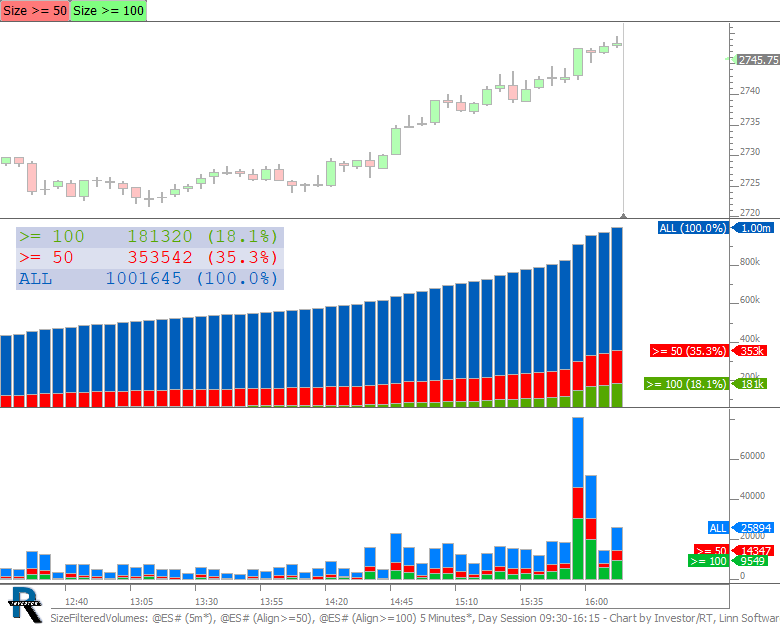
Percent of volume at different size filters. This chart was uploaded by Investor/RT 13.2.4 showing symbol: @ES#.
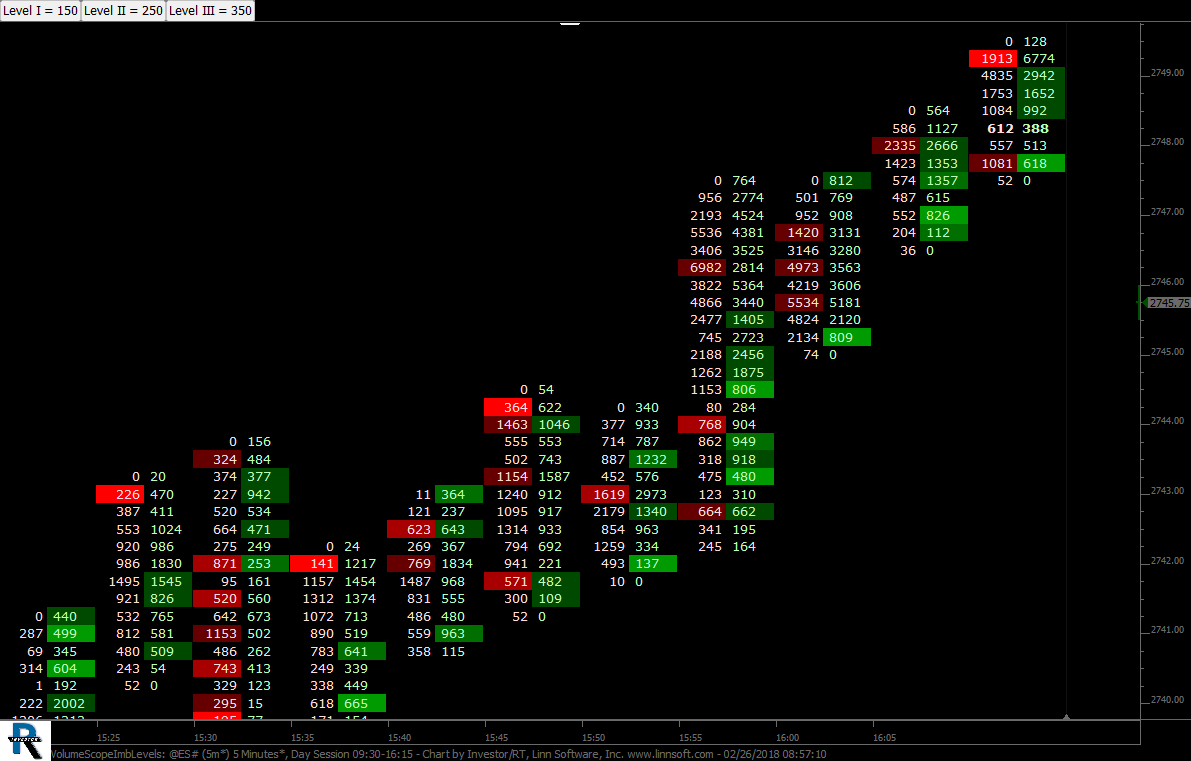
Three Levels of Volume Imbalance. Levels controlled by buttons. This chart was uploaded by Investor/RT 13.2.4 showing symbol: @ES#.
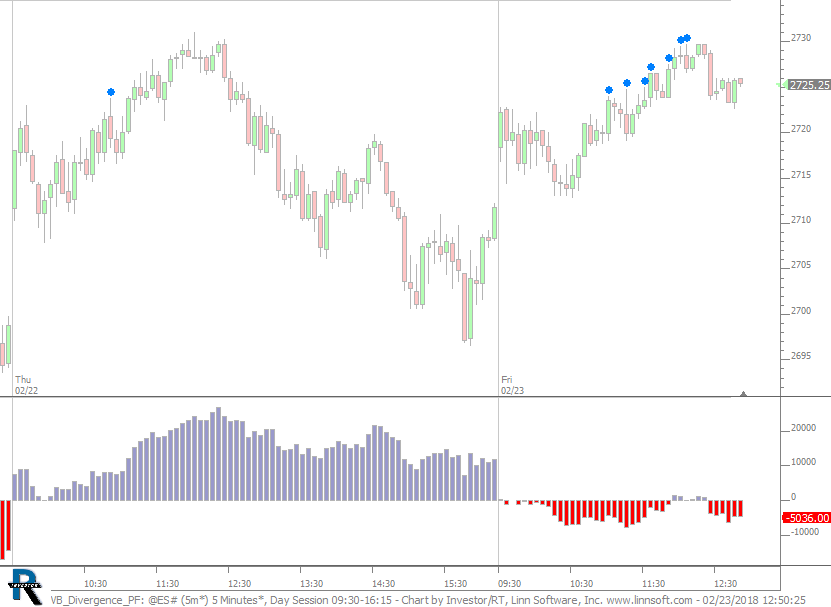
Price making new high of day while cumulative delta (up/down tick) is not. This chart was uploaded by Investor/RT 13.2.4 showing symbol: @ES#.
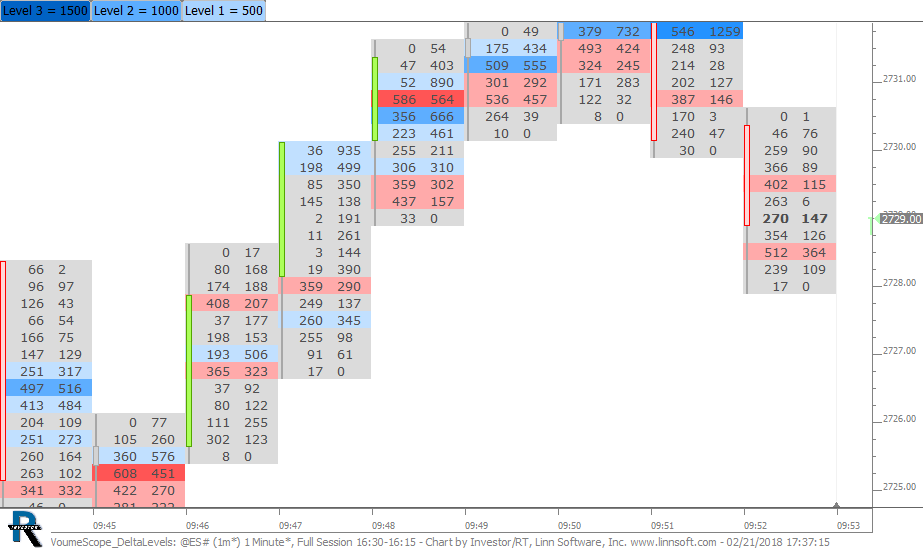
VolumeScope® - Colors 3 Levels of Delta Volume. Use buttons to control 3 levels of volume. This chart was uploaded by Investor/RT 13.2.4 showing symbol: @ES#.