MasterExport (ESZ7)
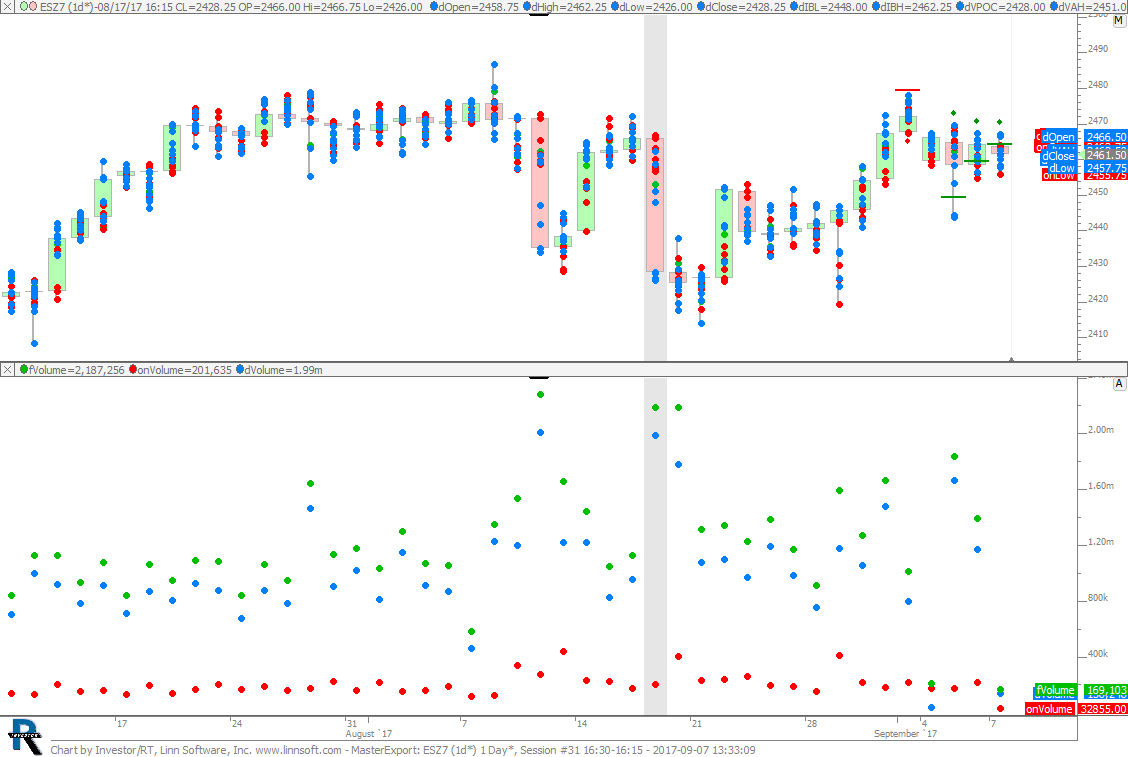
This chart was uploaded by Investor/RT 12.7.6 showing symbol: ESZ7.
This chart was uploaded by Investor/RT 12.7.6 showing symbol: ESZ7.
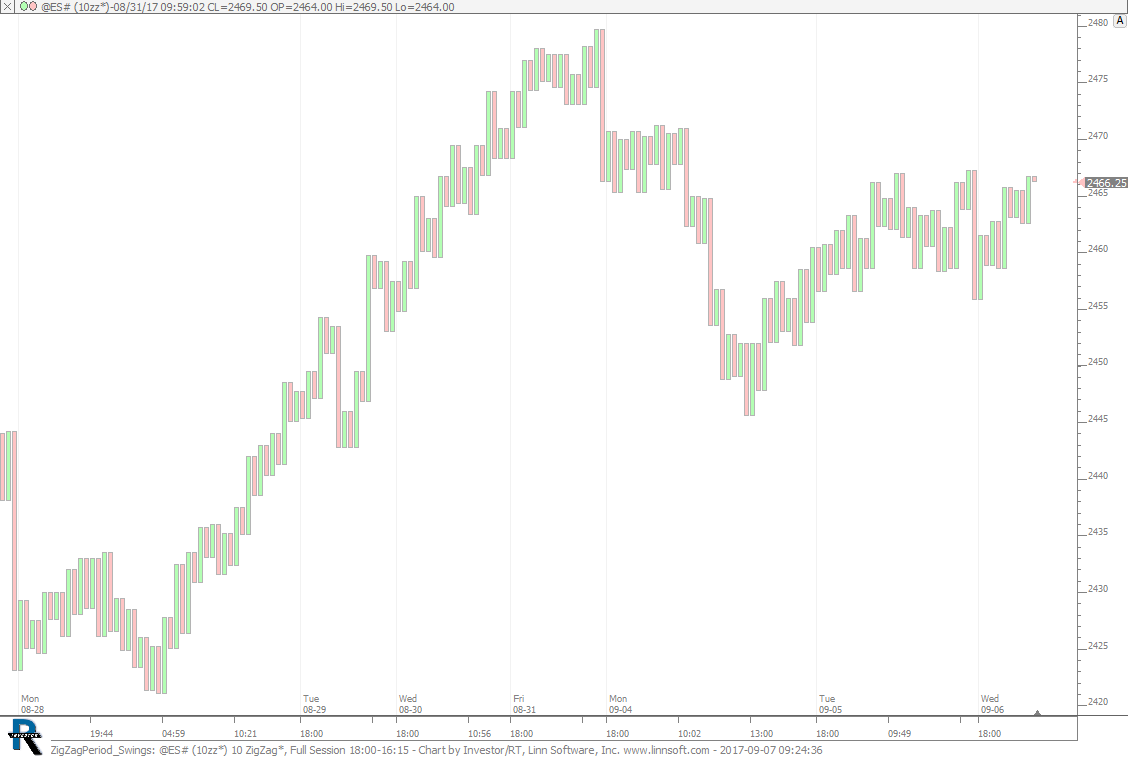
Zig Zag Periodicity - Swing Highs/Lows. This chart was uploaded by Investor/RT 13.1.1 showing symbol: @ES#.
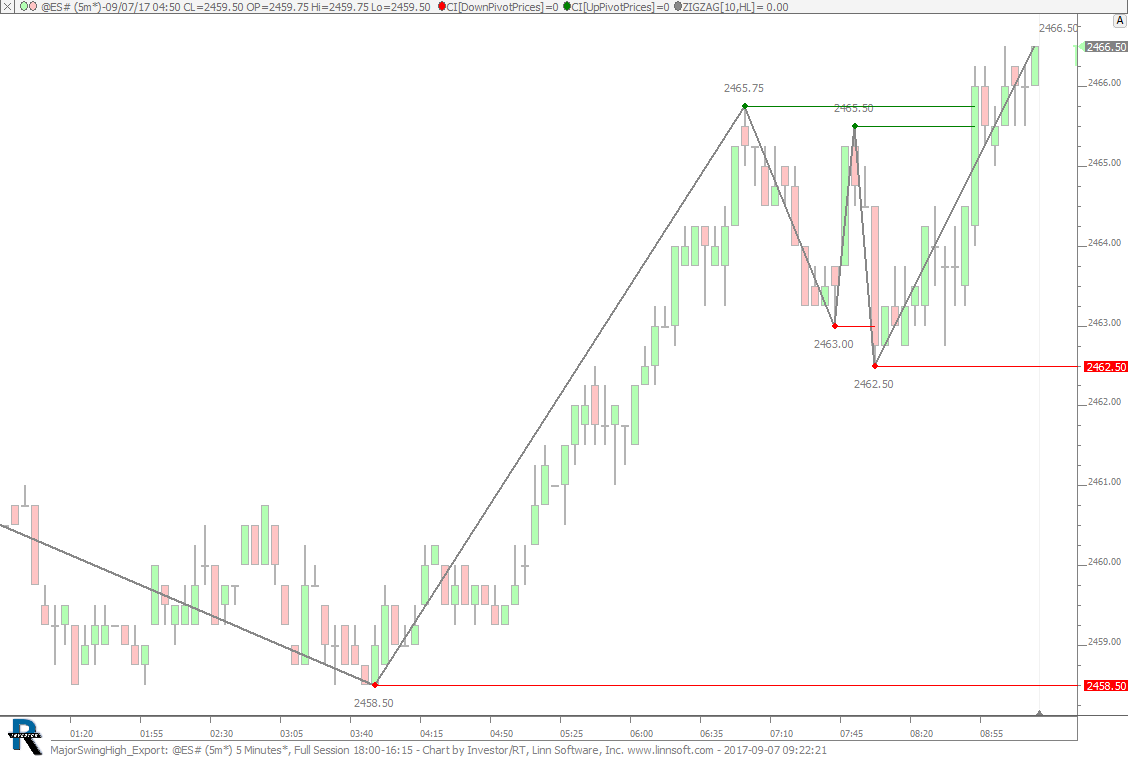
Up and Down Pivots for Export. This chart was uploaded by Investor/RT 13.1.1 showing symbol: @ES#.
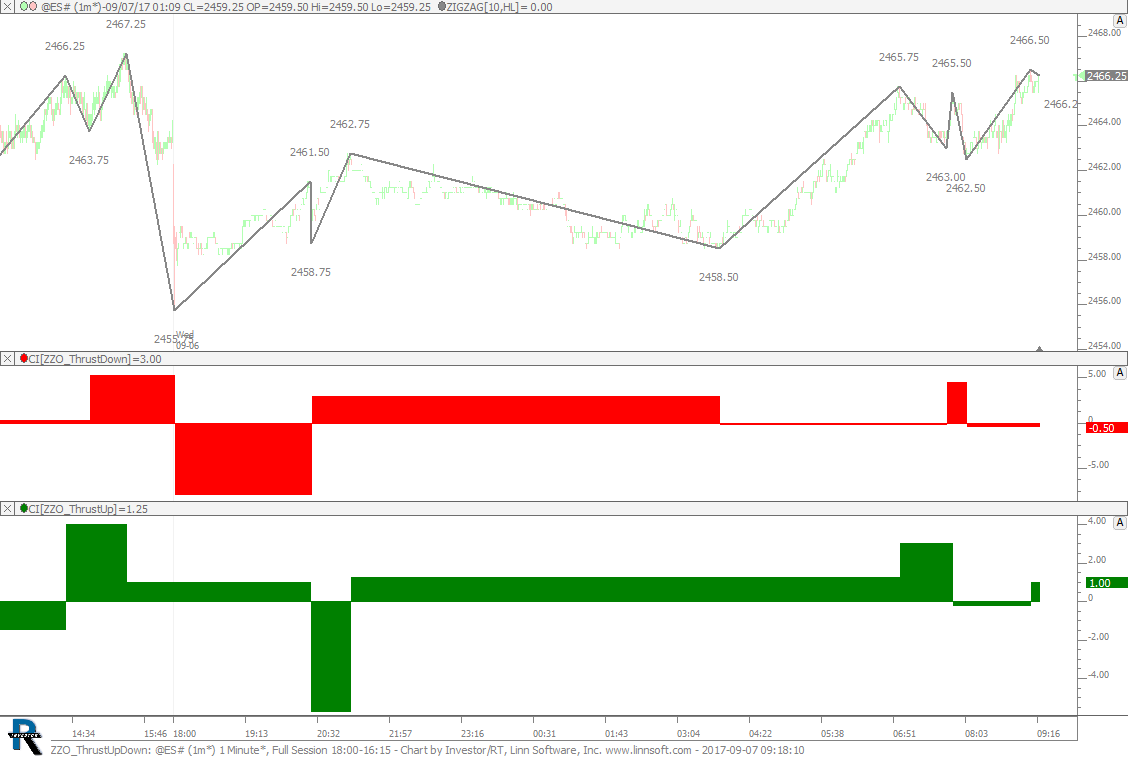
ZZO - Thrust Up and Down. This chart was uploaded by Investor/RT 13.1.1 showing symbol: @ES#.
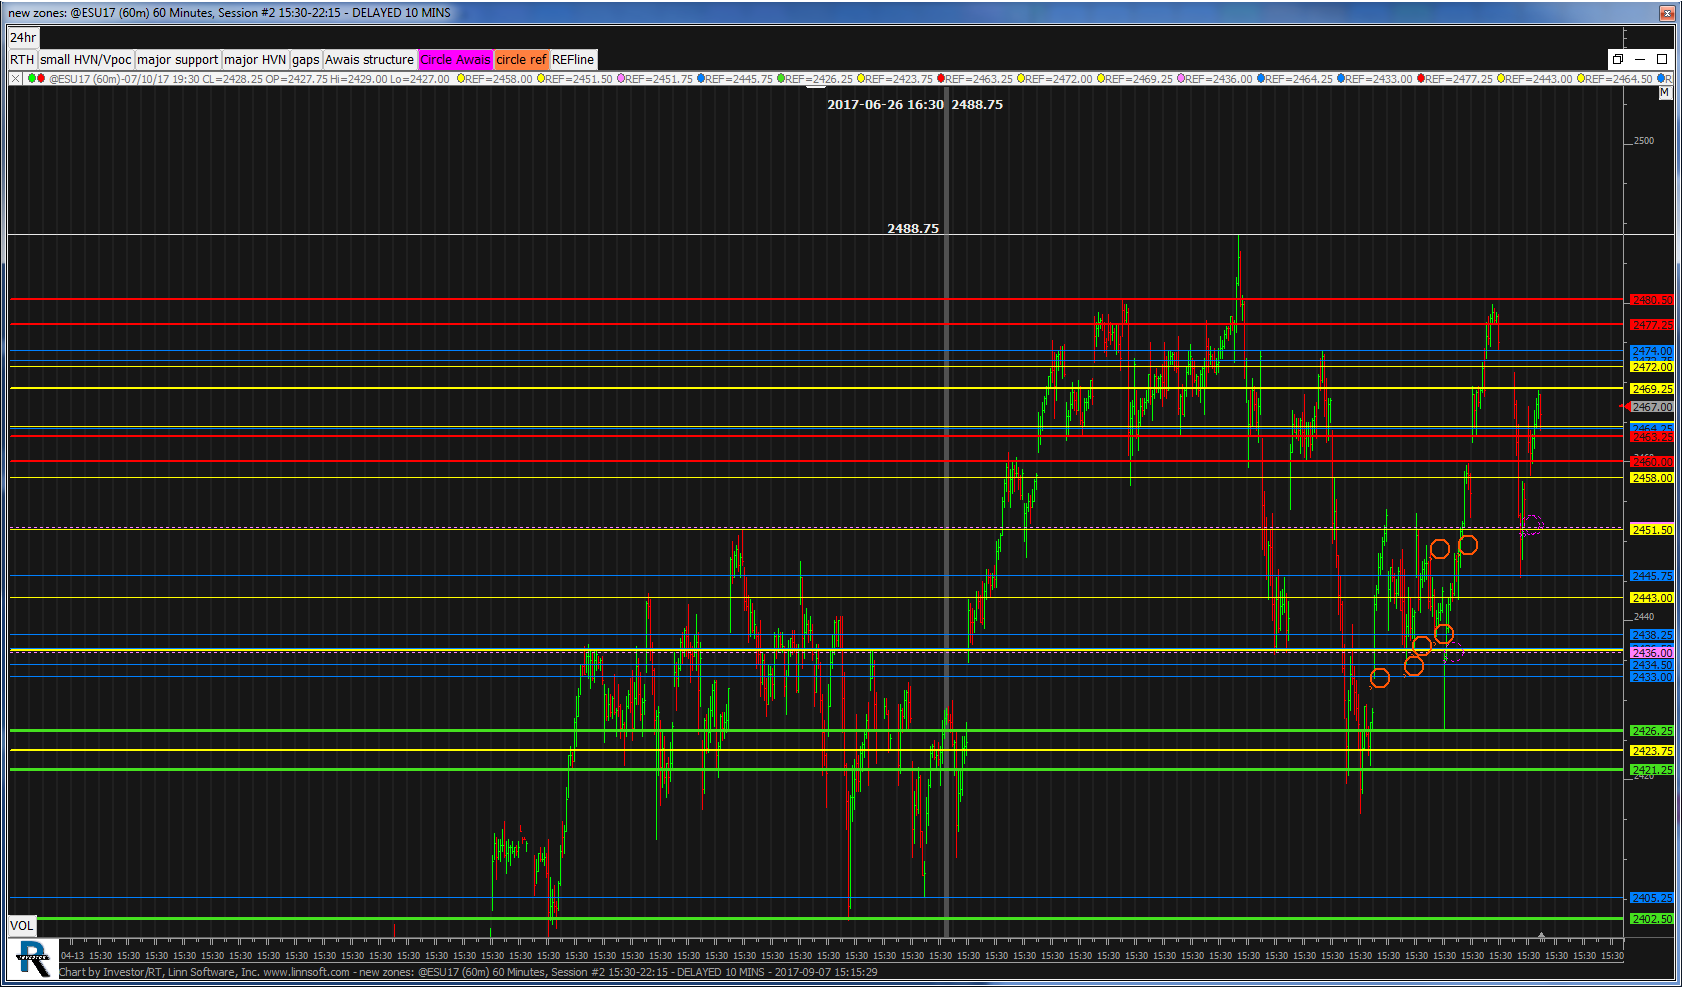
This chart was uploaded by Investor/RT 12.7.3 showing symbol: @ESU17.
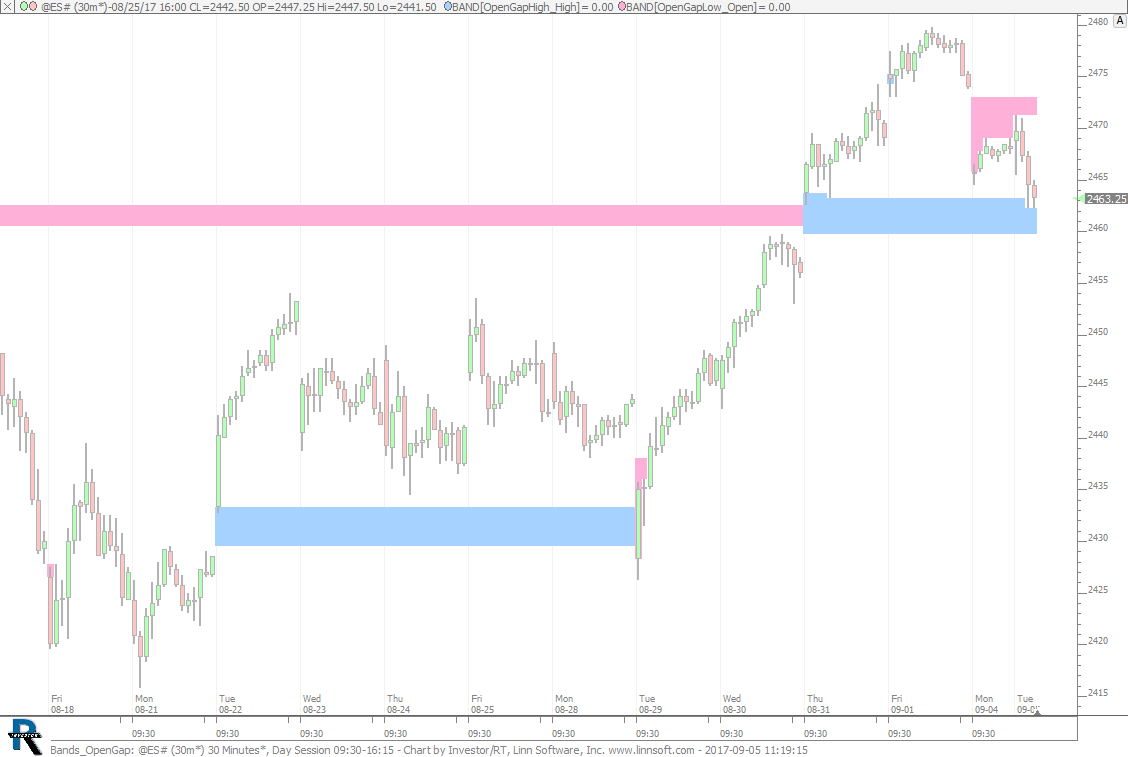
Bands - Open Gap Yesterdays Range. This chart was uploaded by Investor/RT 13.1.1 showing symbol: @ES#.
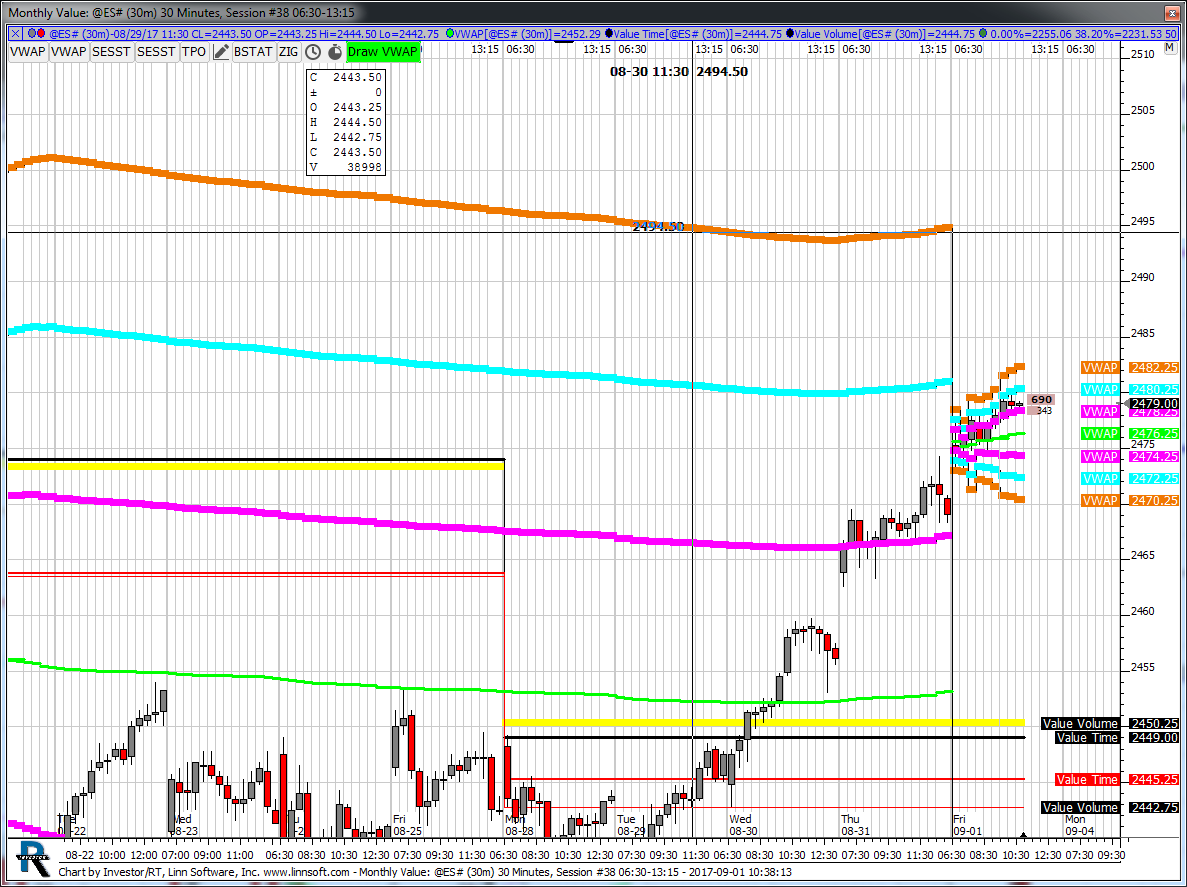
This chart was uploaded by Investor/RT 12.7.6 showing symbol: @ES#.
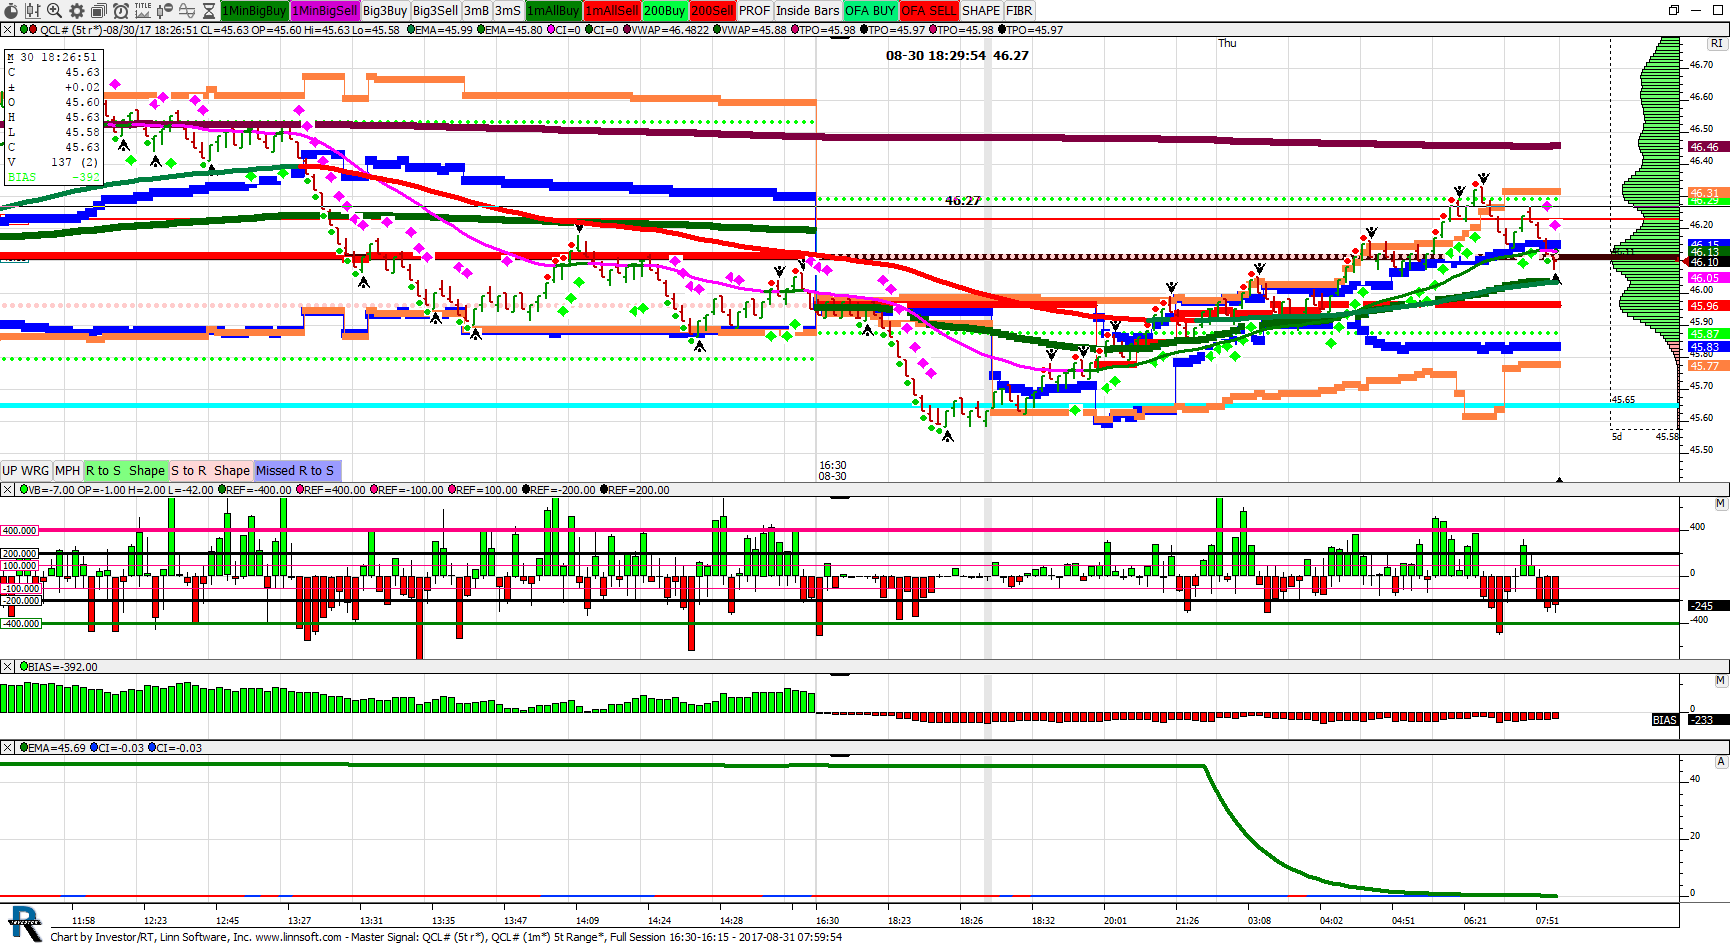
5 Day Profile values. This chart was uploaded by Investor/RT 12.6.1 showing symbol: QCL#.
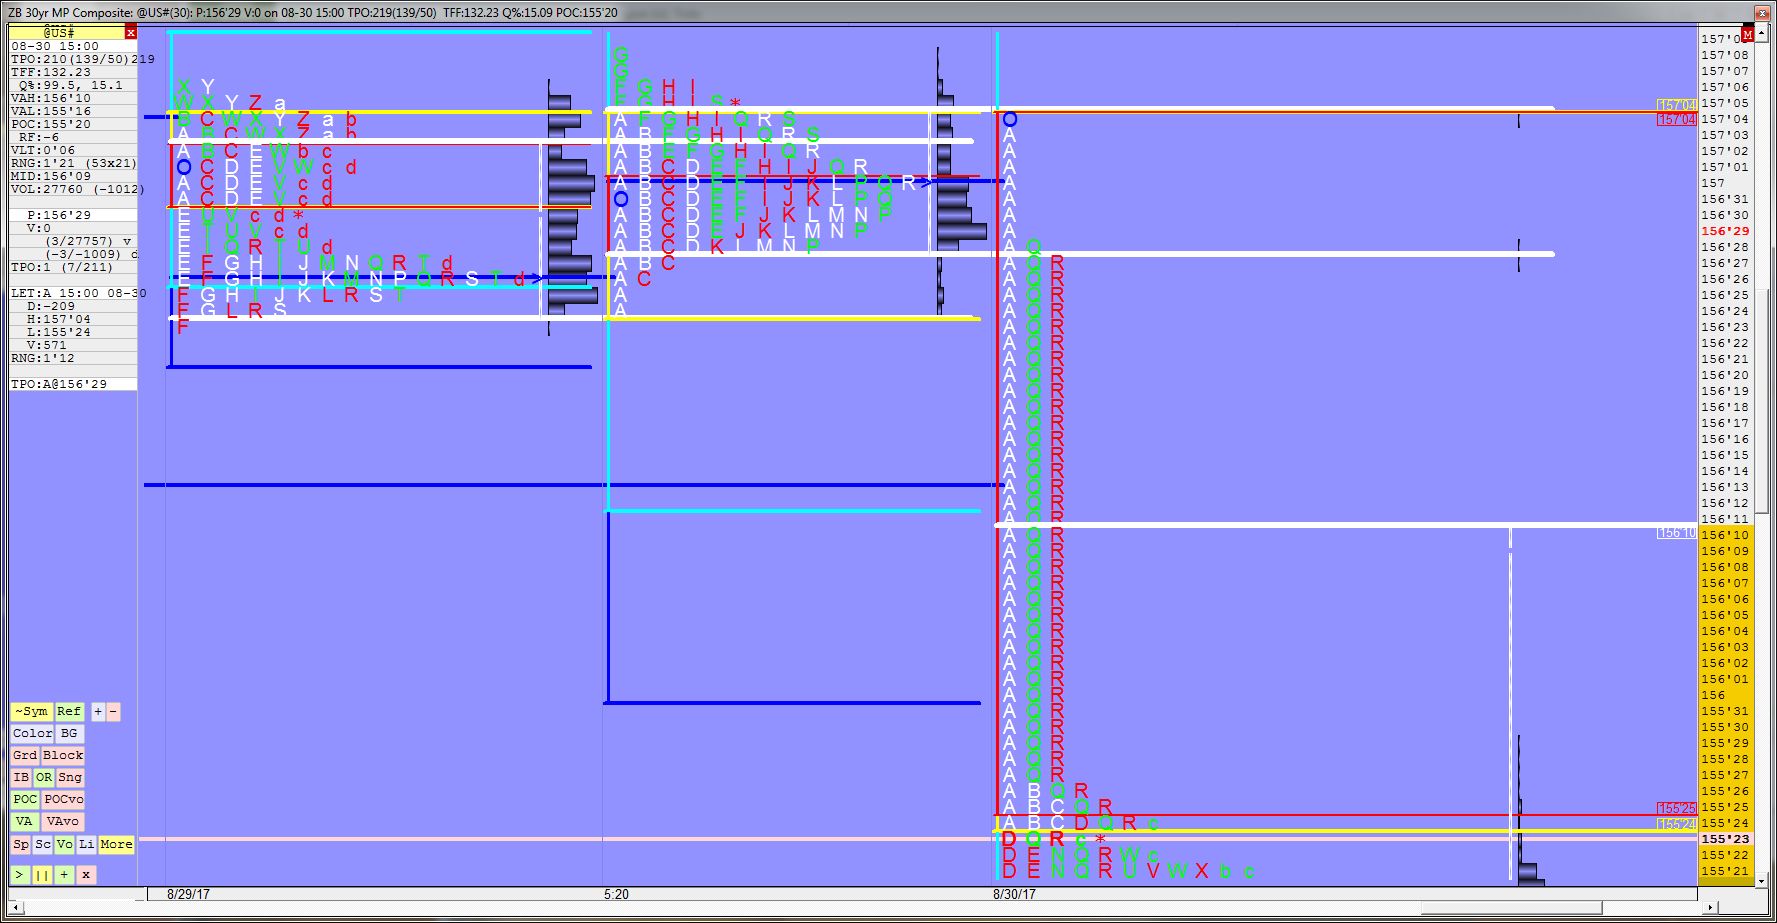
This chart does not look right. Please verify the A and M period and price. This chart was uploaded by Investor/RT 12.7.3 showing symbol: @US#.
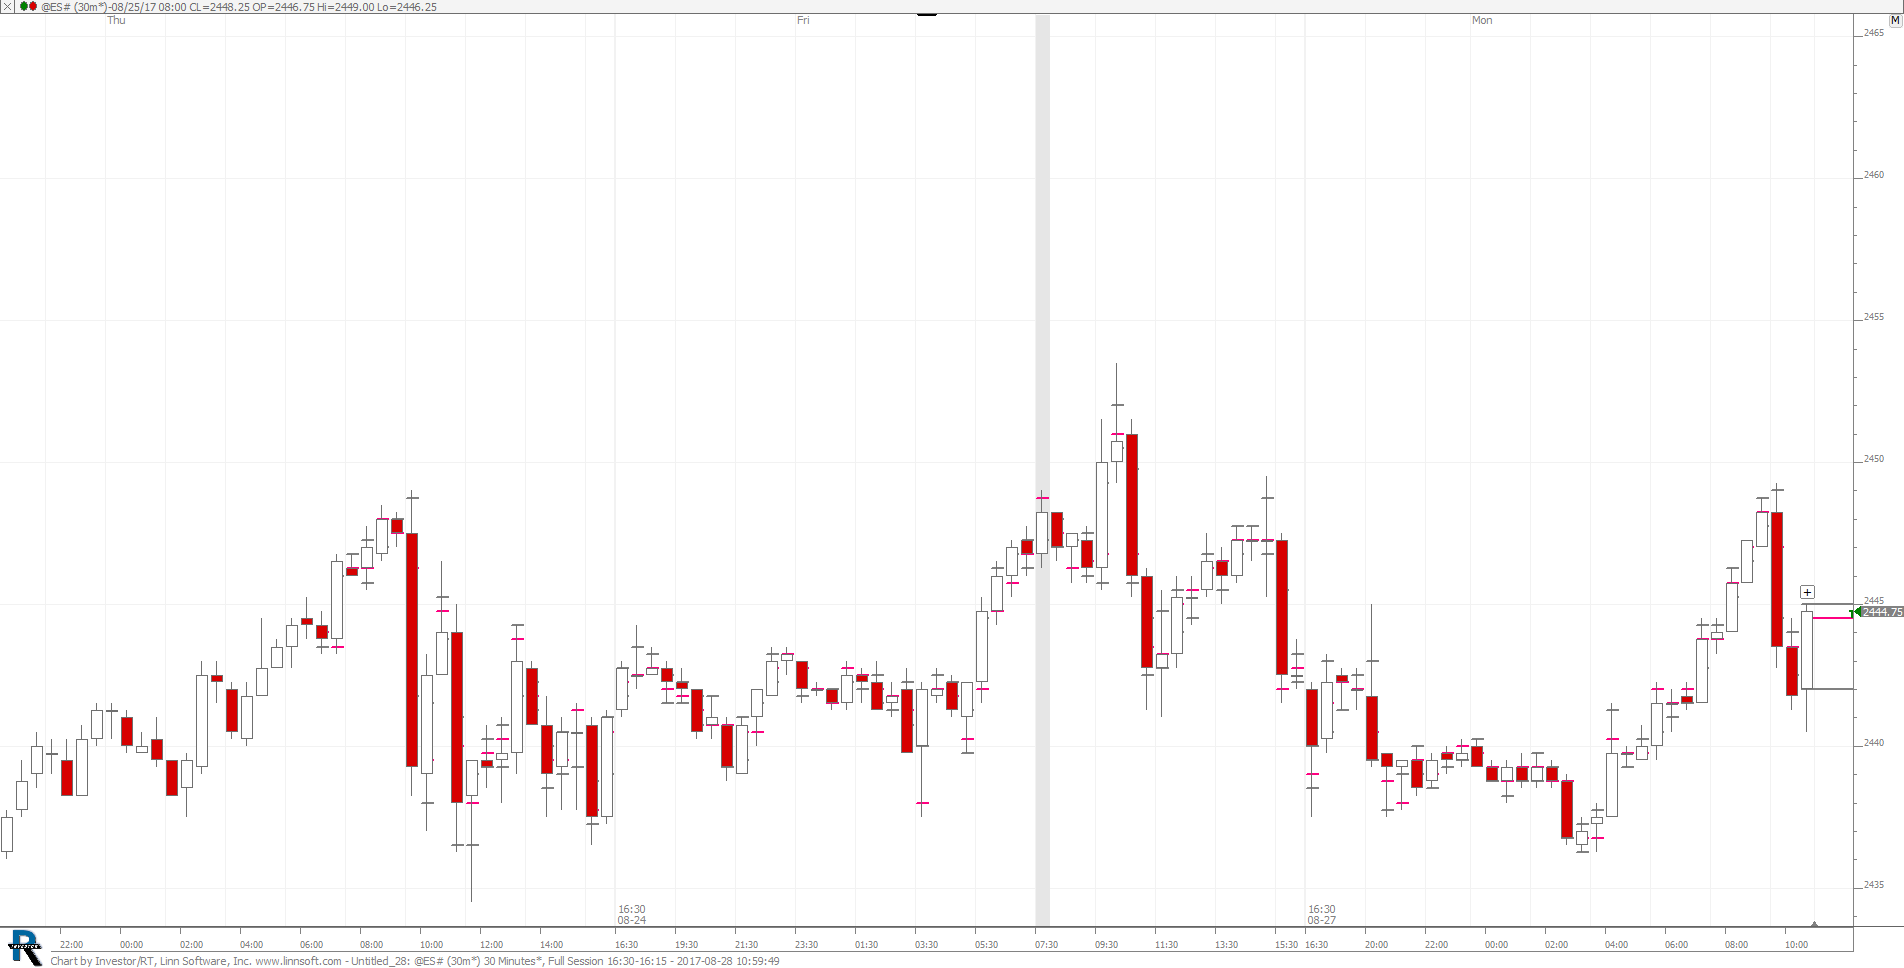
This chart was uploaded by Investor/RT 13.1.1 showing symbol: @ES#.