NQ Daily (@NQ#) 2
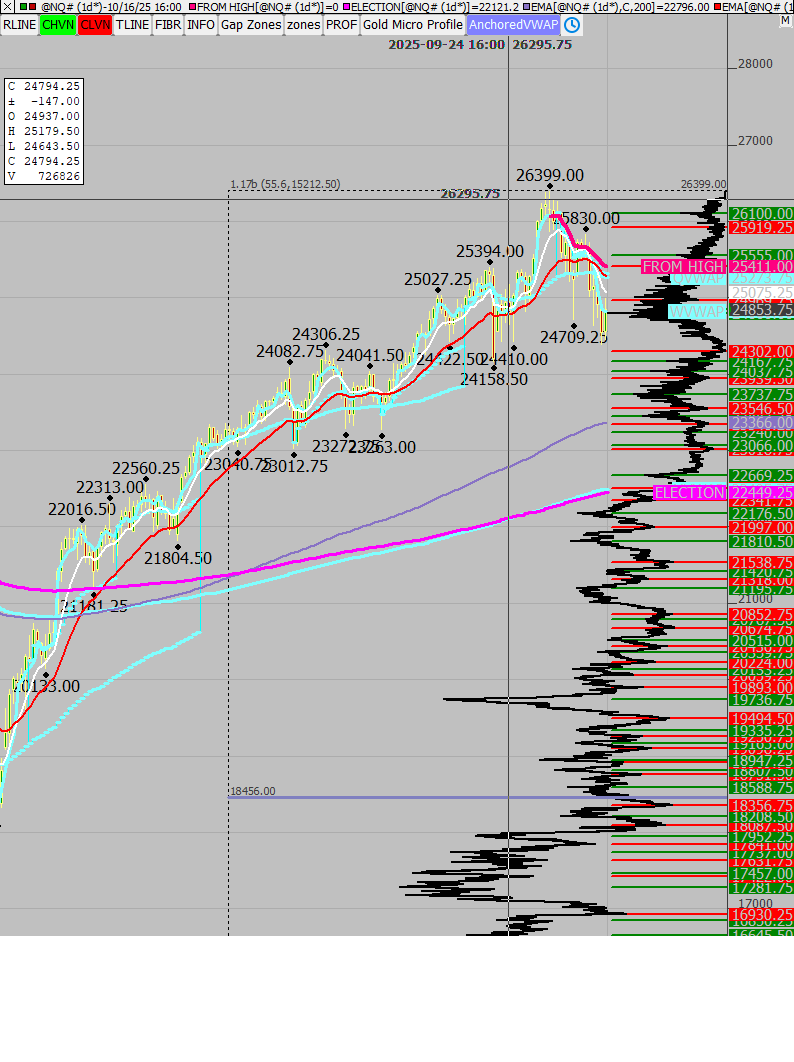
This chart was uploaded by Investor/RT 15.1.25 showing symbol: @NQ#.
This chart was uploaded by Investor/RT 15.1.25 showing symbol: @NQ#.
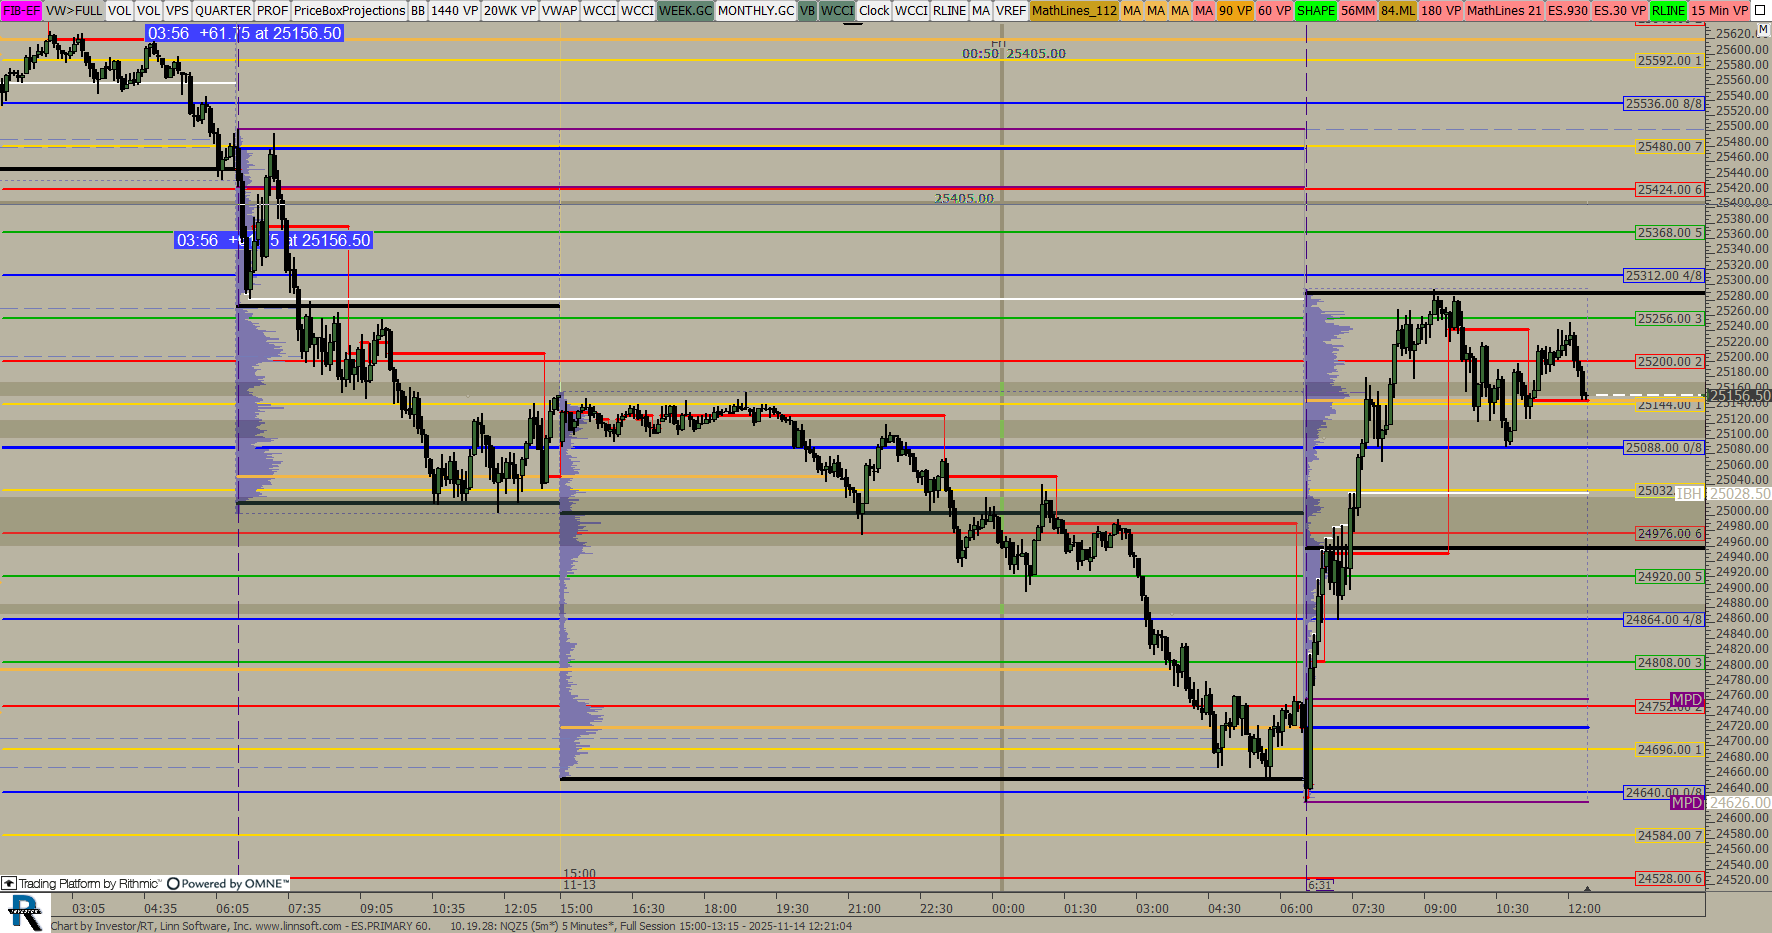
This chart was uploaded by Investor/RT 15.1.25 showing symbol: NQZ5.
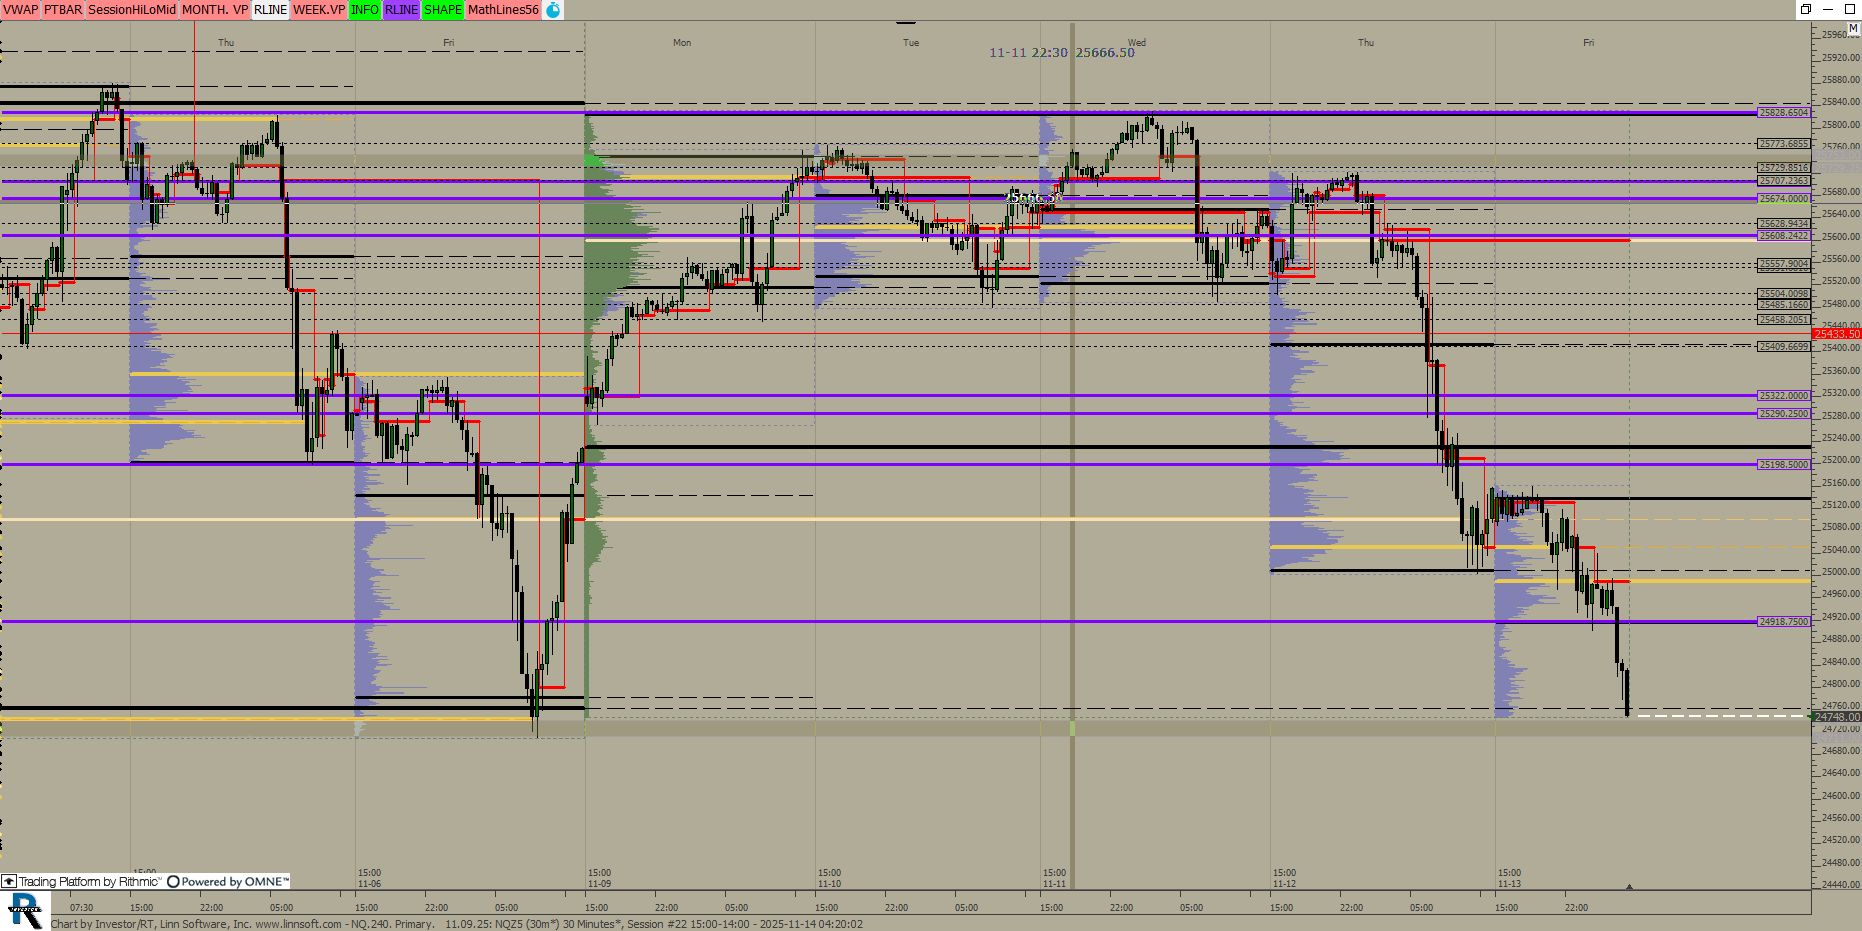
This chart was uploaded by Investor/RT 15.1.25 showing symbol: NQZ5.
This chart was uploaded by Investor/RT 15.1.25 showing symbol: NQZ5.
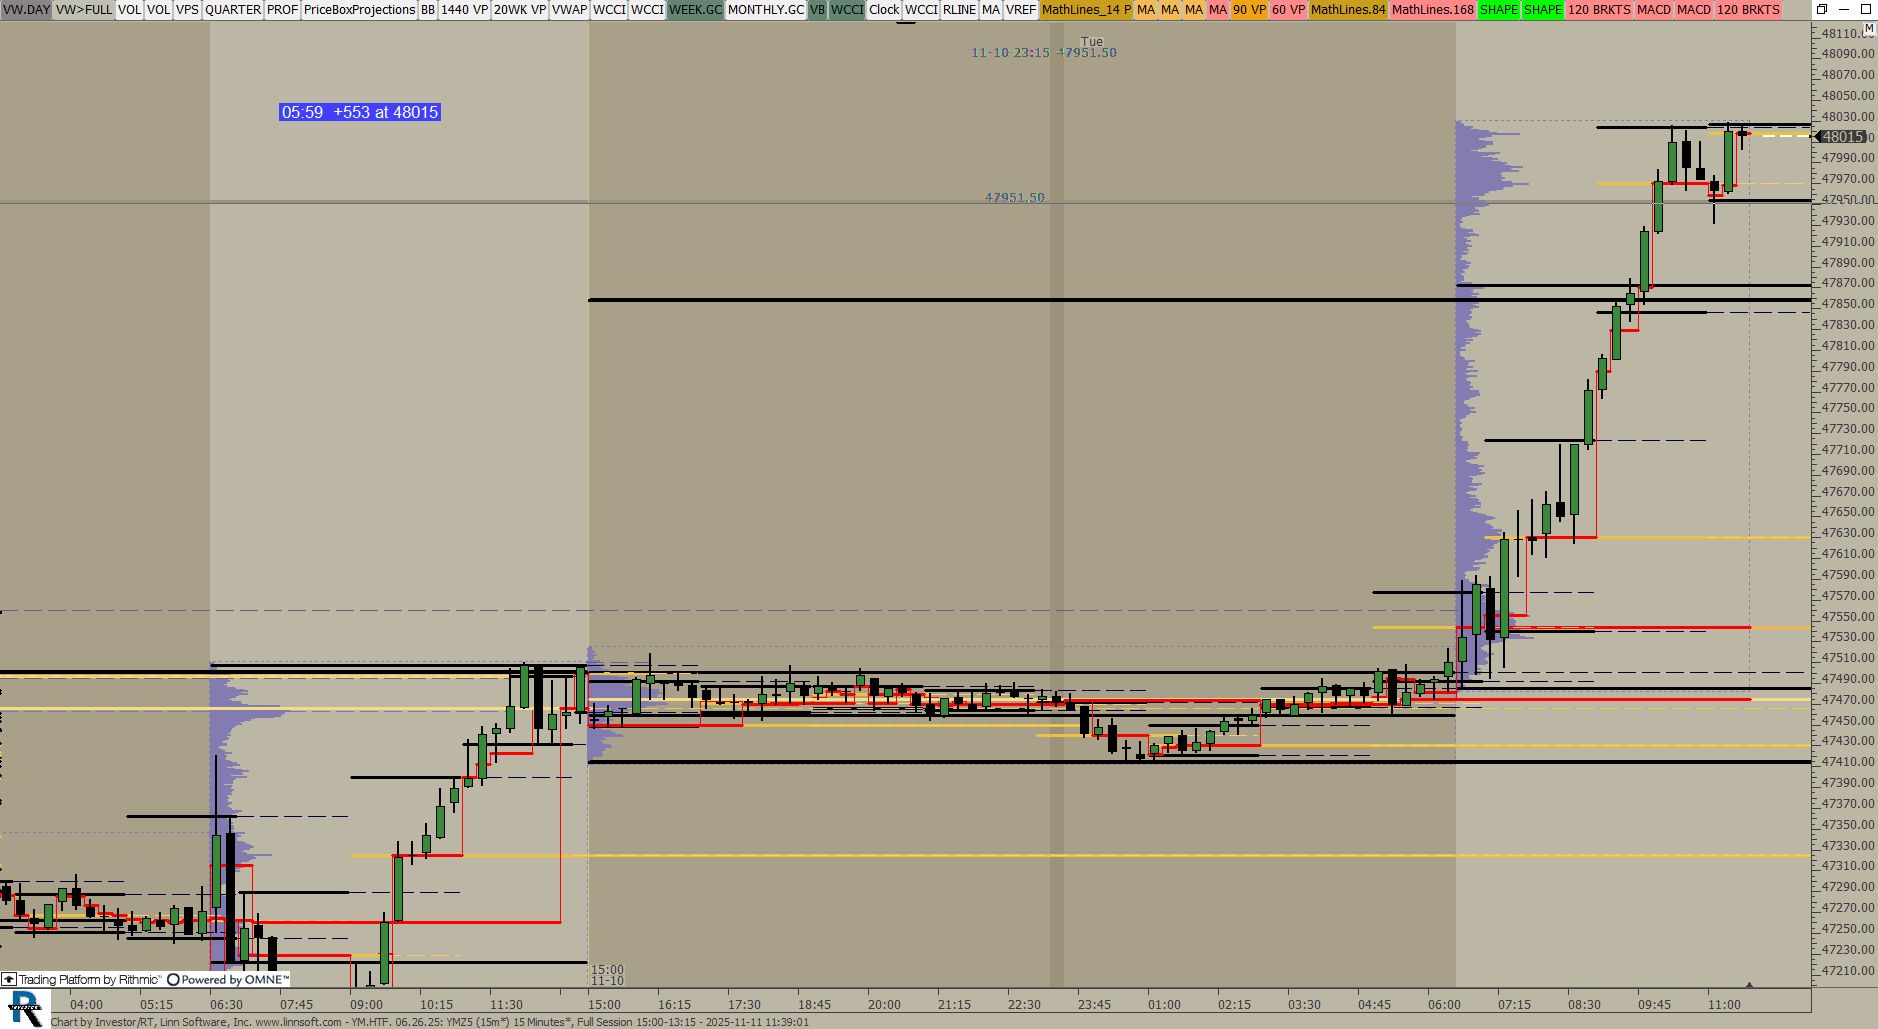
This chart was uploaded by Investor/RT 15.1.25 showing symbol: YMZ5.
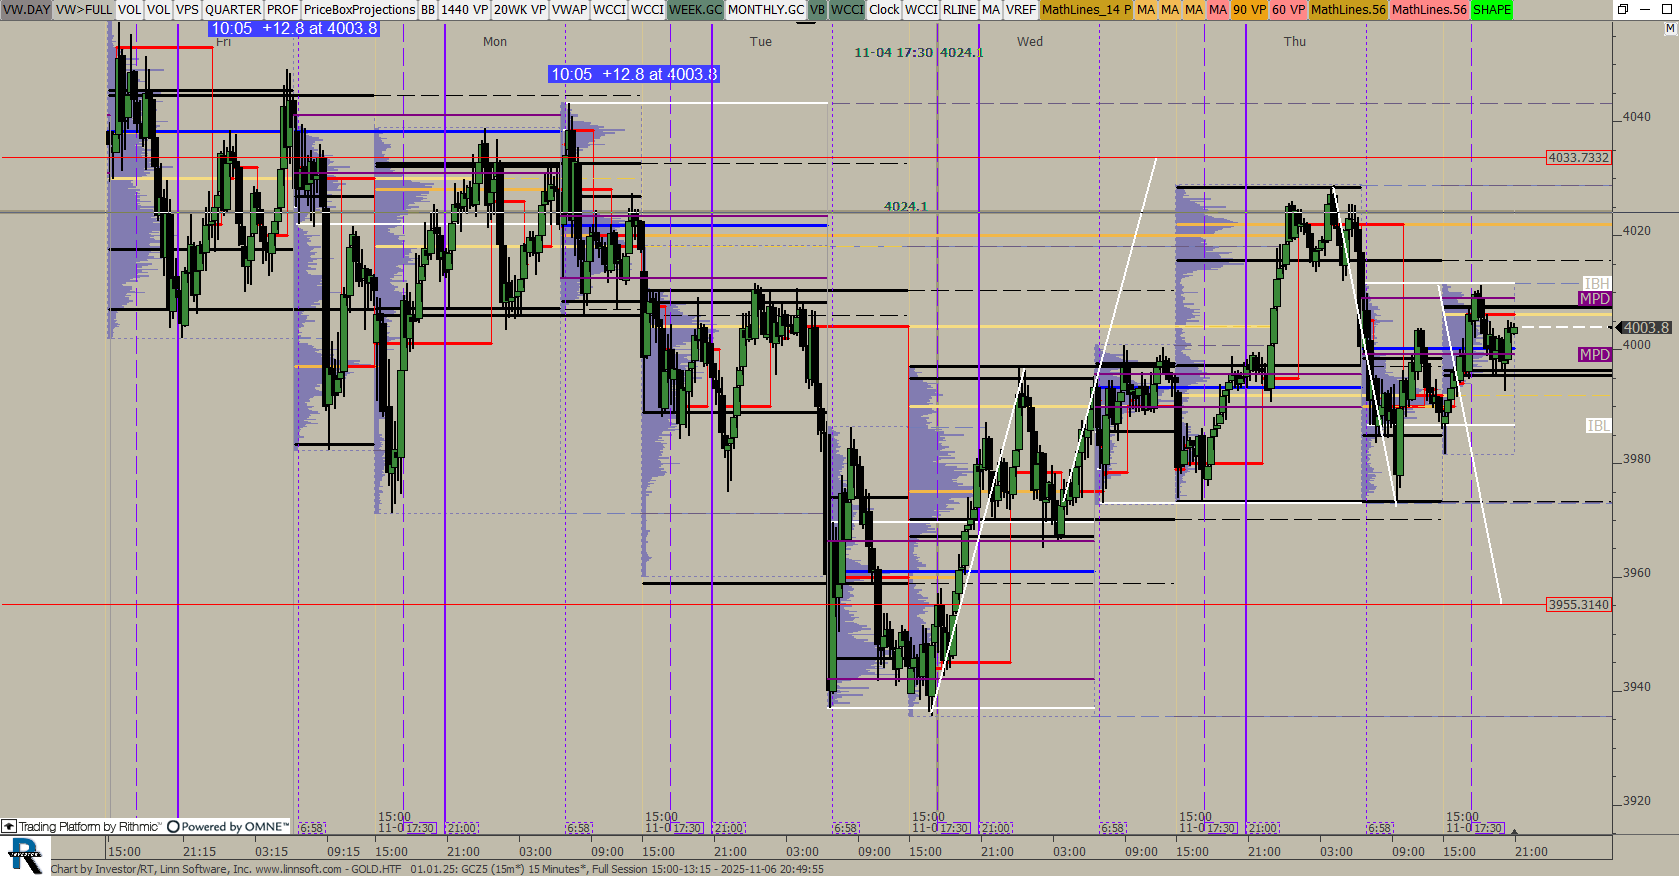
This chart was uploaded by Investor/RT 15.1.25 showing symbol: GCZ5.
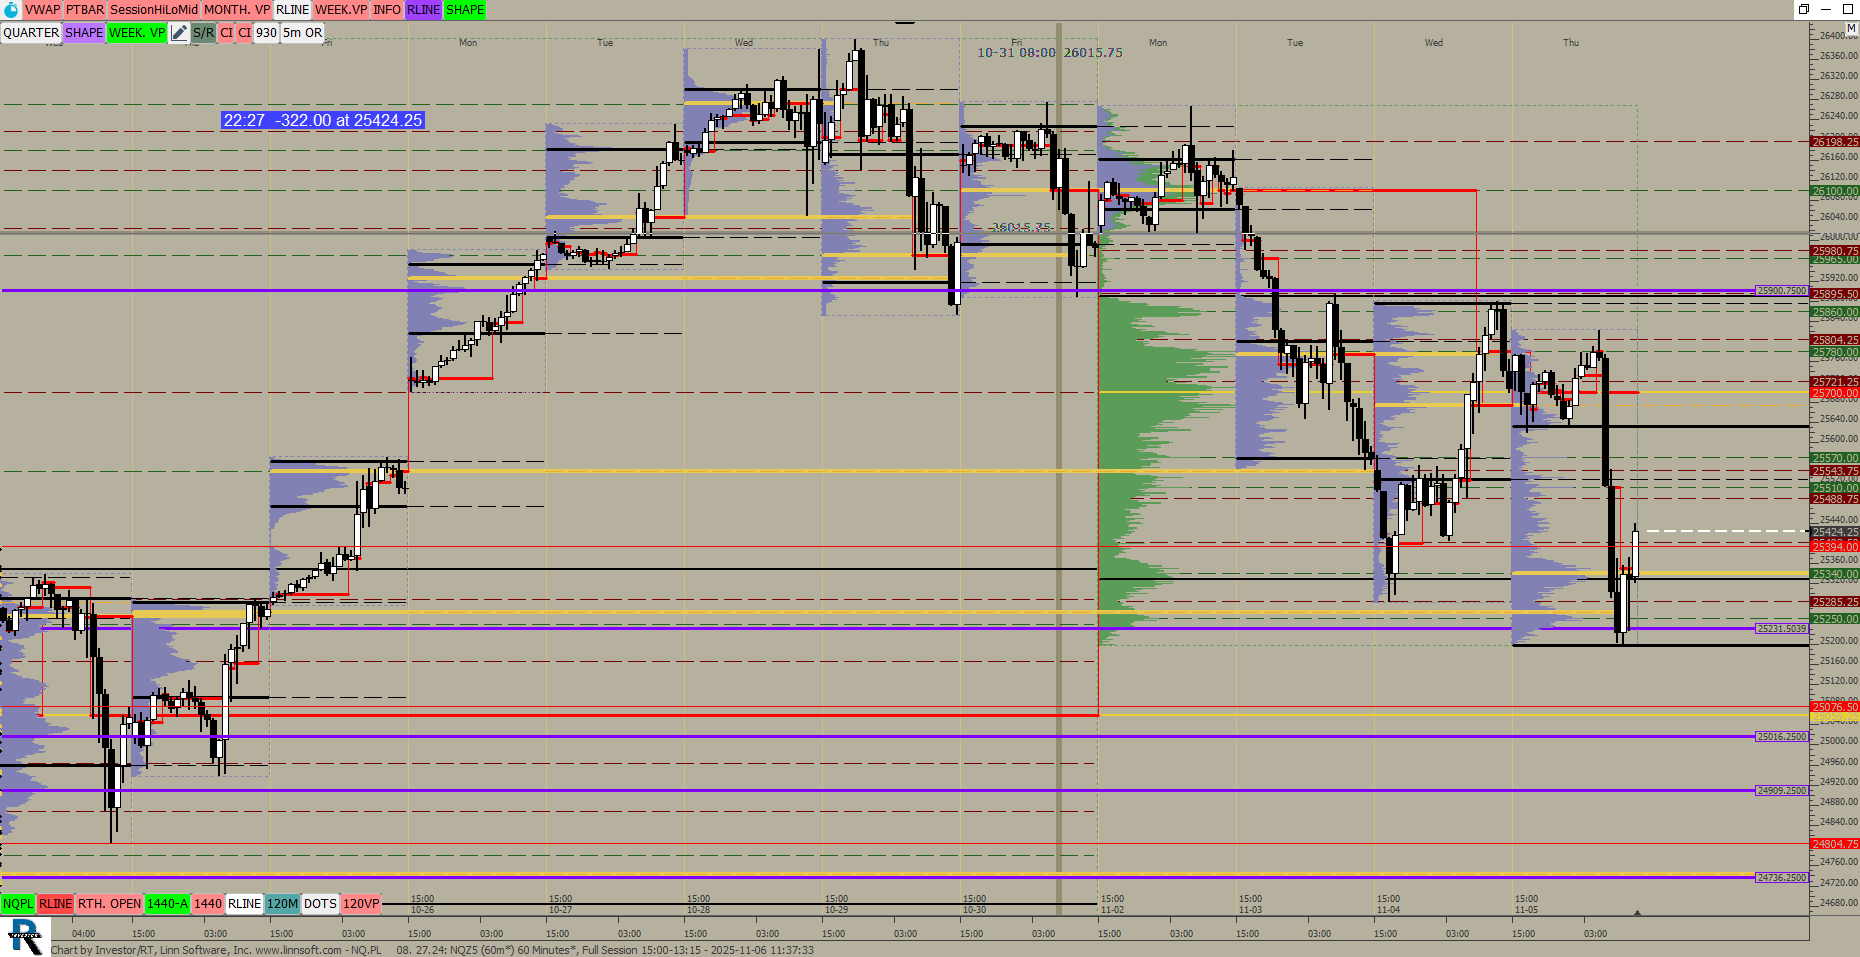
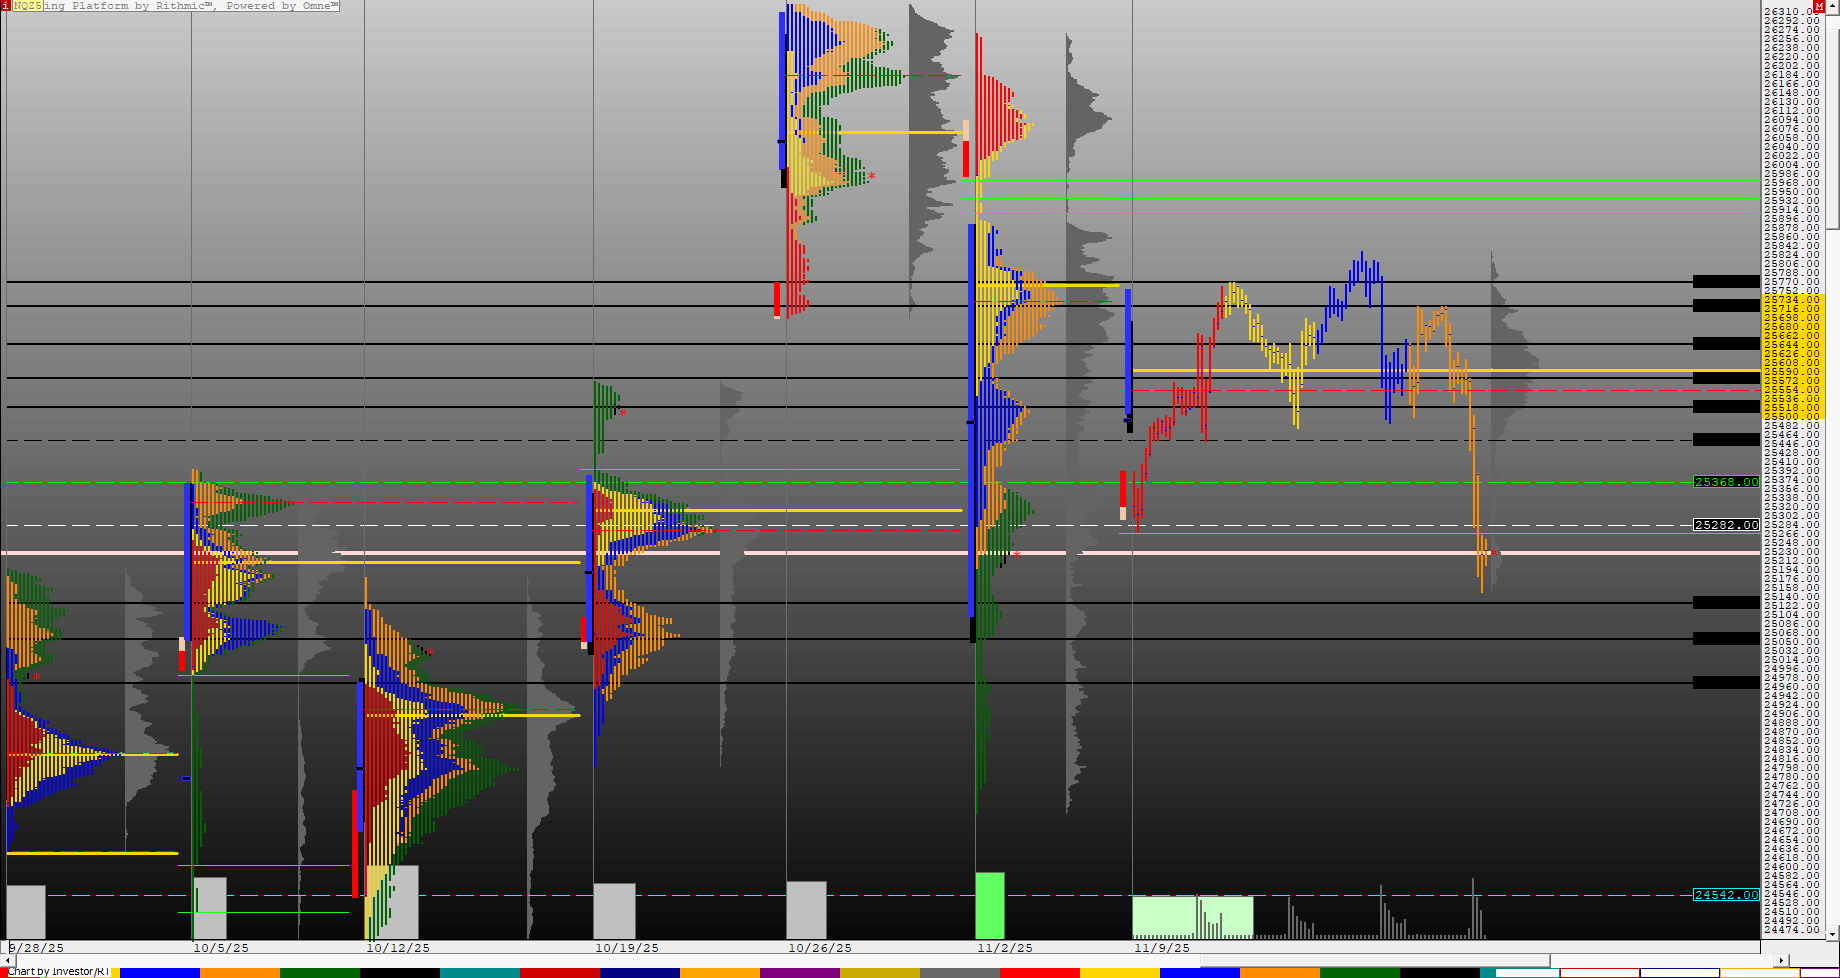
This chart was uploaded by Investor/RT 15.1.25 showing symbol: NQZ5.
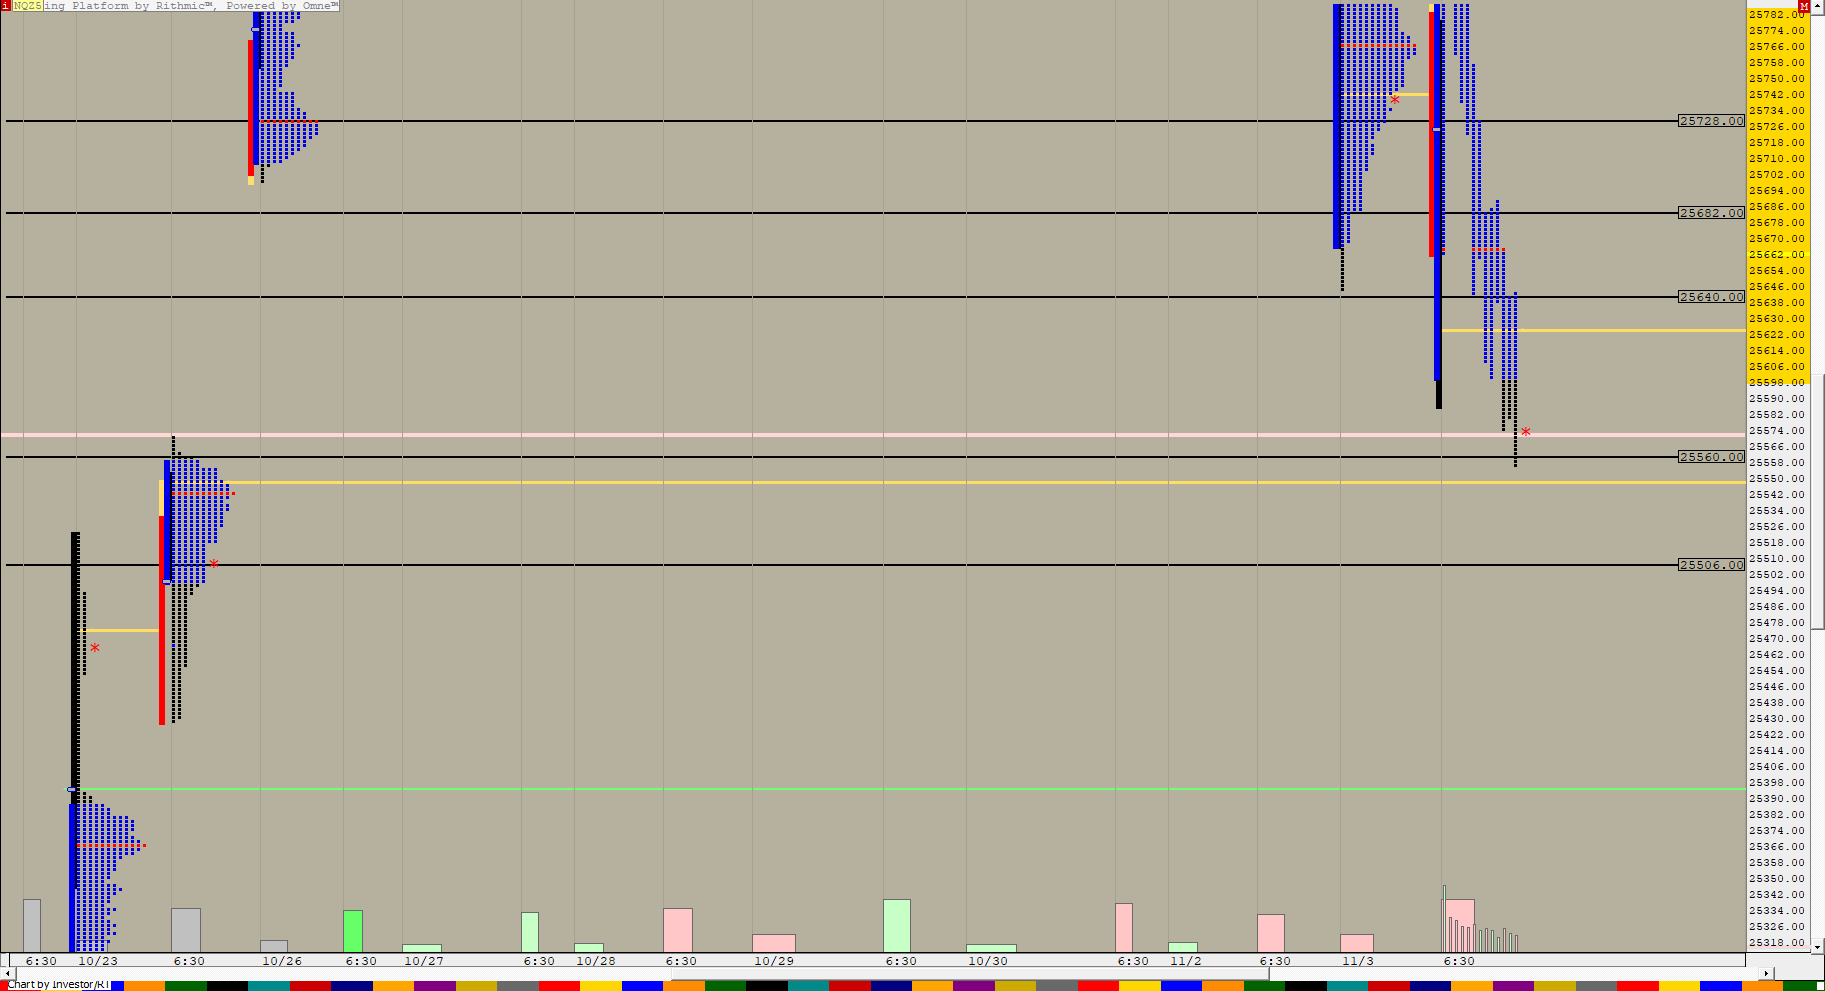
This chart was uploaded by Investor/RT 15.1.25 showing symbol: NQZ5.
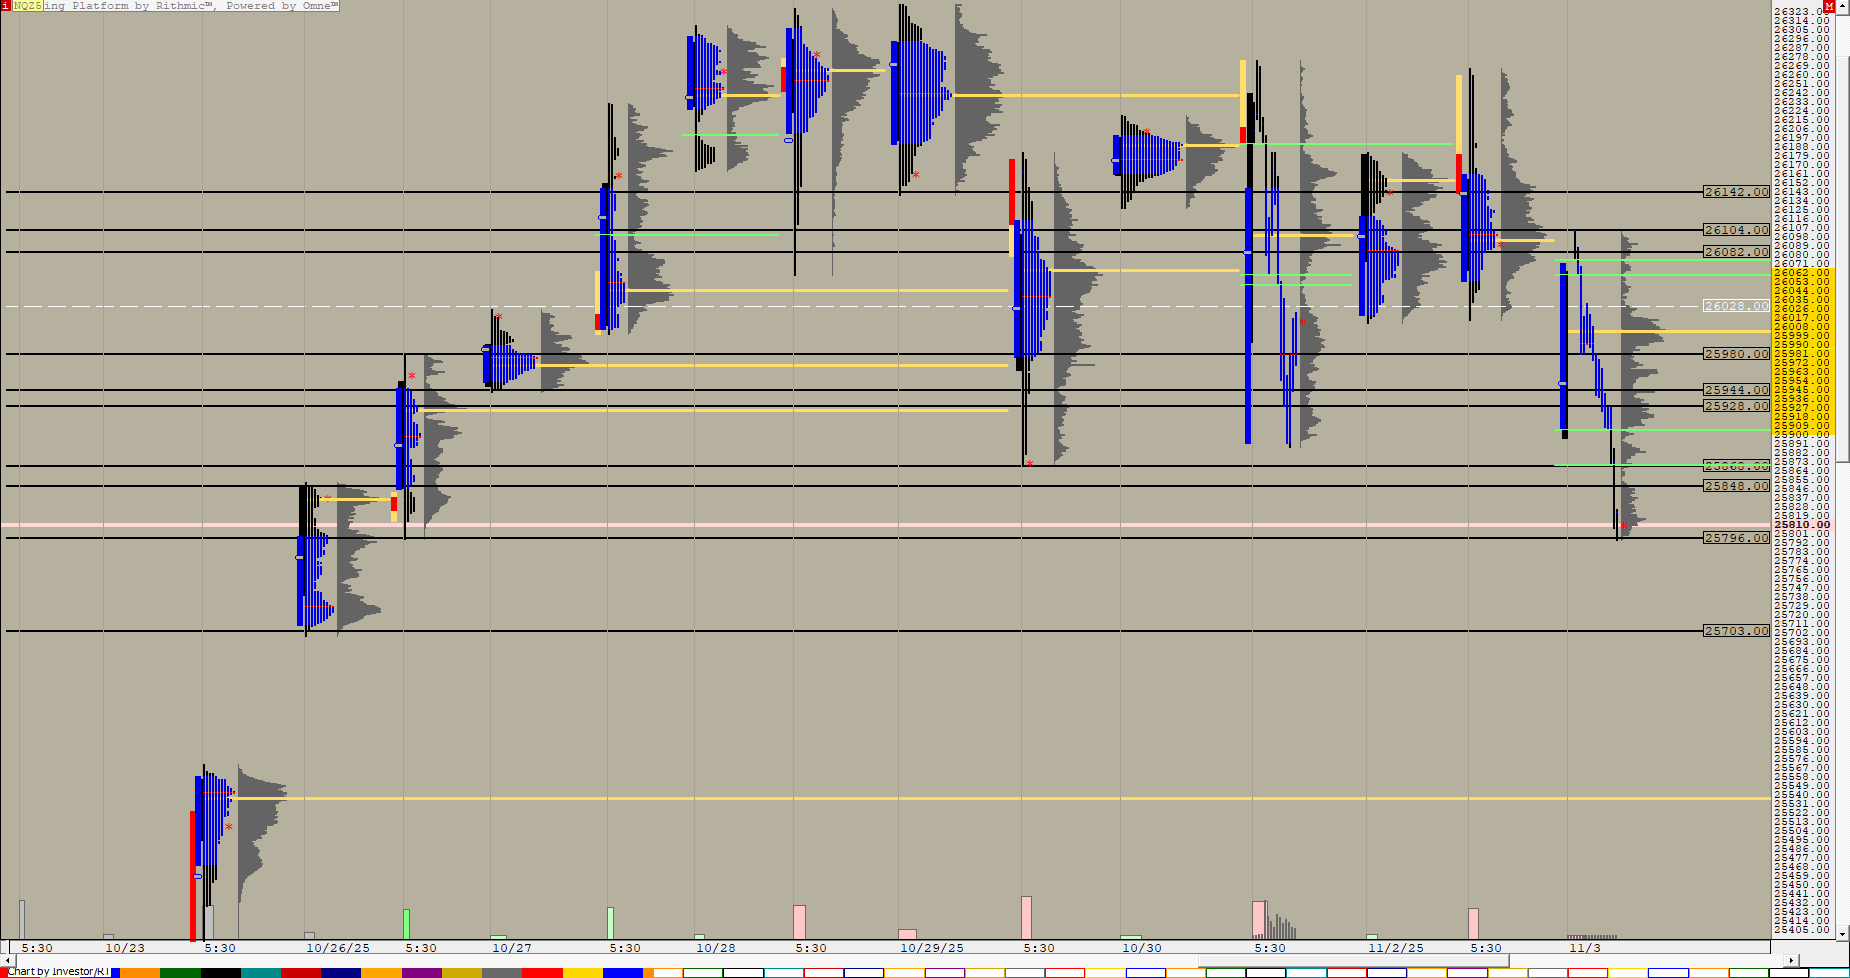
This chart was uploaded by Investor/RT 15.1.25 showing symbol: NQZ5.
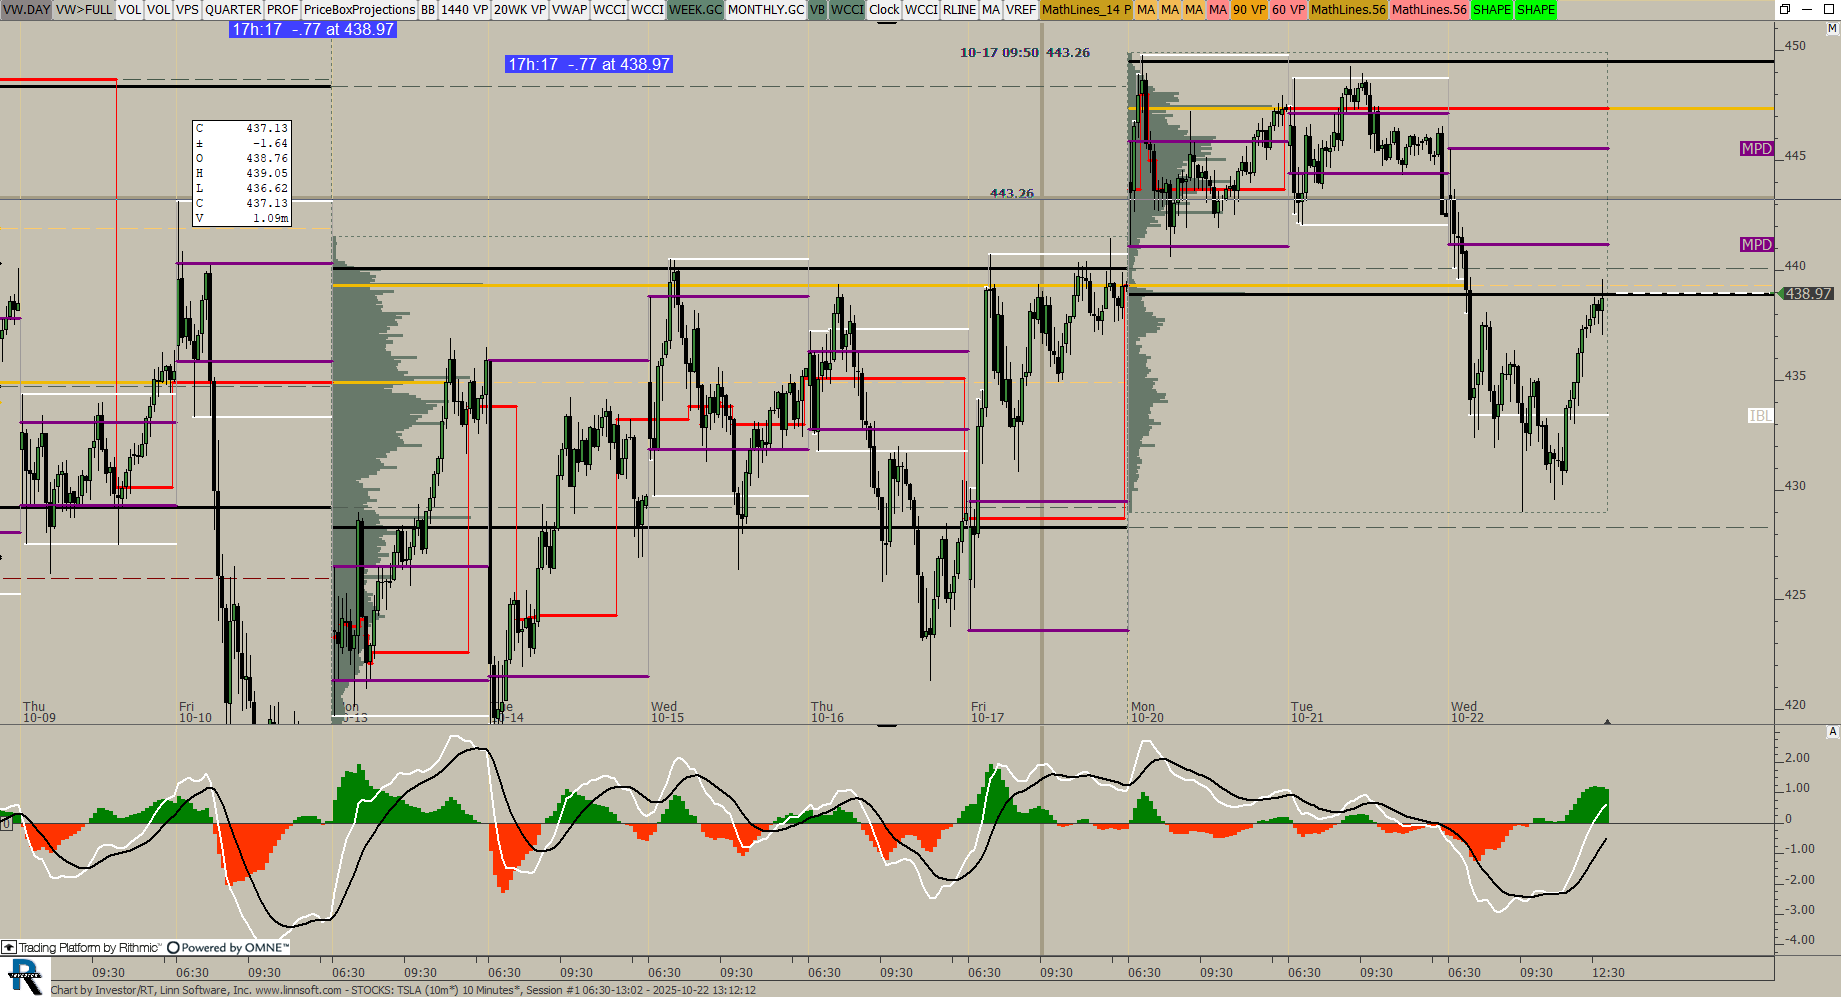
This chart was uploaded by Investor/RT 14.5.4 showing symbol: TSLA.