
This chart plots the Cumulative Tick in the lower page: https://www.linnsoft.com/charts/cumulativetick-es
In the upper pane is 1-min ES. In the middle pane is 1-min TICK.Z (NYSE Cumulative Tick). The lower pane is the cumulative tick which simply sums up the closing price of each 1-min bar of the TICK.Z (using the Session Statistics Indicator). This chart is designed for use with the DTN IQFeed data service.
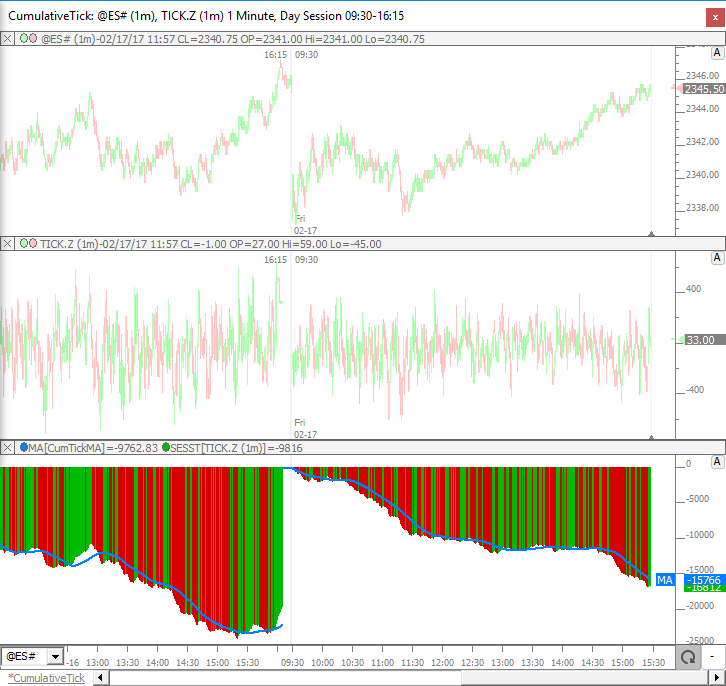
To add an indicator to the Cumulative Tick, such as a moving average, simply create a custom indicator which applies that moving average (or other indicator) to the Session Statistics settings which were used to create the custom tick. The syntax would simply be...
MA(SESST)
The chart definition in the post above includes a moving average (blue line) overlaying the Cumulative Tick. The custom indicator must be associated with the TICK.Z symbol to work properly. To change the associated instrument of any indicator (when there are multiple instruments in the charts as there are here: @ES# and TICK.Z), simply right-click on the indicator and select "Associate" from the popup menu.
Hey Chad,
Thanks for posting the cumulative tick indicator.
How can I add a filter to the cumulative tick such that it sums ONLY IF TICK.Z is greater or less than a certain threshold?
For example, suppose I want to sum TICK.Z ONLY IF it's greater than +200 or less than -200.
In other words, I want to filter out from SESST if TICK.Z is between +200 and -200; in this case, SESST would print the last value, and go flat [SESST = SESST.1] until TICK.Z moves above +200 or below -200.
Thanks again!
Just to confirm, you want to sum up the 1-min closing prices of TICK.Z but only those that are outside the -200 / +200 area?
Or, do you want to consider every tick of TICK.Z when performing this filtered accumulation?
Import this chart definition: https://www.linnsoft.com/charts/tickz-sumextremes-tickz
Use the button at top to adjust the 200 magnitude. This is a tick chart (TICK.Z ticks once per second) which sums all ticks that are outside the -200 / +200 area. If you don't want to consider every tick, but only the close of each 1-minute bar, simply change periodicity to 1-minute (or any periodicity for which you only want to consider the closes of those bars).
Thank you, man.
Appreciate the fast reply, especially on a weekend.
Chad, I see you are using the IQFeed symbol TICK.Z (NYSE Net Tick) for the cumulative tick chart rather than the IQFeed symbol JTYT.Z (NYSE Only Net Tick). I've been using the latter. Why have you selected the composite tick that encompasses all U.S. exchanges that trade NYSE-listed equities? Perhaps the larger sample size?
Thanks, Andy Barnes
No particular reason. Should work for both. I believe the user that initially asked for this may have mentioned TICK.Z so that is what I used when creating the chart.
This chart definition takes the cumulative tick and presents it in candle format providing the open, high and low in addition to the close on each bar.
Chart Definition: https://www.linnsoft.com/charts/cumulativetick-es