Other

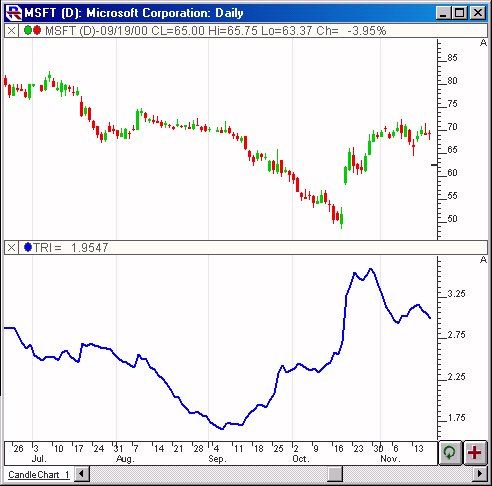
True Strength Index (TSI)

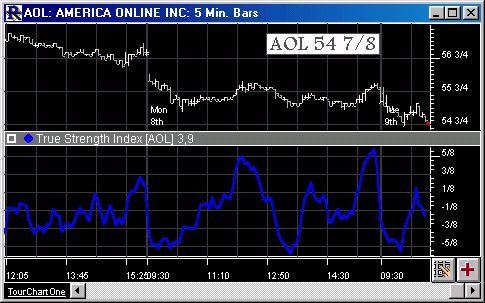
True Strength is a variation of the Relative Strength indicator. It uses a double smoothed exponential moving average of price momentum to eliminate choppy price changes and spot trend changes. This indicator has little or no time lag. An increasing True Strength value indicates increasing momentum in the direction of price movement.

True Range (TR)

Welles Wilder described these calculations to determine the trading range for a stock or commodity. True Range is defined as the largest of the following:

  • The distance from today's high to today's low.
  • The distance from yesterday's close to today's high.
  • The distance from yesterday's close to today's low.

Wilder included price comparisons among subsequent bars in order to account for gaps in his range calculation.

Trading Note Markers

Similar to News Markers, the trading notes marker indicator places markers on the chart for each bar that has an associated trading note. When you enter trading notes for an instrument you can specify the exact date and time of the note. Whether you are viewing a daily or intra-day chart the marker will be placed on the bar with the closest date time of each trading note.

Three Line Break Oscillator

The Three Line Break Oscillator (TLBOSC) was designed to give Three Line Break users an indicator on traditional charts that clearly shows all relevant TLB information (reversal price, current price, extreme price, etc.) in a flexible and vertically condensed fashion. The indicator oscillates about the zero line. Crossing above the zero line represents a positive TLB reversal (buy signal), and crossing below the zero line represents a negative reversal.

Three Line Break Indicator (TLB)

The Three Line Break Indicator calculates columns just like the Three Line Break Charts. There are however a couple of advantages to being able to add TLB as an indicator on a chart. First, you can overlay the traditional bar data on top of the TLB data to see exactly where in time the reversals occurred and the amount of time that was spent in each column. Also, this provides the ability to apply all other technical indicators to PNF data, such as moving averages, reference lines, etc.

Trend Intensity Index (TII)

Trend Intensity Index (TII) is based on an article by M. H. Pee that will be available in the June 2002 issue of Stocks and Commodities Magazine. TII is used to indicate the strength of the current trend in the market. The stronger the current trend, the more likely the market will continue moving in the current direction. It is recommended to enter the market during a strong trend and ride it until TII shows signs of a reversal, at which time you should abandon your position and prepare to enter in the opposite direction. Pee recommends using a major period of 60 and a minor period of 30.

Trend Detection Index (TDI)

The Trend Detection Index (TDI) was introduced by M. H. Pee. TDI is used to detect when a trend has begun and when it has come to an end. The TDI can be used as a stand-alone indicator or combined with others; it will perform well in detecting the beginning of trends. TDI should be used in conjunction with protective stops as well as trailing stops. These stops are required to protect against large losses when the indicator generates a losing trade. The TDI can trade a diverse portfolio of markets profitably over many years, using the same parameters throughout.

DeMark Range Expansion Index

The DeMark Range Expansion Index is a market-timing oscillator described in DeMark on Day Trading Options, by T.R. DeMark and T.R. Demark, Jr., McGraw Hill, 1999. The oscillator is arithmetically calculated and is designed to overcome problems with exponentially calculated oscillators, like MACD. The TD REI oscillator typically produces values of -100 to +100 with 45 or higher indicating overbought conditions and -45 or lower indicating oversold. DeMark advises against trading in extreme overbought or oversold conditions indicated by six or more bars above or below the 45 thresholds.

T3

T3 is an adaptive moving average. It tracks the time series more aggressively when making large moves. It is discussed in the Stocks and Commodities article "Smoothing Techniques For More Accurate Signals" V16:1 (33-37).

Pages