Smoothing

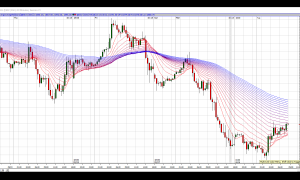
Moving Average Ribbons (RTX)

The Moving Average Ribbons Indicator allows users to set an initial Moving Average Period (Period Start) along with the desired number of Moving Average Lines (Lines) and the amount that each subsequent Moving Average should be incremented as it is added to the chart (Period Inc.). The general interpretation of this Indicator is that when all the averages are moving in the same direction, the trend is said to be strong. Reversals are confirmed when the averages crossover and head in the opposite direction.

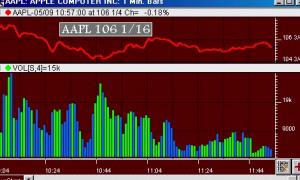
Volume Analysis (VMA)

The Volume Analysis Indicator computes a moving average of volume. It provides a more detailed look at volume trends than can be observed using the default volume histogram below price charts. You may use this feature repeatedly to overlay multiple analyses on the same chart. The Moving Average type may be specified as simple, exponential, weighted, Welles Wilder, or Least Square. You may specify the number of periods over which the volume is averaged. Specify a period of 1 to see the raw volume for each bar (no smoothing). The graph may be displayed as a Line or Histogram.

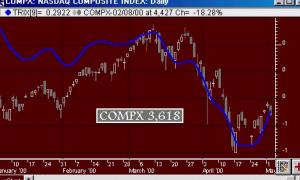
TRIX Triple Smoothed Exponential Oscillator

The TRIX is a momentum indicator that calculates the percent rate of change of a triple smoothed exponential moving average of closing price. It is a leading indicator, in that it is designed to signal trends shorter than the time sample used to calculate the TRIX. However, you introduce more lag time into the indicator response as the moving average period is increased. The TRIX oscillates around a zero line. Trading opportunities arise when the TRIX graph changes direction. Buy when the slope of the TRIX line turns positive or crosses zero from below.

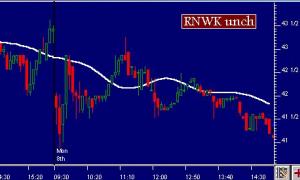
Triple Smoothing (TRIP)

The triple smoothing indicator can be used to compute and graph either a double or triple smoothing of the price data for an instrument. Each smoothing moving average has its own period and type specification. The first moving average is applied to the raw price data of the instrument. The second moving average is then applied to the first result. If triple is selected, the third moving average is then applied to the second result. Double or triple smoothed moving averages can be used instead of single moving average lines to look for trading signals as two moving average lines cross.

Parabolic SAR (SAR)

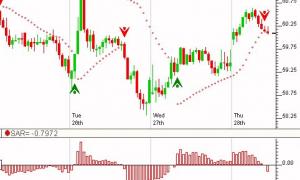
The Parabolic SAR, developed by Welles Wilder, is used to set trailing price stops. SAR refers to "Stop-And-Reversal". It is designed to create exit points for both long and short positions in such a way that it allows for reactions or fluctuations at the beginning of the position, but accelerates upward (for long positions) or downward (for short positions) as the movement tops out. Parabolic SAR is plotted around the price chart similar to a moving average. The Parabolic SAR provides excellent exit points. Wilder suggests using this indicator in a trending (or directional) market.

Relative Slope (RELS)

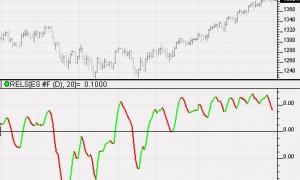
Authored by Dimitris Tsokakis, the relative slope takes an exponential moving average of typical price (HLC/3), commonly a 20 period EMA but the period is customizable. It then takes the resulting values, and for each value, the previous value is subtracted and the result is divided by the sum of the two values. These results are then further smoothed with a 3 period EMA. A common system for trading the RELS would be to buy when it turned positive:

RELS > 0 AND RELS.1 <= 0

and sell when it turned negative:

RELS < 0 AND RELS.1 >= 0

Modified Moving Average

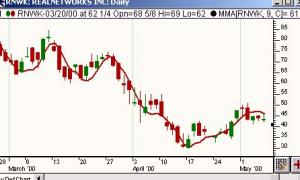
The Modified Moving Average is an algebraic technique that makes averages more responsive to price movements. The average includes a sloping factor to help it catch up with the rising or falling value of the security.

Moving Average Channels

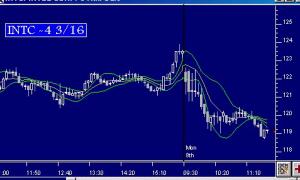
Moving average channels use a moving average of price to create an envelope above and below the moving average line at a user specified number of standard deviations. The point of this study is to create a channel which represents support and resistance at its outer bounds based on the moving average. As always, the period of the moving average should match the trading time horizon of interest to the user. As price moves above its n-period moving average, a bullish indication is noted. Conversely, a price move below its x-period moving average is a bearish event.

MESA Adaptive Moving Average (MAMA)

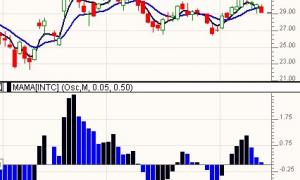
The MESA Adaptive Moving Average adapts to price movement based on the rate of change of phase as measured by the Hilbert Transform Discriminator. (Stocks and Commodities, Dec. 2000, p. 19).This method features a fast attack average and a slow decay average so that composite average rapidly ratchets behind price changes and holds the average value until the next ratchet occurs. The complex calculations of the MAMA can be seen above. For a more detailed description of MAMA, see "Mesa Adaptive Moving Average", Stocks and Commodities Magazine, August 2001.

Indicator Weighted Average (IWA)

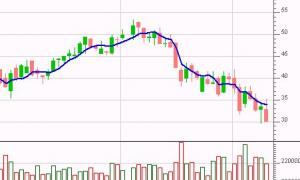
The IWA is a moving average that is weighted using another indicator. The weighting can be based on any of the built-in indicators in Investor/RT or any user-defined custom indicators written in RTL. The IWA gives the user control over the period, the price data to be weight-averaged (close, high, low, open, hi +lo/2, ohlc/4, etc.), and the indicator used to weight the data. When you choose a weighting indicator, you specify the preferences relevant to that indicator. The IWA makes it easy to code weighted average indicators such as the VWAP. For the example above, we show the VWAP.

Pages