Smoothing

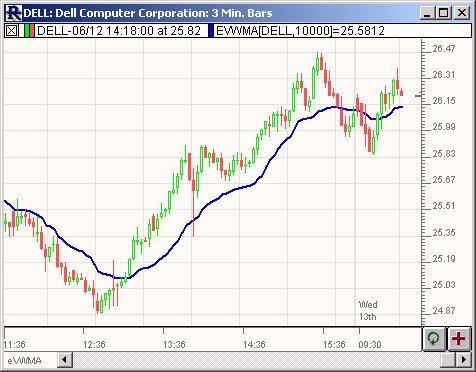
Indicator Adjusted Average (IIA)

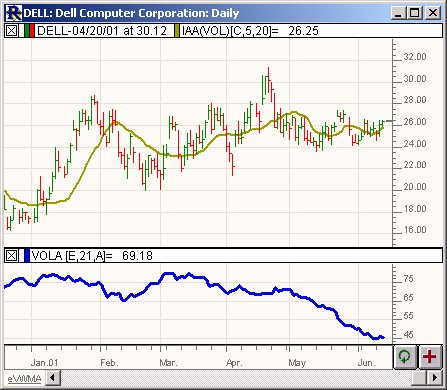
Indicator Adjusted Average computes a Moving Average whose period varies within a specified range and is determined based on the value of another indicator within that indicators range. The indicator used to control the variance of the moving average period can be any of the 80+ predefined indicators or even a custom indicator created using the Investor/RT RTL language.

Elastic Volume Weighted Moving Average (eVWMA)

eVWMA is a statistical measure using the volume to define the period of the moving average. It incorporates volume information in a natural and logical way. The eVWMA can be looked at as an approximation to the average price paid per share. The ability to "Use Average Volume" as your volume period, makes this indicator both symbol-independent and timeframe independent. This allows the use to switch both timeframe and symbol without having to change the volume period.

Elder's Force Index (EFI)

The Elder's Force Index uses volume and price change from previous close to determine the momentum behind a price move in a given direction. An increasing Force Index is indicative of strong interest in the direction of the price move while a decreasing Force Index suggests that price is moving counter to the major trend. It is calculated by exponentially smoothing the product of volume and the difference in price from previous close to current close. The default period in Investor/RT is 2 as suggested by the indicator's author, Alexander Elder.

Candle Codes

The Candle Code indicator is used to assign a numerical value to each candle based on five candlestick characteristics, including Body Color, Body Size, Upper Shadow, Lower Shadow, and Gap. Positive candle code values represent bullish candles while negative candle code values represent bearish candles. The more positive the code, the more bullish the candle. The more negative the code, the more bearish the candle. Each of the five candle characteristics can be weighted according to the user's preferences.

Bollinger Bands

Bollinger Bands are volatility based bands used to help identify situations where prices are too high, or too low, on a relative bases. When prices reach or rise above the upper band, they are too high. When prices reach or drop below the lower band, they are too low. Bollinger bands are calculated by first smoothing the typical price using the MA type and period specified. The typical price for each bar is defined as (high + low + close)/3. The standard deviation is then calculated for the series of typical prices.

Adaptive Moving Average (AMA)

The adaptive moving average moves slowly when prices are moving sideways and moves swiftly when prices move swiftly. The basic rule is to buy when the AMA turns up, and sell when the AMA turns down.

ADXVMA

The ADXVMA is a volatility based moving average with the volatility being determined by the value of the ADX. The ADXVMA provides levels of support during uptrends and resistance during downtrends.

ADXR Avg. Directional Movement Rating

Average Directional Movement Rating quantifies momentum change in the ADX. It is calculated by adding two values of ADX (the current value and a value n periods back), then dividing by two. This additional smoothing makes the ADXR slightly less responsive than ADX. The interpretation is the same as the ADX; the higher the value, the stronger the trend.

Pages