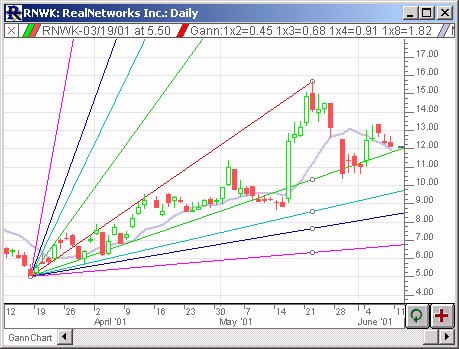
William Gann (1878-1955) developed a unique combination of geometric and mathematical principles, which he applied to trading stocks and commodities. The...
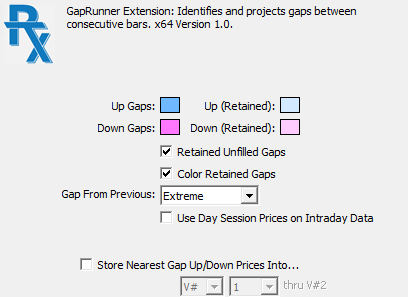
The GapRunner RTX Extension is designed to identify gaps between bars and between sessions and extend those gaps until price returns to fill them. Gaps...
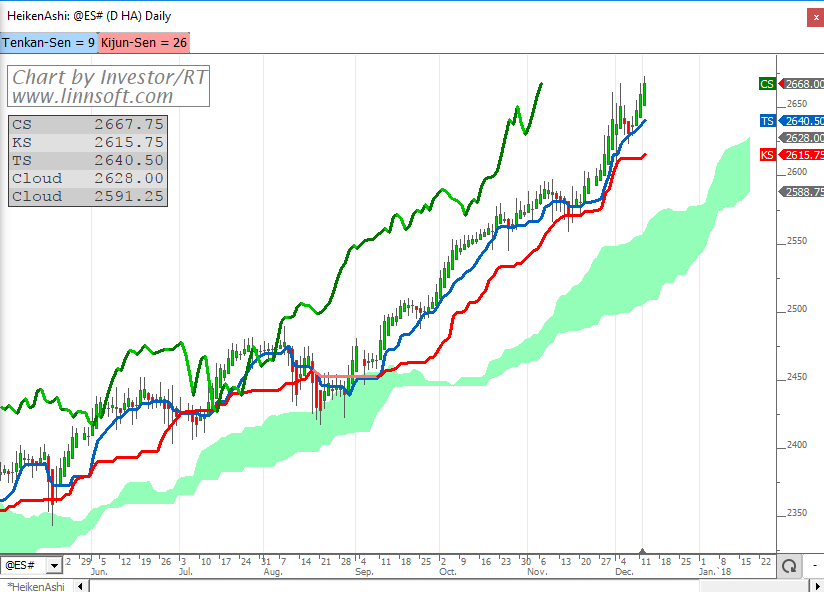
Below is a chart of Heiken Ashi bars with Ichimoku Kinko Hyo indicators. Use the link to access the definition and import into Investor/RT. A full explanation...
Got your tree up yet? You stare at your charts all day. Why not spruce them up with a little holiday cheer? Introducing Holiday Tree (RTX), a whimsical...
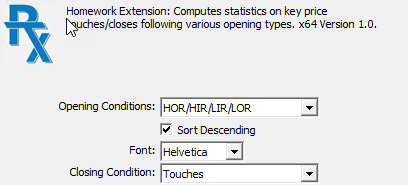
Charts including the Homework RTX indicators are not intended to be run with live data during the RTH session! It won't provide any detailed information for...
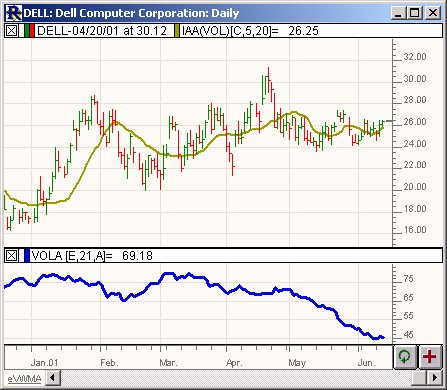
Indicator Adjusted Average computes a Moving Average whose period varies within a specified range and is determined based on the value of another indicator...
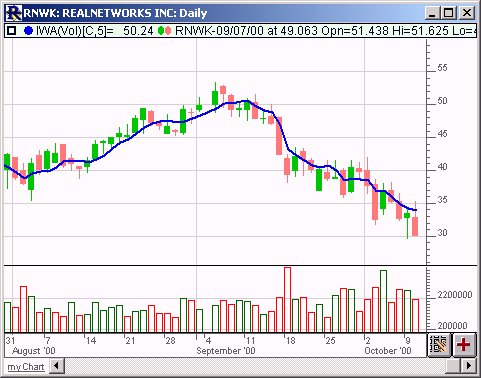
The IWA is a moving average that is weighted using another indicator. The weighting can be based on any of the built-in indicators in Investor/RT or any user-...
The Keltner Channel is a volatility-based indicator which makes us of the "envelope theory" and uses the range of high and low. Moving average bands and...
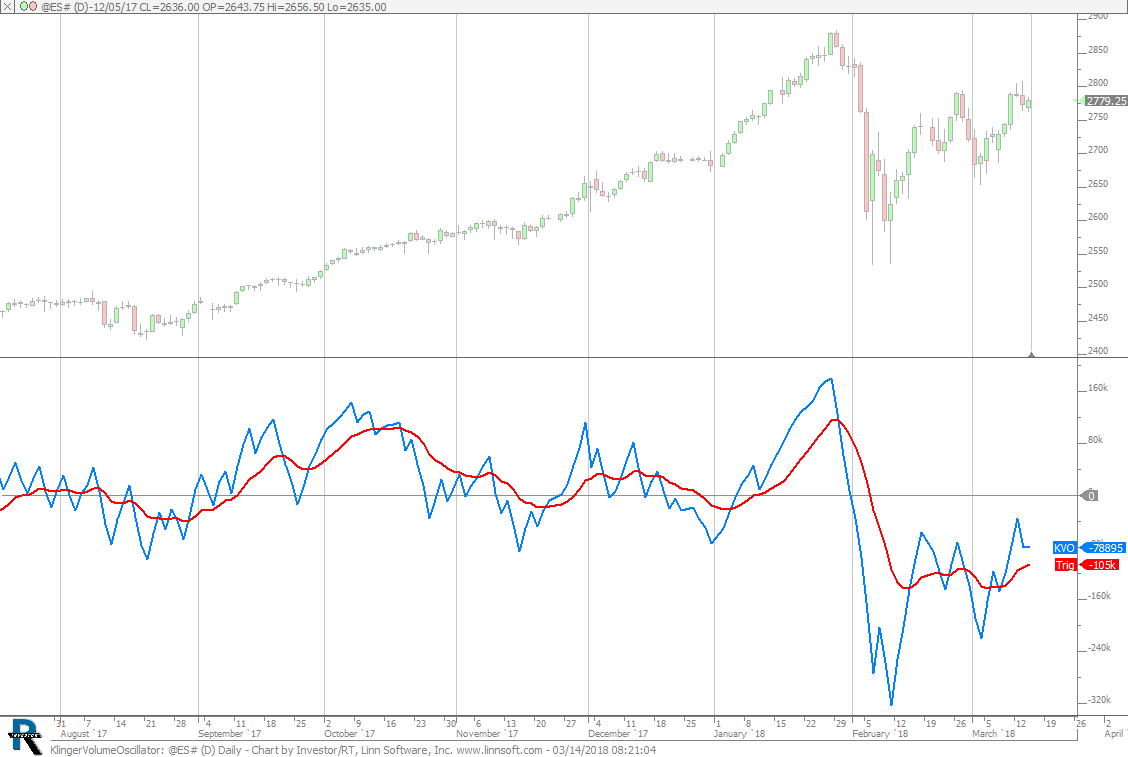
Klinger Volume Oscillator. This chart was uploaded by Investor/RT 13.2.5 showing symbol: @ES#.
Linear regression is a statistical tool used to predict the future from past data, and commonly used to determine when prices are overextended. The Investor/RT...
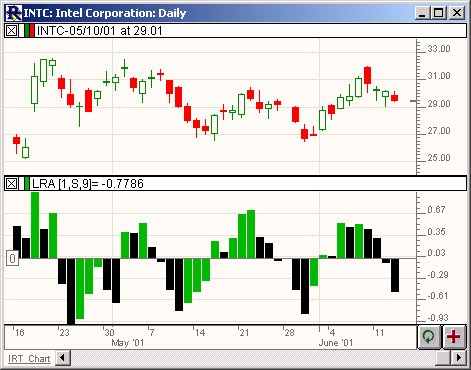
First, the data, based on the price selected, is smoothed using the moving average period and type. If you prefer no smoothing, choose a period of 1 here. The...