
Investor/RT Version 12.5 Release Notes
Released March 11, 2016
 Volume Filtered Tick Charts
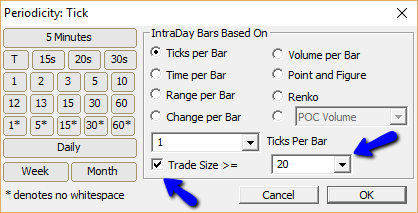
When periodicity is specified as 1 Tickbar (every bars is a single tick or trade), a "Size >=" filtering option is now available which will limit the charted ticks to those at or above a user-specified size. For active instruments, a 1 tickbar chart can be very inefficient with sometimes 100s of bars forming in a single second and millions upon millions of 1 tickbars loaded in chart. Adding a tick filter can greatly increase the efficiency of such charts and allow a user to focus only on larger trade size and perform analysis on such filtered data.
 QuoteBoard and InfoBox Exporting
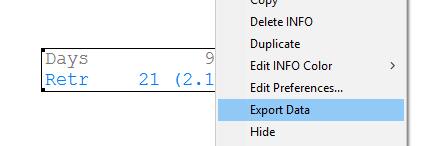
The QuoteBoard and InfoBox may now be easily exported to a text file by right-clicking on the respective indicator and "Export Data". When exporting QuoteBoard data, all data visible in the chart is replicated in a comma separated file which opens nicely in Excel (and will open up automatically in Excel). When exporting InfoBox, all the indicator data that is displayed in the InfoBox will be exported to a commaseparated file. This makes it easy for user to take the data analysis produced and displayed by these indicators and quickly move that data to a report, a chat room, an email, etc.
- Changing Periodicity When Scrolled Back
A new option was added which forces charts to remain scrolled back when changing periodicities. In previous versions, when a user changed the periodicity of a chart, the chart automatically scrolled to present. A new configuration variable, ScrollPresNewPdcity, has been added. When this variable is set to false, charts will retain their scrolled back state when changing periodicity. This makes it much easier for users to scroll back and analyze past data across multiple periodicities.
Resetting One Day Charts at Open - A new configuration variable, ResetOneDayChartsOnOpen, has been added which forces charts with view period set to Last 1 Day to reset to current session only on the first trade of a new session. In previous versions, the new data would just append the previous session ultimately resulting in 2 charted days instead of 1. With the new variable set to true, charts will remove the previous day on the 1st trade of the new session allowing users to always look at just a single developing session.
Mixed Periodicity Data (MPD) and Align To Master - An important change was made to the MPD indicator in 12.5. When MPD is setup with "Mix Ticker" turned on, but "Mix Instrument" and "Mix Session" turned off, it will then use Align To Master automatically when loading the mixed data. This is important because some symbols don't mix well with some periodicities. For example, if a user is plotting ES with 3t Renko periodicity, but using MPD in a signal to grab the data of the NYSE Tick index, 3t Renko and data of indices often does not work well at all (resulting in possibly millions of bars). Forcing Align to Master in this situation results in the data of the index getting lined up bar for bar with the data of the ES using the timestamps of the ES bars and resulting in a 1 to 1 relationship between ES bars and MPD/Index bars. This change really increases the power and flexibility of an already very powerful and flexible MPD indicator.
 Profile Indicator Enhancements
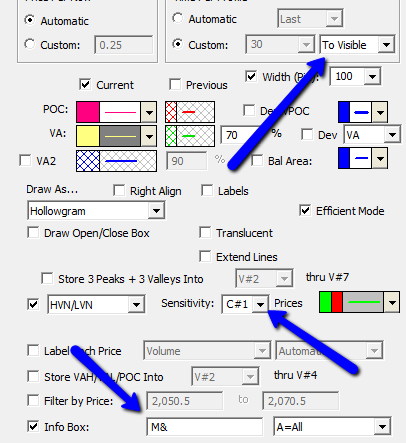
Two new data options were made available to the Profile InfoBox and a new custom duration "To Visible" was added to aid with playback of profiles. A custom duration option "To Present" has been available in Profile Indicator for quite some time, plotting a profile from any user-specified start point through present (current bar). In addition, a "Visible" option has been available which profiled all visible data and changed dynamically as the visible data changed (scrolling, resizing, zooming). These two options have been married into the "To Visible" option which allows the user to drag start of profile to any given bar/datetime and the profile will build from that point to the right edge of visible chart. This allows user to scroll the chart back, and pin a "To Visible" profile to the start of a session, and then scroll forward through that session and see how the profile developed bar by bar throughout the session. Same concept could be applied to seeing much longer term composite profiles develop over time, bar by bar or session by session. Also, 2 new data items were added to the InfoBox: Average Volume Per Price and Duration. Average Volume Per Price can be activated by entering the character M in the InfoBox parameter list at bottom of Profile Indicator preferences and divides the total volume of profile by the number of prices in profile. Duration can be activated by entering the character & in the InfoBox parameter list at bottom of Profile Indicator preferences and provides the duration of the profile in seconds. Also, the HVN/LVN sensitivity can now be supplied as a C# or V# variable instead of a constant integer. This allows users to dynamically adjust the sensitivity with a Button Indicator that sets the C# or V# value.
- Buttons for Showing, Hiding Indicators
Investor/RT has long offered chart buttons for quickly adding or removing indicator setups (called presets). Clicking a button adds a preset indicator to the chart or removes it if it is already present. Indicators toggled in this way do not consume resources except when present. Sometimes it is desirable to hide an indicator while keeping it active in the chart. In version 12.4 the chart element manager provides this capability; you may also click on the pane element menu at the top center of each pane to show/hide specific indicators or all indicators. In Version 12.5, a menu item for hiding an indicator is available in the right-click menu. Right-click on any indicator in the chart and choose Hide. The button indicator has similarly been enhanced to offer Show/Hide Indicator as a button purpose. Specify an indicator preset just as you do to create a button to Add/Remove some indicator. Clicking the button will then alternately Hide or Show that indicator. If you have an existing button for adding/removing an indicator, you may edit the button and revise its purpose to Show/Hide Indicator if you prefer. Note that hidden indicators become visible again the next time you reopen the chart.
- Scrubbing Holidays and Honoring Session
A new config variable, ScrubHolidayHonorSession, was added which forces the scrubbing of holiday data to honor the session of the symbol/instrument. A user may right-click on a chart (typically just after a holiday) and "Scrub Data: Holidays". In the past, that action would scrub all the data on the dates of holidays in the holidays file. With this new config turned to true, only the data of the session will be deleted. For instance, if ES is set to session 31 which goes from 4:30pm ET to 4:15pm ET, and 1/18/2016 is setup as a holiday in the holidays file, data from 1/17/2016 4:30pm until 1/18/2015 4:15pm will be deleted. This is different from before in that it removes any data on the evening of 1/17 and leaves the data on the evening of 1/18 (start of 1/19 session). This essentially results in removing "sessions" of data instead of "dates" of data. The holidays file may be accessed in the Object Manager by selecting Text Files: Holidays.txt.
Labeling Weekly and Monthly Pivots - While Pivots are typically built off daily data, the Pivot Point Indicator allows the user to build pivots using any periodicity including 30min, Weekly, Monthly, etc. In 12.5, when Weekly or Monthly data is used to build the pivots, the pivots will be labeled accordingly. Monthly levels will be labeled MPP, MS1, MS2, MR1, etc. Weekly levels will be labeled WPP, WS1, WS2, WR1, etc. This allows user to add daily, weekly, and monthly pivots to same chart and easily tell them apart using labels (different colors may also be used to easily differentiate).
- Zig Zag Indicator Export
Duration - Users may right-click on a Zig Zag indicator in a chart and choose Export Data and the result in a well formatted comma separated file showing various data items on each leg which opens automatically in Excel for analysis. In 12.5, a new column of data, Duration, was added, which provides the duration of each leg in seconds. The complete list of exported columns in 12.5: zzPrice,zzChange,zzVolume,zzDelta,zzBars,zzAvgSz,zzTrades,zzSlope,zzWave,zzVolBar,zzVolPrice,zzRetrPer,zzDur.
 PaintIndicator (RTX)
A new RTX indicator named PaintIndicator is now available. This indicator allows users to paint any indicator based on a variety of conditions and draw using some new and unique drawing styles. Up to 4 painting conditions may be specified with each condition giving options to paint based on an indicators value relative to a constant number, an indicators value relative to another indicator, or based on an signal build using RTL. Any custom indicator can be used as the basis for the PaintIndicator. The PaintIndicator has it's own base color which will be used when none of the paint conditions apply. If any paint condition applies the indicator will be drawn in that color, with conditions lower down in the preference window taking priority if multiple conditions apply on any given bar. Several attractive drawing options are available to PaintIndicator including: Line, Dots, Dotted Line, Histogram, Rounded Histogram, and Filled Histogram. All drawing styles have an optional border color. Read More
 BuySellMeter (RTX)
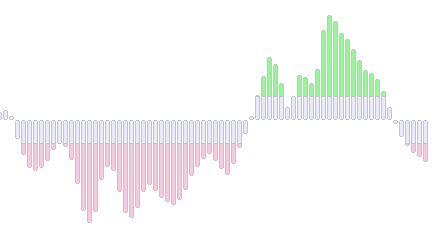
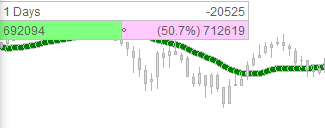
The BuySellMeter plots the buying volume versus the selling volume of a user-specified period of time, from last 1 day, to reset on demand, to auto-reset. Buying volume is defined as volume that traded at the ask/offer price while selling volume is defined as volume traded at the bid price. BuySellMeter gives a clear visual of these two volume metrics on a compact box anywhere on your chart. User specifies the horizontal and vertical position of the box (in pixels from top left) and may drag and drop the box within chart or select and use the up/down/left/right arrows to fine tune position. Durations include: Last X Days, Last X Bars, Manual Reset, Reset When Close,
Reset When Even (< X%). Last X Days and Last X Bars simply plot the buy and sell volume of the specified period. Choose "Last 1 Days" to show buying and selling of the current session only. Last 1 Bar to show buying and selling of the currently forming bar. Manual Reset allows the user to click a "c" button on the box to reset the buying and selling volume on demand and accumulate from that point. Reset When Even will automatically reset buy and sell volume to zero when the two are equal. The logic behind providing this option being that the event of buying and selling being equal is not terribly interest, so reset to zero and build from there. A similar option,Reset When Close (< X %), works on the same logic but resets the two whenever they get close (whenever the magnitude of the difference between buying and selling is< X%of the total volume accumulated. Read More- Version 12.5 Miscellaneous Enhancements
- A translucent option was added for the bands of the External Data Indicator ToTheTick.com PowerZone bands. Also, a labeling issue for ToTheTick.com bands was fixes so that labels are now properly labeled with PZ1, PZ2, PZ3, etc.
- The loading of volume at price data within bars was made much more efficient. User should see faster load times for chart when initially opening the charts or when importing data.
- A new configuration variable, DrawBidAskLastLines, was added which allows users to suppress the thin bid/ask/last line which appears just left of the vertical scale in multi-pane charts.
- A minor issue in the extend naked option of the Bands indicator was fixed which was preventing the extension of bands for indicator combinations which had results on consecutive bars.
- A new config, TPOChartBufferPrices, was added which allows user to customize the amount of whitespace (number of prices in tick increments) printed above and below realized prices in TPO Profile charts. This simply allows users to scroll further above and below realized prices to view or plot reference lines, etc.
- File > Functions > Chart Indicator Reports produces a report of all active indicators, their computation frequency and last calculation time. The output is filtered by a user configuration variable ChartIndReportFilterMS. Set this variable to a number of milliseconds to show only those indicators with calculation time greater or equal to the setting.
- Chart Buttons with purpose Execute Toolbar Button allow you to create buttons inside the chart for any of the chart toolbar buttons, including 18 additional chart actiions. Newly available in 12.5 are Revert, Toggle Whitespace, Scroll page Left/Right, Quick Change Session/Viewing Period.
- The chart right-click menu now has menu items for Session... and View Period... noting the keyboard shortcuts for these useful fuctions for quickly adjusting the chart's session and the period of time to be viewed in the chart window.
- A configuration variable PinLayoutToolbarAtStartup may be set true if you wish to keep the layout toolbar pinned at the right end of the main toolbar. This works especially well if the main toolbar is in Slim mode. When PinLayoutToolbarAtStartup is true, the layout toolbar is created without a title bar so that it appears visually as an extension of the main toolbar.