Investor/RT Version 14.x Release Notes
Final update: 14.2.8 on October 12, 2021
First release: 14.1.1 on July 24, 2020 (14.1 beta version testing started in September 2019)
-
About Investor/RT 14 more
Investor/RT 14 is a major new release that utilizes a new database engine that eliminates the database file size limitations inherent in RT 13 and earlier. RT 14 will thus permit essentially unlimited tick data and one minute interval data to be retained per symbol and generally will permit more symbols to be tracked with those retention settings. To achieve a smooth migration from RT 13 to RT 14, it is essential that all RT 14 users have previously updated to and run Version 13.6.x. The earlier 13.6.x releases include a migration function accessible from the File > Functions menu. The Migrate Database Content function is run automatically periodically so that all setups will be available to RT 14 upon upgrade. Or you can run this function from the File menu just before moving forward onto RT 14. This function will create migration files in the admin directory that will be detected the first time RT 14 is run. The migration files will be used to setup the new database with all charts, historical data, and other user settings exactly as defined in RT 13.6. RT 14 has all of the same features as RT 13 and will look and feel exactly the same. This transition to RT 14 under a 64-bit compatible database engine is an essential first step in moving the platform to a full 64-bit implementation
-
Rithmic Market Data and Order Routing more
The Rithmic Setup window, Data->Setup Rithmic features an improved user interface and expanded connectivity choices for the Investor/RT Rithmic trader. Like the Rithmic R | Trader Pro software, connectivity choices are organized into various Rithmic Systems (Rithmic 01, TopstepTrader, MES Capital, etc.) with a separate choice of the Gateway to use for each system
-
Daylight Savings Time Adjustment more
RT 14.2.3 (and RT 13.7.8) include improved DTN historical data timestamp mapping for users in locales where Daylight Savings Time (DST) status differs from time to time for the US schedule for DST/Standard Time changes. For example, consider a user located in London (UTC + 0). For the period October 18 to October 31, 2020, London locale changed to Standard Time while New York (UTC - 5) remained on DST. As a result, a session that usually begins at 14:30 in London began at 13:30 for this two week period since the US timestamps were an hour ahead. Thus during this out-of-sync period, a user in London must adjust the charting hours (session hours) back one hour. On November 1, 2020, the US transitioned also to Standard Time. So it is necessary shift the sessions back to normal since the session in question now begins at 14:30 again now thatthe US and UK back in sync. New functions are available in the File > Functions window to enable any full session and its associated day session hours to be shifted back or ahead an hour when these DST state changes occur. In addition, after shifting the session back or ahead an hour, performing a Full Data download will now align all of the historical data properly to the actual session hours in effect at the time of download. Past historical data for periods when your locale differed DST-wise from the US is adjusted so that session boundaries line up. For example, a historical backfill on October 20 (US and UK out-of-sync) will bring in all historical data for Oct 20 and earlier into the 13:30 session start time in this example. Similarly, on November 4 with US and UK back in sync (both on Standard Time again), all prior historical data will be aligned to the 14:30 starting time.
-
PaintZigZag (RTX) more video
A powerful companion tool to the popular Zig Zag Indicator, the PaintZigZag RTX® Extension is designed to amplify the visual presentation within each leg based on user-specified criteria. The PaintZigZag (PZZ) RTX Extension paints the legs of the Zig Zag indicator based on a number criteria of each leg or each bar. PZZ provides up to 6 paint criteria. Each criterion has a specified color and width. PZZ can paint each leg based on conditions such as: up sloping vs down sloping, leg volume > 50,000, leg delta > 12,000, leg move > 35 ticks. Or PZZ can individually paint each bar within each leg based on a bar by bar condition.
-
ChartMiniTrader (RTX) more video
The ChartMiniTrader is a minimalist user interface for submitting trading orders that is seen in a sidebar at the right side of the chart. This is an alternative to the legacy Trading order Desk feature. For users of CQG and RIthmic order routing, server side OCO bracket orders are supported using Trading Strategy setups. Buttons are provided for entering a position at the market or at the present bid or asked price. Current position status and PnL are shown beneath the array of trading buttons.
-
TradeBubbles(RTX) more video
The TradeBubbles extension draws 3-dimensional bubbles at each price within the bar. The size and coloring of the bubbles are variable, driven by volume-at price data. The most recently touched prices are drawn in front. The extension has a horizontal positioning option and a horizontal offset and drift option. These settings control drawing so that the more recently touched prices are drawn further right. Filtering options are available at both the trade and price level (e.g. consider only big trades > 10 lots or consider only prices with large volume > 1000).
-
CustomNakedLevels (RTX) more video
The CustomNakedLevels RTX Extension (CNL) is designed to display the closest naked levels produced by an RTL Custom Indicator. On each bar, the indicator looks back and finds the closest custom indicator level/value (closest in value to the bar prices), where that level is still naked going into that bar. CNL locates the closest prior custom indicator value that has not touched the bar values since that bar began forming. CustomNakedLevels is especially useful when backtesting using custom price levels such as prior fractal lows/high, zig zag pivots, and POC. In such backtesting scenarios, there are many prior key levels and the trading system needs access to the closest naked levels at any given time.
-
ChandeMomentumOscillator (RTX) more video
is a technical momentum indicator developed by Tushar Chande. The CMO indicator is created by calculating the difference between the sum of all recent higher closing bar changes and the sum of all recent lower closing bar changes. This result is then divided by the sum of all price changes over the specified number of bars. Finally, the result is multiplied by 100 to give the CMO a range -100 to +100. Typically, an instrument is considered to be over-bought when the raw value of the oscillator is above 50 and oversold when it is below -50. The Investor/RT implementation enables setting the over bought and over sold levels and further enables the oscillator to be smoothed using a moving average of your choice. Smoothing is typically done with a shorter term smoothing period, e.g. 3 bars.
-
EchoMarkers (RTX) more video
EchoMarkers is an RTX drawing tool for placing markers at any position (price and time) in a chart with optional echoes of the marker at the same price and time on subsequent or prior trading sessions. Vertical (price) echoes are available. These echo the markers at a vertical offset in ticks from the origin marker. Vertical and Horizontal lines are optional, each line having its own color, width, and style. The origin marker, horizontal echoes, and vertical echoes can have a unique fill color.
-
EditUserVariables (RTX) more video
The EditUserVariable RTX Extension is a tool designed to facilitate changing the value of a V#, C#, or T# user variable. Chart buttons, setup with purpose Set V# Variable or Set C# Variable can also be used to accomplish this. This works well for occasional changes, but is not convenient for making frequent changes to a user variable. The purpose of the EditUserVariable tool is to provide one or more persistent user variable editors directly in a chart.
-
TrailofIntentions (RTX) major updates (version 4)
New options in the “Visual Trail” display mode:
-
6 new “Paint When” filter options were added to paint the background or border special colors based on size or change in size. As an example, the user might want to paint sizes above 500 in gold, sizes between 300 and 500 in red, etc. These painted colors have an option to be shaded or not through the checkbox "Shade Painted Backgrounds (Below)”
-
New “Alternate Blend Color” for the default shading options (reminder: if not check, the alternative default blend color is the chart background color)
-
2 New “dynamic” calculation filter method: % above average, Percentile based
-
New Position Options: Right Side (Offset) and Left Side (Offset). These options are typically in a configuration including “Draw Only Last 1 bar” (the max. Snapshot size width in that case is 1000 pixel wide)
-
New Filter Options: Bid Size and Ask Size
-
Other display improvements: new font size option, new Spread colored line/block option that draws between bid and ask, Highlighting of Last Price now has @Bid and @Ask separate colors
New options in the “Custom Results” display mode:
-
New custom results outputs: Percentile, Average Price (ie a weighted average price based on all bid and ask size on the order book), Price Imbalance (expressed in ticks) : (CL - Average Price) / (Tick increment), X Highest (size), X Highest Price
-
Ability to store custom results outputs into V# or C# variables (for display through an annotation indicator, live recording into a cash instrument, etc..)
Global indicator features : New Export Data features. Users may now export the price and size data of the Trail of Intentions indicator by right-clicking on the indicator and choose "Export Data"
-
-
PivotStrategyAnalyzer (RTX) updates (v. 3.8 to 4.4)
-
New Average Wins and Average Loss statistics added to the report.
-
Signal Filter is fully recalculated during Pivot Strategy Optimization (PSO) when the PSO checkbox "PSA Custom Indicator Contains Optimized Variables" is checked
-
New RTX token Result Options: Price, State, Stop, Target, Entry, Reset Price, PNL, MAE, and MFE
-
Option to use New Price Level instead of Close when exiting trade on Level Change. New option for "Wins/Losses Only When Hit Target/Stop"
-
Equity Curve Size display can be customized. Improved Show/Hide of Trade Analyzer
-
-
Zones (RTX) updates (v. 4.6 to 5.5)
-
Sweep detection feature: the "Price In Time (Sweeep)" option to identify when price makes a minimum range within a given amount of time (in seconds) and within a given number of bars
-
New “Override Prices” option which replaces the Zone prices with the prices of two user-specified custom indicators. Combined with the option “consecutive signals true”, this turns the Zone RTX into a very versatile Zone identification system
-
New option to terminate naked extensions either when Range Filled (High and Low) or Breakout (High or Low)
-
-
TradeDots (RTX) updates (v. 3.3 to 4.4)
-
New Color Basis: Buy Imbalance
-
New option for variable size dots driven by delta instead of volume
-
New Hollow option with width specified in either pixels or % of Width.
-
Above and Below position options added to "Draw Trades as Text".
-
Vertical Offset option which vertically shifts dots up (or down when offset is negative).
-
"Color Text" option which colors the text same as the dots.
-
Dot the Close added to the Single Dot per Bar list.
-
-
TimeAndSales (RTX) updates (v. 1.7 to 2.6)
-
New Price as a data option in the Paint/Filter settings.
-
Support for Order ID from Rithmic feed through the Tick ID field.
-
Shift key down control while using arrow keys for rapid adjustment of TAS position in pane.
-
Hide checkbox option when first filter is set to Age > or >= to allow for showing only the most recent trades with a user-specified number of seconds.
-
Scrollbar option added to allow reviewing historical trades
-
"Up/Down Traded" option added to both back color and text color. Colors the background and/or text color based on price last moving up or down
-
-
PaintIndicator (RTX) updates (v. 4.2 to 4.5)
-
New Custom Position option to allow detaching PaintIndicator from bars and drawing Last X Bars of PaintIndicator on right edge of chart with custom width, right offset, number of bars, and bars back.
-
New option to stack labels using the newline \n character
-
New option for "Hide Bars With No Paint Condition True".
-
New option to vary only height or width with variable size.
-
New option to hide labels when pixels per bar is below a given size
-
-
Other RTX updates
-
Quickly Create a VolumeScope Chart:The Chart Setup Wizard (File > New > Chart) offers VolumeScope as a charting style for VolumeScope enabled users. VolumeScope charts are created using the default VolumeScope RTX preferences.
-
VolumeScope® RTX (versions 4.8 & 4.9): Suppressed printing of text when the text color matches the background color of chart - show only strong side and/or weak side text while suppressing text at other price levels. Added Max Value option to the Scale Profile / Colors list which draws profiles at max width for any volume values at or above the specified custom level.
-
ChartTradingDOM RTX (version 5.1):The chart trading DOM is now responsive to user initiated account selection, e.g. changing from live trading to the trading simulator. The state of the trading DOM, LIVE or SIM, is now displayed and the color of the Account menu button at the bottom of the DOM changes to reflect LIVE (red) or SIM (green) so you can tell at a glance when the DOM is connected to your live trading account. The Account menu now has a Trading Log menu item for quickly reviewing recent trading related messages.
-
PaintCandles RTX (version 1.7 to 1.9): Newoption to paint upper wick, lower wick, body only, or wick only and for all Paint Signals to share the same position.New option to "Hide When Instrument Invisible".Gradient Paint option : new feature for hiding Gradient "When CI < Min"
-
SessionPrices RTX (version 3.4 to 3.6): New price options returning Full/Day and Overnight Values of VWAPs and VPOCs
-
Divergence RTX (Version 2.2) - New option for Signal to Signal divergence calculation (instead of Fractal) for the High to High and Low to Low methods
-
ExtremePriceHighlighter RTX (version 1.4 & 1.5) New filtering options to trim down the identified prices based on data values such as delta, imbalance, volume, range, or any custom indicator value. New RTX token data result item of "Price".
-
PolynomialRegressionChannel RTX (version 2.2)New option to store current values into series of 5 V#/C# variables
-
-
Recent enhancement of core platform indicators (Custom Indicator, Profile, Zigzag & more)
-
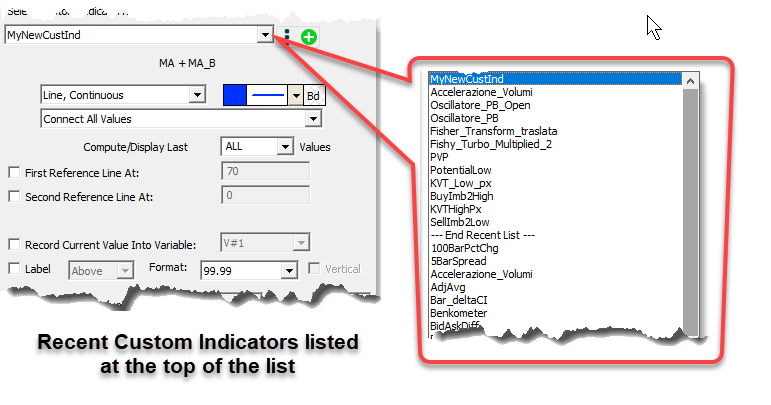
Custom Indicator Setup Enhancement When adding a the indicator Custom Indicator to a chart, the setup dialog has a list button for selecting the name of the RTL Custom Indicator you wish to add to the chart. This list is shown in alphabetically order. User with many custom indicators will see an improvement in Investor/RT. The selection list now begins with a shorter list of the most recently added or updated RTL custom indicators, followed by the full alphabetical list below that. When creating a new custom indicator or revising one, the name of the RTL object is recorded in a group named .Recent RTL. The members of this group may be viewed in the Object Manager by selecting the group name and pressing Open, or by double-clicking on the group name. This enhancement essentially places the custom indicators in this .Recent RTL group as the first items listed for more convenient selection.
-
Profile Indicator - Hide When Day/Full Session A new option was added to the Profile Indicator to allow users to hide any given profile when the chart is set to either the Full or Day Session. This new option can be found in the lisbox to the right of the checkbox at the top right of the Profile preferences window.
-
Profile Indicator - new Upper and Lower Tail tokens - The PROF RTL token now provides result options of Upper Tail and Lower Tail. These results are relevant for time-based profiles and convey the number of singles at the high (Upper Tail) or low (Lower Tail).
-
Pivot Point indicator :A new "Custom Labels" option is now available at the bottom of the Pivot Point Preferences window. This Custom Label allows users to easily differentiate between mutiple Pivot Point indicators in the same pane. For example, if a user has setup one set of Pivot Points based on 4 hour periods, the user might specify a custom label of "4h " which would result in the levels being labelled with "4h PP", "4h S1", "4h R1", et
-
New Moving Average Type VIDYA Chande's Variable Index Dynamic Average is an adaptive weighted moving average indicator. It was developed by Tushar Chande as an attempt to improve the performance of the EMA (Exponential Weighted Moving Average) indicator.
-
Shape Indicator - Horizontal Zone - Low Color When the Shape Indicator is set to draw a Horizontal Zone, a new Low Color checkbox/pen is provided to allow the low price/line to be drawn in a different color and pen from the high price/line.
-
Shape Indicator - Show Only When Daily A new option was added to draw the Shapes indicator only when set to specific periodicities such as Intraday, Daily, Weekly, Monthly, or DWM (Daily, Weekly, or Monthly). If this setting is turned on and set to Intraday, then the shape will show only when the periodicity is an intraday periodicity and will be hidden when the charts periodicity is changed to daily, weekly, or monthly.
-
Fishy Turbo (aka Inverse Fisher transformation of RSI)The Fishy Turbo indicator now has a custom MA Type as input allowing the user to customize the smoothing type used in calculations. A Weighted MA was previously used by default.
-
InfoBox - Up/Down Colors The InfoBox, when setup to display indicator values, now uses the Up and Down background colors to reflect whether the indicator is positive or negative. This option is turned on by a new checkbox "Use Down Color for Negative Indicator Values".
-
QuoteBoard Indicator - Paint with Highlight Color The QuoteBoard Indicator now paints the ticker symbol header row with the symbols Quotepage Highlight Color if that option is turned on. This setting can be found in the Instrument Setup window (Alt-A) in the > More section.
-
-
Extended control of User and Chart variables (V# and C#) through new SET value options
A chart button setup with purpose Set V# Variable or Set C# Variable may be used as a means of setting the value of a V# or C# to a specific value, or to elicit a menu of values for selection, or to be prompted via a dialog box for manual entry of a value. The button setup is typically the name of the variable, optionally followed by the = operator. To the right of the = operator, if present, you can specify a value or a comma separated list values that will appear as a menu when you click the button to set the variable. Investor/RT now supports four new operators in button setup: +=, -=, *=, /=. Using chart variable C#5 for illustration, here are some sample button setups and their resulting effect on the value when the button is clicked:
C#5 You will be prompted to enter a value for C# C#5 = 3.14159 A push button. The value 3.14159 will be set into C#5. C#5 = 3,9,16,26,33 A menu button. A menu titled C#5 appears with five choices, click a choice to set C#5 to the chosen value. C#5 += 1 A push button. The value of C#5 is incremented by 1. C#5 +=0.25 A push button. The value of C#5 is incremented by .25 C#5 -= 2 A push button. The value of C#5 is decremented by 2 C#5 *= 1.0025 A push button. The value of C#5 is increased by 0.25% C#5 *= 2; A push button. The value of C#5 is doubled. C#5 /= 0.9975 A push button. The value of C#5 is reduced by 0.25% The four new operators may be used to adjust the values of any C# or V# variable. At present these operators may be used in push buttons. For menu buttons, the = operator is implied. This may be enhanced in a future release.
-
Additional Chart and Text Variables (C# and T#)
Investor/RT 14 now supports up to 128 Chart variables (C#) and 64 Text variables (T#). Variables T#1 to T#32 have been available for some time; they hold textual values per symbol and are persistent on the database, i.e. the values remain set when RT is restarted. The new T# variables T#33...T#64 are at present temporary variables; each of these are reset to empty (no text) when RT starts up. T#33...T#64 can be used in RTL to hold textual content persistently per symbol until RT exits. Investor/RT 14 also supports up to 128 chart variables (C#). It is aways best to use the first 64 C# variables, as last used values are kept within the database, while the content of C#65 to 128 values (like T#65 to T#128) are non persistent (ie wll be automatically reseted to zero at every restart). Such C#s will be typically used for complex chart display optimization purposes.
-
New reset features for V# and C# Variables
File > Functions > Zero User Variables This new function provides a quick way to set all of V# variables for one or more symbols to zero. Any File > Function can be invoked from a chart button by setting to button's purpose to Execute Function. When create such a button, enter the name of the function (Zero User Variables) followed by a colon and then the parameter to the function. The parameter can be a specific symbol for which all user variables are reset to zero. There are two special parameters, All and ?. When All is specified, user variables for all symbols are zeroed. When ? is specified, the function prompts for one or more symbols. You may also specify ? followed by some default symbol, e.g. ?@ES# will prompt for entry of a symbol with @ES# being the default symbol.
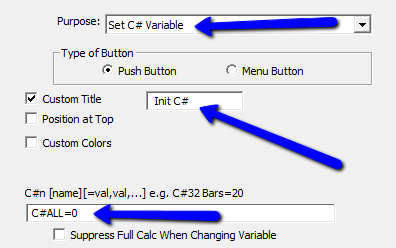
The Button Indicator purpose "Set C# Variable" can now be used to initialize all 128 chart variables. To accomplish this, setup the Button Indicator with text "C#ALL=0" as seen below. This will result in all 64 C# variables getting set to 0 when the button is pushed.
-
New Chart Variables (C#) Usage report
The Chart Variable Report is now available. It can be accessed through the chart popup menu under the Show submenu, or by simply clicking on the chart and typing the # character (Shift+3). The Chart Variable Report shows the values of all 128 C# variables and provides a complete list of any indicators in the chart which can set any of those C# variables. This report allows the user to quickly see the current state of all 128 variables and see all indicators that can potentially change those variables.
-
User Interface Improvements
-
Adjusting Font and Text Size in Text Windows. Various text windows in Investor/RT such as the message log, trading log, and alarm log have a menu button in the upper left corner for adjusting the font and size of the text display. Other text windows such as the System Status or Data Source Status (feed status) window have no visible means of adjusting the text size or font. Investor/RT 14 and higher supports keyboard control of font family and text size for all such text windows. Normally, operating the mouse scroll wheel, while the mouse is positioned over a text window, scrolls the text up or down. You may now modify this behavior by holding down the Ctrl-key as you use the mouse wheel to increase or decrease the size of the text in the window. This makes it easy to zoom in on hard-to-read text and then zoom out again. Sizes can be adjusted in the range 8 pt to 30 pt using the mouse wheel. If you hold down both the Shift key and the Ctrl key simultaneously while operating the mouse wheel, Investor/RT will cycle through a list of a dozen common font families typically installed on all Windows 10 systems
-
Layout Toolbar Tab Sequence. The layout tab in the layout toolbar are presented in ascending sequence based on the tab sequence number of each layout. In prior versions of Investor/RT revising the tab sequence numbers to effect a different tab order would go into effect the next time Investor/RT started. RT 14 now supports immediate reordering of the tabs in the toolbar whenever a tab sequence number is revised and the layout is saved. To view and change the tab sequence number of a layout, first activate that layout and press the disclosure triangle at the upper left corner of the layout toolbar to expose the layout's settings. Edit the tab sequence number higher or lower and click the Save button. The current layout will remain the same but the position of that layout's tab may shift left or right as the tabs of the layout are rearranged in ascending tab sequence number.
-
New Right Click (on a chart) "Show" menu options. As mentioned above, Right-click in the Chart and choose Show > Chart Variables Report to access the new Chart Variable Report. Three other menu items have been moved to the Show submenu as well. Show > Calc Statistics Report displays calculation related information about the chart; Show > Slide Show initiates a slide show using that chart; Show > Time and Sales opens a live display of tick data for intra-day charts of any periodicity. For Daily, Weekly, or Monthly charts, this menu item displays the bar data in the chart. These menu items were formerly listed directly in the popup menu. This change makes the popup menu more compact and better organized.
-
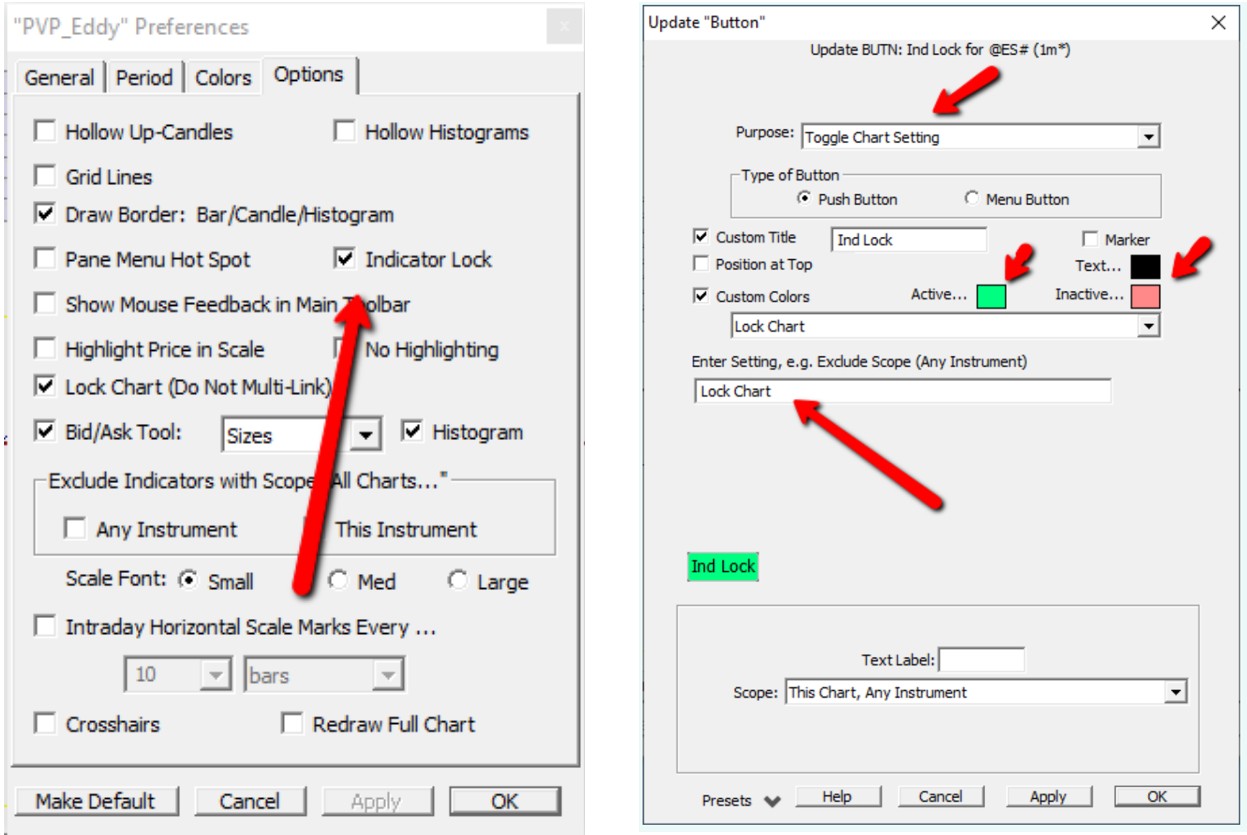
New Indicator Lock feature. While using the up/downn/right/left arrow to navigate a chart, or the scroll wheel to zoom in and out, you may inadvertently adjust with such an action the settings of an indicator, if you had clicked/selected on the corresponding indicator. Checking this new box (available in the "Options" tab of every multi-pane preference window) prevents such unwanted changes to indicator parameters. It is also possible to add a Button indicator to toggle on/off this lock feature, with on/off colors indicating which state it's currently in.
-
-
Other misc. new Features
-
Restore Points in Version 14 RT 14 database files are stored in the db folder inside the InvestorRT working directory. Database Restore Point files are .dba files with names that begin with "RestorePt" followed by a timestamp. RT 14 can create/revert to any RestorePt.... file. Note that RT 13 restore point files have names that begin with "Archive". RT 14 cannot revert to RT 13 restore points and vice versa. The RT 14 backup and recovery mechanisms are similar to RT 13. The daily backup in RT 14 creates a restore point (with historical data) and the restore backup command in RT 14 essentially performs a revert to restore point using the most recently created daily backup. The daily backup restore point is kept in the archives directory like other restore points and has the name BackupDatabase.dba. Like version 13, RT 14 makes additional periodic restore points without historical data every day or so.
-
Extra Digit Display Format A new display format titled Extra Digit is available and will display the value with one extra digit of precision in the display format of the underlying instrument. As an example, users may choose to Label Current Value of a Custom Indicator (or any indicator) and choose Extra Digit to get see one extra digit of precision on the label in the scale.
-
Set Recalc Rate Function A new Function was added (File > Functions) which sets the recalculation rate of all the indicators in the front most chart. Options are available to set the rate in seconds (3 Secs), ticks (10 Ticks), Minimal, or Default.
-
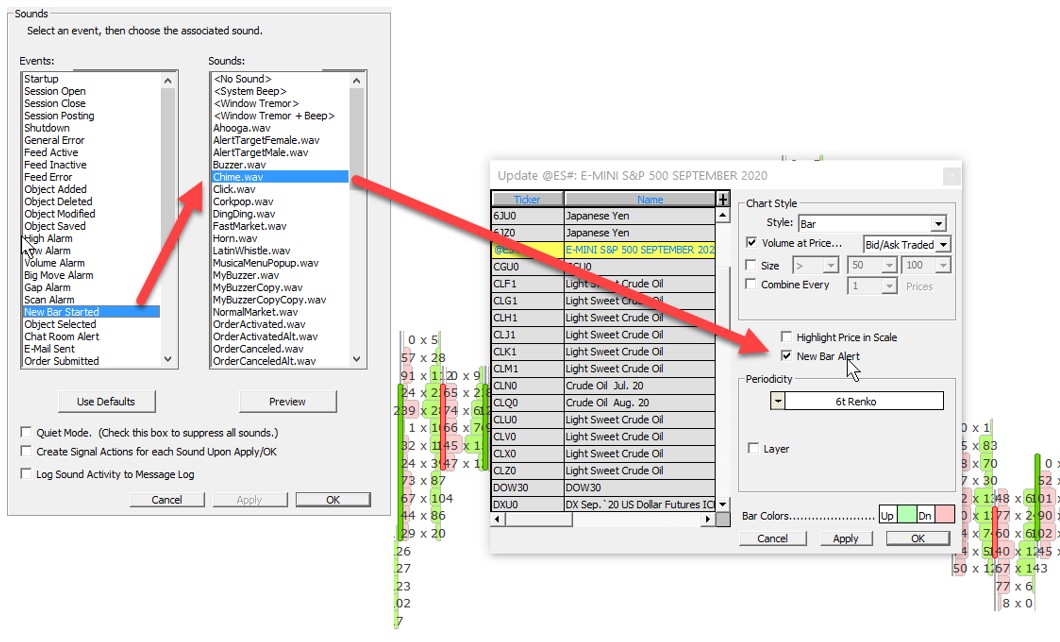
New bar sound alert feature Any instrument can now be marked to trigger a sound event when a new bar begins. This is very useful when using time-independent periodicities when bars form at random times based on price and volume. Sound for new bars is set in Sounds preferences. New checkbox in Instrument add/edit dialog is used to enable sound alerts on new bars. User can use Sounds preferences to select No Sound to turn off such new bar alerts globally and/or use the instrument edit dialog to turn them on/off for particular charted instruments. Alerts never sound for Invisible instruments.
-