Investor/RT Version 12.6 Release Notes
Released July 26, 2016
RTX for Mac OS
Linn Software has completed the porting of the RTX runtime system to the macOS platform. Version 12.6 Beta #3 includes macOS versions of 25 RTX indicators in the Add Indicator dialog. Read more about RTX indicators. Some RTX Extensions are available under the new licensing/price model as discussed at www.linnsoft.com.
-
Third Party Licensing Solution for RTX
Linn Software is pleased to announce the Investor/RT Developer Program which allows subscribers to purchase and license RTX extensions provided by third party developers. Visit the new Developers section of the site for a list of current third party developers and their extensions. Developers may opt to offer payment via their own website or in the newly opened Linnsoft App Store. Once you purchase an extension, you will be licensed for that extension and can view your extension licenses by clicking on the Extensions tab from your account page when logged in to the site.
Licenses for purchases made via a developer's site will be created for you by the developer and any purchase made from the App Store will grant you a license instantly. After you have received email confirmation that your license has been created, the RTX extension(s) will be installed automatically the next time you startup Investor/RT. The File > Functions window now has a new function Check for RTX Updates that will check for new 3rd party licensed extensions (or updates to ones already installed) and install them automatically, otherwise this checking/installation activity occurs each time Investor/RT starts up.
If you are interested in applying to become a developer and offering your proprietary RTX extensions to Investor/RT subscribers, contact us. We look forward to hearing from you.
-
New Toolbar Design more
The main toolbar, layout toolbar and charting toolbar buttons have been professionally redesigned with a more simplified modern look and provide a clean visual response upon hover or mouse down events. Object toolbars (for charts, TPO charts, quotepages, etc) can be viewed with standard (small) or larger style buttons. By default, icon buttons are rendered in a more subdued fashion in grayscale and toolbars use the larger sized buttons. As part of this tool pallel redesign version 12.6 has improved help tips for toolbars: tips pop up showing the button purpose only when you hover over a button briefly without clicking. Tips disappear automatically after a few seconds or instantly as you move the mouse off the button in question.
-
Layout Toolbar Positioning
By default, the Layout Toolbar is a floating window with a title bar. The toolbar can be sized and positioned by the user. Version 12.6 allows the layout toolbar to become an extension of the main toolbar. In File > Preferences, under Configuration, set
PinLayoutToolbarAtStartup=True. The layout toolbar will then appear as a thin toolbar, sans title bar, positioned at the right of the anchored main toolbar as seen below. The main toolbar is in Slim format here. A slim main toolbar and pinned layout toolbar is a good combination.
When the layout toolbar is pinned in this way, it cannot be dragged or resized using the mouse. The Alt+L keyboard short can be used to show/hide the Layout Toolbar. By default the pinned layout toolbar is 600 pixels wide. The width can be adjusted by setting the configuration variable LayoutToolbarWidthPixels. The value can be adjusted to a value 560 pixels or higher based on your screen size. Note that the main toolbar window is resizable using mouse. As you drag the right side of the main toolbar window left or right, the pinned layout toolbar moves with it. This way, you may extend the main toolbar size until the combined toolbars fits perfectly your display screen width. When you exit Investor/RT and startup up later. this size of the main toolbar is retained.
The main toolbar has an Auto Hide feature that positions the main toolbar in a collapsed form at the top of the screen. When the mouse pointer moves over the main toolbar, the array of main toolbar icons appears on demand; the toolbar collapses again after a few seconds. Note the new PinLayoutToolbarAtStartup mode in Version 12.6 is compatible with this main toolbar mode as seen in the image below:

-
Copy Chart Images to the Clipboard
The Chart Right-Click menu has been better organized to reduce its size. A Copy To Clipboard submenu provides choices for copying the chart definiton text or an image of the entire chart or just one pane of the chart to the clipboard. You can select an indicator in the chart and do Copy to Clipboard > Techincal Indicator (Ctrl+C), then right-click again in the same or some other chart and choose Paste (Ctrl+V) to put the copied indicator into that pane. Copying images to the clipboard enable you to easily share that image by pasting it into an email message, an instant messager window, or any other program that works with images. When you copy just one pane's image, Investor/RT will produce an image of the pane along with the time scale from the bottom of the chart. The clipboard operations are now found only in the Copy to Clipboard submenu. Redundant menu items in the Save and Export submenus have been removed.
-
RTL Tokens for Advanced Trading Automation
Tokens have been added to RTL to enable RTL formulas to access the stop or limit price of a currently working trading order, or the order id number of a particular working order. For example, the RTL expression, SET(V#33, TR_SELL_STOP) will place the stop price of the current working sell stop order if there is one working, if not V#33 will be set to zero. Using these stop and limit price tokens, RTL may be formulated, for example, to monitor how far away the last trade price is from a stop or limit price and produce a signal if that distance in price or tick increments is over some threshold. The action associated with the signal could, for example, issue a revise order trading order for the sell stop order to move it up, i.e. a trailing stop. To issue a revise order trading order, the order id of the order you wish to revise must be known. RTL tokens have also been added for accessing the order id number of a particular working order. For example, the token TR_BUY_STOP_OID evaluates to the order id number of the currently working buy stop order. This value can be SET into a V# variable and the revise order trading order will have to specify that V# number as the order id to be revised. Since the OID token evaluates as 0 if there is no working order of the type implied by the token name, these tokens provide a way to test whether a particular kind of order is working, e.g. the expression (TR_SELL_STOP_OID > 0) evaluates as true if there is a sell stop working. The tokens may also be shown inside charts using the Annotation indicator. An annotation with the text
Buy Stop ID %TR_BUY_STOP_OID Price %TR_BUY_STOPwill display the order id and stop price when there is an order of this type working. Here is the complete list of RTL tokens for accessing price and order id number of working orders.- TR_BUY_STOP_OID Buy Stop Order ID”
- TR_BUY_LMT_OID Buy Limit Order ID”
- TR_BUY_STOPLMT_OID Buy StopLimit Order ID"
- TR_SELL_STOP_OID Sell Stop Order ID"
- TR_SELL_LMT_OID Sell Limit Order ID"
- TR_SELL_STOPLMT_OID Sell Stop Limit Order ID"
- TR_BUY_STOP Buy Stop Price"
- TR_BUY_LMT Buy Limit Price"
- TR_BUY_STOPLMT_STOP Buy StopLimit Stop Price"
- TR_BUY_STOPLMT_LMT Buy StopLimit Limit Price"
- TR_SELL_STOP Sell Stop Price"
- TR_SELL_LMT Sell Limit Price"
- TR_SELL_STOPLMT_STOP Sell StopLimit Stop Price"
- TR_SELL_STOPLMT_LMT Sell StopLimit Limit Price"
-
Legacy Setup Menu
The legacy Setup Menu is no longer available for inclusion on the main menu bar. It has been revised and continues to be available as a submenu of the File Menu as a power user-option via a configuration variable.
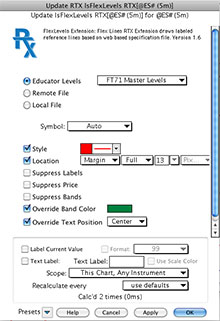
By default, the File Menu has a single menu item, Preferences..., with Alt+Y keyboard shortcut, shown at left below. This menu item opens the Preferences window wherein all InvestorRT preferences are viewed and edited by topic. If the configuration variable PreferencesSubmenu is set to true, this menu item instead becomes a submenu that provides access to a few frequently referenced preference items such as Instrument Setup, Alarms, Configuration and User Variables. The submenu includes a menu item to access the full Preferences window and a List All menu item (Ctrl+Y Shortcut) to see a selection list of all preferences topics.
Users who have set configuration variable LegacySetupMenu to true in the past, or those who set PreferencesSubmenu true going forward will see Preferences as a submenu instead of the single menu item as seen below at right:
With newly added keyboard shortcuts, there is less need for the legacy menu items offered by the Preferences Submenu. Press Shift + Alt + Y and an alphabetized list of preference topics will appear. Strike a letter on the keyboard to move to the topic name starting with that letter. For example, Shift + Alt + Y, U, enter key opens the User Variables preferences. Shift + Alt + Y, G, enter key opens the General preferences. For quick access to Configuration Variables, press Ctrl+Y. Remember the letter Y as the key for preferences related access: Alt+Y accesses the all inclusive Preferences window, SHIFT Alt+Y shows a selection list for individual preference topics and finally Ctrl+Y for viewing/setting configuration variables that alter platform behavior in unique ways.
-
Price Statistics New more
Price Statistics is a component of the TPO Profile Package. This indicator presents cumulative volume based information for each price over a user-specified period of time expressed in days or bar count. Data items include Buy Volume, Sell Volume, Volume, Buy Volume Percent, Sell Volume Percent, Ticks, Average Size, Delta, Delta %, Price (Delta Color), Bars (TPOs), TPO Histogram, Volume Profile, Volume Profile Delta Shaded, Smoothed Profile, Smoothed Delta, % of Total Volume, Delta Profile, and Volume Nodes. Any or all data columns may be displayed in any desired order. Each data item is color shaded based on its relative value. Custom colors are available for buy volume, sell volume, volume, and text. Optonally, the font and style of quotepages is used display the price statistics. Specify the font using File > Preferences > Quotepage Defaults. There is also an option to plot the historical Value Area (VA) and Point of Control (POC) for various periods. View the Preferences tab for more information on each data item.
-
Bar Statistics New more
Bar Statistics is a component of the Volume Analysis package. The indicator presents cumulative volume-based textual information for each bar. Data items include Buy Volume, Sell Volume, Total Volume, Max Delta, Min Delta, Total Delta, Buy Vol %, Sell Vol %, Delta %, Delta Change, Volume Change, Ticks, Avg Tick Size, Cum Delta-Day, Cum Delta-All, POC Volume, Prices (TPOs), Avg Volume at Price, Time (Seconds), Delta Finish, Max Delta %, and Min Delta %. Any or all of these data rows may be displayed and in any order the user wishes. Each data item is shaded based on the relative value of the data item and custom colors are available for buy volume, sell volume, volume, and text. User may choose from 4 different font sizes: Small, Medium, Large and Extra Large, and an option is availble to use the font style of quotepages which is specified in Setup: Preferences: Quotepage Defaults. For more information on what each data item provides, visit the Preferences tab.
-
Volume at Price Trade Size Filtering New
Instruments under analysis in charts can optionally be setup for deeper analysis of “Volume At Price”. Typically this volume at price analysis is done on all of the tick data on hand for the instrument. Version 12.6.9 adds the option to filter the volume at price analysis based on the size of each trade. This opens up many possibilities, for example, the analysis of trades above or below some size, trades between any two sizes, or trades that match a specific size. The filtering setup is found in the Add Instrument or Update Instrument window for multi-pane charts when the "Load Volume at Price Data" checkbox is checked. To engage the filtering, mark the “Size” checkbox; select the comparison operator; enter the size(s). Size may be entered as a number or as a user variable (C# or V#). For example, if the filter is Size > 10, only the trades larger than 10 lots are considered within the volume at price analysis. The filtered volume at price data is in turn used to compute indicators associated with the instrument. RTX indicators can access the volume at price details, e.g. Volume Candles, Trade Dots, and Price Volume Pattern. Investor/RT features several built-in indicators that operate on volume at price details, e.g. Multiple Price Highlighter, Zig Zag and Zig Zag Oscillator. For example Zig Zag accumulates volume and delta (Total Volume and Volume Since Last Pivot) and can display these values as text labels reflecting only the filtered trades.
Trade Size Filtering opens up opportunities to study the impact and relationships of large traders versus smaller traders. Multiple instruments may be added to a chart, invisibly if desired, one instrument for example is filtered with Size > C#1; another filtered with Size <= C#1. The chart can present a button for setting the value of user chart variable C#1. Such a chart can have multiple indicators, e.g. two instances of Volume Candles side by side, one associated with each instrument, showing the volume at price for large trades in one color and that of small trades in another. The chart button is used to adjust the size variable to instantly see the Volume Candles reflecting the new size filter. Of course, the chart may also contain the same instrument without filtering and associated indicators that present the all trades perspective. Buttons can be used to Show/Hide various indicators to create a charting experience where a click or two switches among various views of the underlying order flow: all trades, trades above C#1 threshold and those below or at the threshold.
-
Pivot Strategy Analysis (RTX) more video
Backtesting a pivot-based strategy has never been this easy. The new PivotStrategyAnalysis RTX Extension allows you to specify any key daily or weekly price level such as previous high, previous close, or overnight VPOC, and analyze the effectiveness of that level as a pivot point during the following session or week.
Effectiveness is measured by an analysis of potential trades based on the user-specified pivot level. The analysis considers additional user-specified parameters such as stop and target tick offsets, front run wiggle, reset distance, nature of system, trading limits and time filters. This extension is available as core RTX extension for all Investor/RT subscribers.
-
Pivot Strategy Optimizer (RTX) more video
The PivotStrategyOptimizer (PSO) builds upon the PivotStrategyAnalysis (PSA) indicator to create an extremely powerful combination. PSO enables the optimization of any combination of a number of variables within PSA, allowing the user to quickly determine the optimal combination of values which would have resulted in maximized profits. PSO can optimize the target, stop, reset distance, frontrun wiggle, allowable trading hours, number of allowable trades/day, or an infinite array of other variables within the custom indicator upon which the PSA is based.
-
Multi-Linking from Charts
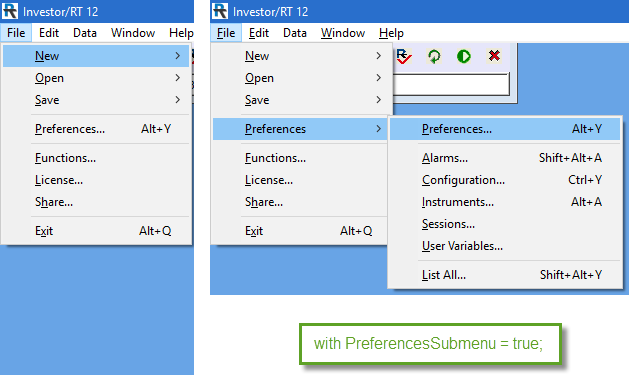
Multi-Linking is a long standing feature of Investor/RT. When changing instruments in multi-pane charts, you have the option to apply the symbol change to the current chart window alone, or you can multi-link the symbol change into related charts and other windows having a qualifying multi-link color code. Version 12.6 has been improved so that when changing symbols in a multi-pane chart using the instrument selector at the lower left of the window, multi-linking is engaged automatically whenever there is at least one other open window that qualifies to be multi-linked. Each chart window has a multi-link color code that is set by clicking the multi-link color button at the lower right corner of the chart. There is now only one special color code. White color code denotes that the chart is locked, charts having this color code will not participate in any multi-link operations. A color group is a group of open charts (and other window types) that share a common multi-link color. White coded charts cannot be used to initiate multi-link operations. Chart window preferences also have a "locked" checkbox option that enables you to lock the chart from participation in multi-link symbol operations even though the chart may belong to a color group. If you use the Update Instrument dialog to change symbols and Investor/RT detects that there are multi-linked charts in play, there will be two action buttons for applying the symbol change: the OK button applies the symbol change only to the subject chart; the Multi-Link button title will show you how many charts and other windows will be linked with the new symbol if you press the button. As seen below, there is a small info button to the left of the multi-link button. Clicking on the info button will provide visual feedback by vibrating the window frame of every multi-linked window briefly.
The examples above have to do with the update instrument dialog, the dialog that appears automatically to assist you when you type alphabetic characters into the chart. Investor/RT also has a symbol selector menu at the lower left corner of the multi-pane chart. This menu selection feature to change symbols is now enabled for multi-linking in Version 12.6. No multi-linking is performed if the chart's multi-link color is white, but if you have a specific color group setup, using the chart's ticker symbol menu will replace the symbol in all charts having the same multi-link color. You may specifically lock some charts by checking the Lock checkbox in the chart's preferences. This way you can keep a group of charts color coded the same for some other reason, e.g. multi-link scrolling, but lock of some charts in the group from participation in mulit-link symbol changes. The multi-linking of open windows considers multi-pane charts, TPO Profile charts, Time and Sales windows, and DayBar Charts.
In concert with these multi-link revisions, the multi-link color button menu in multi-pane and TPO Profile Chart windows has been revised. Black and Gray multi-link color choices have been added. Black is no longer a special color. White is the only special color choice and its meaning has changed to "No multi-linking". The menu also has a checkable menu item titled Multi-Link Symbols. When this menu item appears checked, it means that the chart is eligible for multi-linking within its color group. When unchecked, it means the chart is locked out of symbol multi-linking. Choosing the menu item toggles the checkmark on/off. This menu item can thus be used to turn off symbol multi-linking for specific charts in a multi-link group. Charts having white multi-link color are by definition ineligible for any multi-linking, thus you may not enable symbol multi-linking for such charts. If you revise a white multi-link chart to some other color the chart is automatically unlocked so that symbol multi-linking is now enabled for that chart. If this is not what you want, you can use the menu to uncheck Mulit-link symbol.
Multi-linking and Slide Shows: Multi-linking is supported automatically by the slideshow feature of Investor/RT if you elect to check mark the box titled "Mulit-Chart Slideshows" in the Charting General preferences panel. If you start a slide show from a chart color coded red, for example, the slide show will then proceed symbol by symbol updating all of the linked red charts. Note that the multi-chart slide show feature, when enabled, means that you must initiate the slide show from a chart having a multi-link color. Charts that have the white multi-link color may not be used to start a slide show since they are inelgible for any symbol multi-linking activity. -
Date Time Display
Investor/RT 12.6 supports international (ISO) standards for the display of date and time values. This is the default display format upon upgrade to Version 12.6. ISO time display uses 24-hour time (16:30 for 4:30 p.m.). In various dialogs where a time value is entered by the user, e.g. Session preferences, the hour is now entered as a value between 00 (midnight) and 23 (11 p.m.). Alternative date and time display formats are available for selection in Setup > Preferences > General should you prefer to see times displayed in 12-hour mode or dates displayed mm/dd or dd/mm or with the month name spelled out.
-
Trading Preferences
File > Preferences > Trading is a preferences panel that consolidates various trading related preferences that formerly were set individually as configuration variables.The Trading preferences pane provides for quickly enabling or disabling chart trading elements, elements like Fill and Working Order reference lines that highlight your position and working orders while in a trade. In 12.6 you have the option to enable a position annotation in your charts only when in a position. The position size and PnL (in tick increments) is shown in this annotation while you are in a position and disappears when FLAT.
-
Trading Hours Setup Adjustment
Investor/RT keeps track of the full trading hours (full session) for all futures contracts as well as the day session (regular trading hours). Switching a chart between the full and day session is easily done by right-clicking inside the chart and choosing "Edit > Hours" or by simply pressing the comma keyboard shortcut. A dialog will appear for choosing between full session or day session charting hours. You can view some other range of trading hours by selecting a specific session or entering its session number. When the chart is on the full session hours and you press the comma key, the dialog is designed to offer a switch to the day session charting hours by default, just by pressing the enter key. Thus you can press comma, enter to alternate the chart easily between full and day session charting hours. If the instrument you are charting does not have a setup yet for day session hours or if the full session hours are incorrect, you may easily make adjustments by clicking the Adjust button in the dialog and then entering the appropriate start and ending times. Now that Investor/RT is aware of full and day session charting times, the software handles the transition from one symbol to another in the chart automatically. For example, when viewing an ES chart with full session hours, switching the chart to say a Crude Oil contract will result in the chart showing the oil contract's full session hours. Similarly switching symbols while viewing a day session chart put the chart into the day session hours for the new symbol. The Adjust feature is also available from the Instrument Setup window and can be used there to adjust the full/day session hours for any existing symbol. When specifying charting hours, Investor/RT now uses the 24-click. All times are expressed in your local timezone.
-
EquiVolume: New Custom Width Options
The EquiVolume (Equi-Indicator) indicator was enhanced with two new Custom Width Options: Min/Max Pixels and Min/Max % of Bar. Both allow the user to specify a lower volume boundary and an upper volume boundary. Anything bar with volume at or below the lower boundary will be drawn with the width specified (in either pixels, or % of bar width). Any bar with volume at or above the upper volume boundary will be drawn with width specified. Any bar with volume between the two boundaries will be drawn with width proportional to its distance between the two levels.
-
Fibonacci Retracement: Store Into V#/C# and R Multiples
The Fibonacci Retracements (FIBR) indicator now provides an option to store the prices of each level into a series of V# or C# variables. When storing into V# variables, not only will the prices be stored in the variables, but the variables will also be automatically titled to reflect the % level stored in that variable. For clarification on which level is being stored into each variable, simply visit the User Variable Preferences and observe the label/title associated with each of the variables in the series. Additionally, a new checkbox labeled "Show R Multiples" results in each level being labeled with the R Multiple corresponding to that percent retracement level. The R Multiple reflects the profit or loss for any given trade divided by the risk.
-
Bands: Extend Naked Bands (Session)
A new "Extend Naked Bands" option for the Stepped Block drawing style of the Bands Indicator was added titled "All (Fresh Start)". This choice works just like the extend "All" option except it terminations the extensions at the end of each session and starts fresh. This option is useful for bands which only apply to the session in which they were formed and should not be carried forward to the subsequent sessions.
-
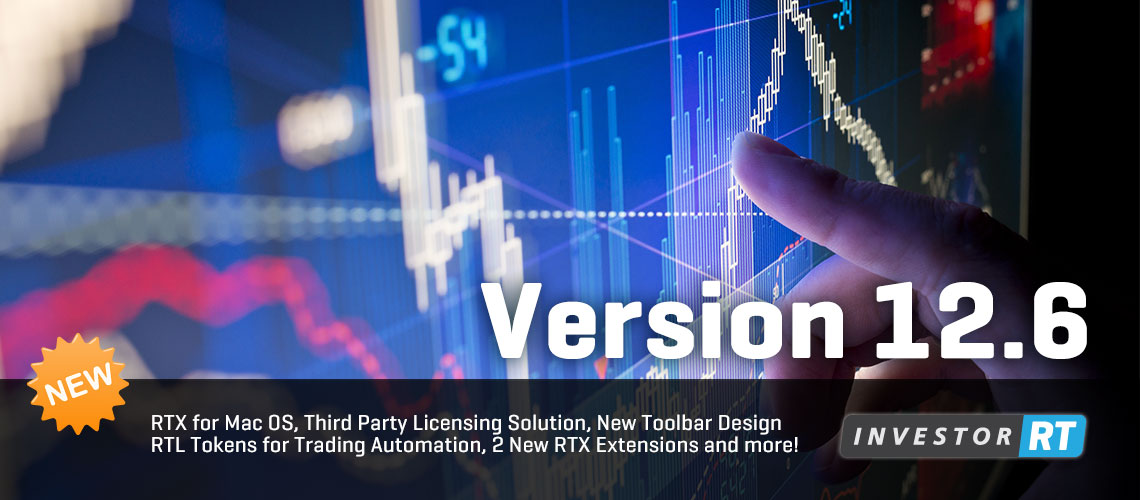
Reference Lines: Start Date/Time video
A new option was added to Reference Lines to allow users to begin their reference lines on any given bar, and drag and drop the reference lines starting point not only between prices, but also between starting bars. A checkbox at the top right of the Reference Line preference window titled "Start From" enables this option. Once turned on, simply drag the reference line to any given bar and the line will draw from that bar forward. Once such a line has been added to the chart, simply right-click on that line and "Add Button". The resulting button will allow the user to simply click on any price on any given bar and a line will be drawn at that price projecting from that bar forward, and can then be dragged to any other price and bar combination.
-
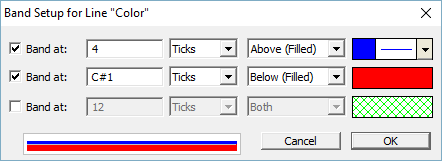
Reference Lines: Band Between Two Prices
A new option has been added to the Reference Line indicator which allows for the drawing of a band between any two prices. This functionality is supplied via the embedded Bands available within the color control of Reference Lines, and further via a new option of "Above (Filled)" within bands. As an example, if a line was drawn on a chart of ES at a price of 2070.00 and the bands were turned on with "8 Ticks: Above (Filled)", then a solid band will be drawn from 2070.00 up to 2072.00. The height of the band may be adjusted from the keyboard by simply selecting the line, then using the shift-mousewheel ( or shift-up/down arrow). This option may also be used in combination with the new Start Date/Time option to drag a banded reference line between prices and bars. Within the band setup, then second band now provides a "Below (Filled)" option as well. This option will draw a solid band below the primary line at the height specified. This filled band below can be combined with a filled band above, each with its own unique height. The height of the band below may also be adjusted from the keyboard using ctrl-mousewheel (or ctrl-up/down arrow). So for a line setup with filled bands both above and below, select the line and use the mouse scrollwheel to move the line up or down, and hold down the ctrl key while operating the scrollwheel to adjust the height of the band below, or hold down the shift key while operating the scrollwheel to adjust the height of the band above. The magnitude of all three band options may now be specified as C# or V# and therefore adjusted with a Button Indicator.
 When filled bands are turned on, by default, a line will be drawn on the border of the band using the same color as the primary reference line. The "Label Current Value" in scale will also be drawn using the same reference line color. Users have a couple of additional color options on this front if this setup is not ideal. Users may check the "Use Scale Color" option below the Reference Line preferences to draw the label using the scale color instead of the line color. Also, a new configuration variable is available titled RefBandLabelLineColor. This config defaults to true but when set to false, the line and label drawn at the edge of the bands will instead use the corresponding band color.
 -
Reference Lines: Solid Band Label Option
A new configuration variable, RefLineLabelSolidBands, has been added which controls the labels of solid bands of the Reference Line indicator. When the Solid Band (Above, Below, or Both) is turned on for a Reference Line, and the Label Current Value option is turned on, by default, both the primary line and the outer band(s) are labeled with price in the scale. By setting config RefLineLabelSolidBands to false, only the primary line will be labeled and the labels of the solid bands will be suppressed.
-
New Indicator Scopes Based on Color and Instrument
Investor/RT allows indicators to be assigned a scope that governs which chart windows will contain the indicator. When the notion of scope was introduced long ago, there were four scopes: This Chart, Any Instrument (the default scope): This Chart, This Instrument; All Charts, This Instrument; and All Charts, Any Instrument. Version 12 introduced two new scope settings that enable indicator scope to consider the multi-link color of the charts. Indicators having scope All Charts, This Color are added to all charts having the same Multi-Link color as that indicator's parent chart. The Multi-Link color of a chart is specified by clicking on the + button, sometimes called the "Mulit-Link" button, at the bottom right corner of the chart; the click calls up the Multi-Link menu. Multi-Link color for newly created charts defaults to white. White has a special meaning as seen in the Multi-Link Menu - No Multi-Link. The new scope is useful when you want to have indicators shared by some but not all charts. For example, you may set the Multi-Link color of three charts to blue; then add a reference line to one of the charts, and set its scope to "All Charts, This Color". The reference line indicator will be setup so it appears in the three "blue" charts, and will appear automatically in any other charts you may later assign the blue Multi-Link color. As the reference line indicator is dragged in any of the three charts, the adjusted reference line price will be instantly reflected in the other blue charts. If a preference such as line color or thickness or band setup is changed in any of the three charts, the preference change is similarly reflected in the others. In some situations you may wish to define an indicator that you want to appear in some group of color coded charts, but only if the qualifying chart contains a particular instrument. The new scope All Charts, This Color & Instrument" provides this capability.
Both new scopes are available as an override scope for the Button Indicator when the button purpose is "Add/Remove Indicator" and "Activate Drawing Tool Preset", as discussed below. When you revise a chart's multi-link color, Investor/RT will automatically add any qualifying indicators to the chart given the adjusted multi-link color. Similarly, any such indicators that no longer apply given the new multi-link color are removed from the chart. -
Profile Indicator: Naked Line Improvements
Several improvements were made for the Naked line options of the Profile Indicator. When the "Text Label" option is checked, all naked lines are labeled with the date of the profile which created them. This applies to Naked POCs, Naked Highs, Naked Lows, and Naked Closes. Prior to version 12.6, only the lines which were still naked were labeled with the date. However, in version 12.6, naked lines which have been closed (taken out) are also labeled with the date of the initiating profile. In addition, the number of bars for which the line remained naked is presented in parenthesis to the right of the date. A configuration variable, ProfNakesLabelWithBars, may be set to FALSE for users who prefer to suppress this number of bars in parenthesis. Also, when exporting the data of a Profile Indicator by right-clicking on the profile and choosing "Export Data", columns are now added to the exported file which represent the number of bars each profiles POC/High/Low/Close remained naked, and how many bars (from end of data) the level has been closed. The columns are titled nPOCBarsOpen, nPOCBarsClosed, etc. If nPOCBarsClosed has a value of 0 for a given profile, that means that profiles POC is still naked and has not been taken out by future price.
-
Profile Label Each Price: Price (Vol) Vol %
A new "Label Each Price" option was added to the Profile Indicator (PROF) preferences titled "Price (Vol) Vol %". This choice will result in each price being labeled similar to this "2070.00 (2450) 3.4%" and represents the price, the (volume at that price), and the % of the volume at that price relative to all volume in the profile.
-
Paint Bar Paint Session Options Added
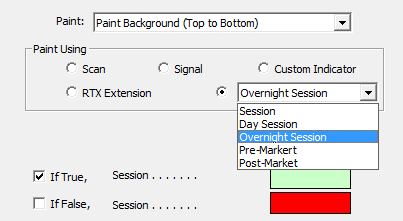 The Paint Bar Indicator now has four convenient new options for painting session: Day Session, Overnight Session, Pre-Market, and Post-Market. Prior to 12.6, the Paint Bar indicator had an option to paint a user specified session. With the increased emphasis on day session in 12.6 (in addition to the ease with which it can now be specified), these new options may now be conveniently supplied. Choose Day Session to paint only the bars within the day session. Choose Overnight Session to paint only the bars in the overnight session (all bars outside the day session). Pre-Market and Post-Market options would only be relevant when a post-market period exists (in other words, when the full session ends after the day session). In this situation, Pre-Market would paint only the bars from the full session start to the day session start. Post-Market would paint only the bars from the day session end to the full session end. Crude Oil would be one example of an instrument for which a post-market period would apply. These new options allow the user to easily paint the pre-market, day session, and post-market with 3 distinct background colors.
 -
MarketDelta Trader Discontinued
Version 12.6 discontinues MarketDelta Trader as a Data Source/Broker Destination. The vendor of this broker connection software is ending support later this year. Investor/RT subscribers who are presently using MarketDelta Trader with either the OEC or Rithmic Order Routing systems may run 12.6 configured for OEC or Rithmic using Linn Software developed connectivity. MarketDelta Trader will continue to be supported in Investor/RT 12.5 until late October 2016. Investor/RT clients using the CQG Order Routing system are advised to remain on Version 12.5.9 using MarketDelta Trader. If you are using the Investor/RT platform with CQG please contact us. We would like to assess the demand for CQG to decide whether to invest our resources in developing CQG connectivity for Investor/RT.
-
Version 12.6 Miscellaneous Enhancements
- Investor/RT Chart Share has a checkbox to enable the share operation to replace (update) a chart image and optional definition that was shared previously. From the chart share dialogue, check Replace Chart Shared Earlier and your previously posted chart with the same name will be replaced with a new image and optional definition. Any description text will appear as a comment below the chart. In this fashion, you can share the same chart name repeatedly, updating it as often as you wish with comments about the update. Others may follow your chart revisions since the URL (link) to your shared chart will not change when you use the replace option.
- Several keyboard shortcuts have been added to the Chart Right-Click menu. Right-click in any multi-pane chart and explore the menu and its submenu to review the shortcuts. To reduce the overall size of this extensive menu, several chart setup menu items have been placed in an Edit submenu near the top. Use the Edit submenu to access the chart's elements via the Element Manager, the Preferences for the chart (Ctrl+F), the charting hours setup (comma key), and the viewing period setup (period key).
- The multi-pane chart right-click menu has been condensed and reorganized. The top most menu item is a Setup submenu for accessing common chart setups such as the chart preferences, the chart's trading hours or viewing period, or the setup for the instrument in the chart. There is now a Copy To Clipboard submenu for all clipboard functions such as copying a chart image or the chart definitional text to the clipboard. Some menu items were formerly in the Save and/or Export submenus. The Export menu is for producing export files of the chart's data content. The Save menu items are for saving the chart or saving it under a different name, or saving the chart's definitional text or an image of the chart to a file. The Share submenu is use to Share an image of the chart and/or its definitional text with others via email.
- Volume Prices Statistics - Price With Xth Highest Volume. The Volume Price Statistics (VPS) Indicator has been enhanced with a new option Statistic option titled "Price With Xth Highest Volume". This option identifies the price within each bar with the Xth highest volume, where the user supplies the value of X. If X is 5, then the indicator will identify the price within each bar that is the 5th highest price with respect to volume. If there are fewer than 5 prices in a bar, the indicator will return a price of 0.
- Profile Indicator - Volume Limit Drawing Style. The Profile Indicator has been enhanced with a new drawing style titled "Volume Limit" which paints each bar one of two colors depending on whether the volume of that price is above or below a user specified level. This option may be activated by choosing "Volume Shading" from that Draw As dropdown list, and then choosing "Volume Limit" in the subordinate list to the right. When this option is chosen, a field is presented where the volume limit is specified and a 2-color control allows the user to specify the color of prices above the limit (Hi) and prices below the limit (Lo).
- Indicator Timeout Efficiency Feature A new Indicator Timeout option has been added to the Performance Preferences. This option is intended to prevent situations where the data feed falls behind during extreme high volume periods such as periods following important news releases. The Indicator Timeout detects situations where an indicator is calculating too frequently for the amount of time and resources it takes to calculate. When such a situation is detected, that indicator is put into timeout for a period of time during which the indicators calculation is suppressed. Once the indicator comes out of timeout, a full calculation is done on the indicator to update it's values on any bars that formed during the timeout. During the timeout, as new bars form, the indicators will flatline at it's last known value(s) as new bars form. When timeout is turned on, the user has options for Timeout Sensitivity and Duration (in Seconds). Sensitivity defaults to medium and controls how quickly the product will react to potential issues, with the higher sensitivities being quicker to trigger a timeout when warranted. The Duration controls how long (in seconds) the indicator will be put into timeout when deemed necessary. A "Log Timeouts to Message Log" controls whether each timeout will be reflected in the message log.