Chartmill Value Chart (RTX)
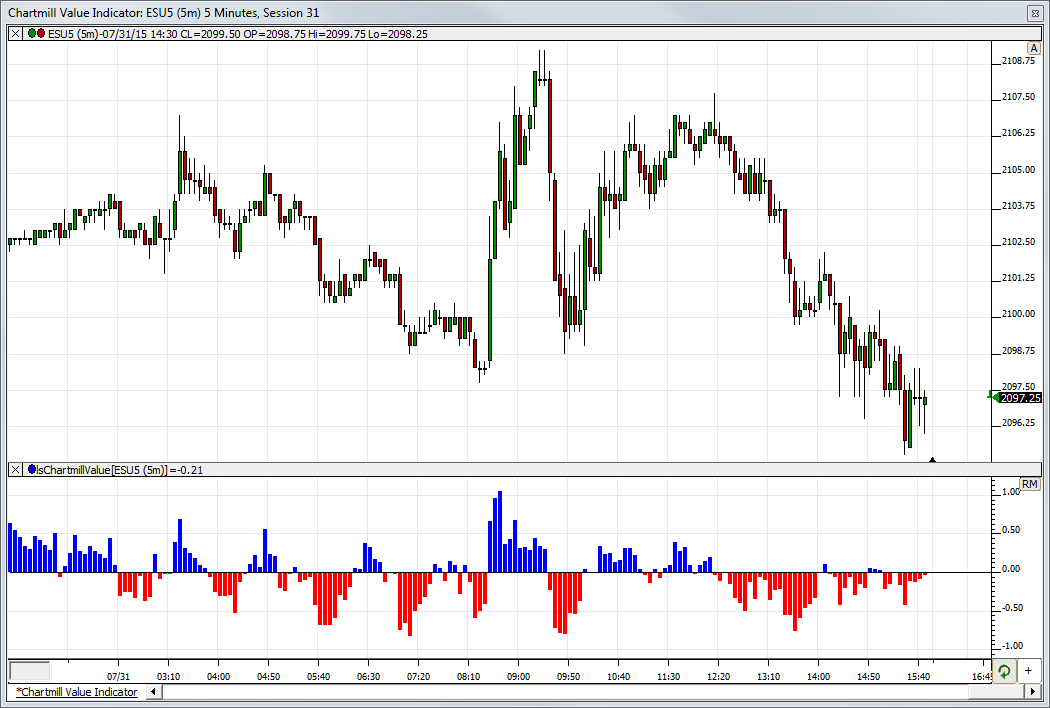
The Chartmill Value Indicator(CVI) appeared in the January 2013 issue of Technical Analysis of Stocks and Commodities. The article was written by Dirk Vandycke. The CVI represents a standard deviation from a moving average, which can be applied to any price series over any period. The concept is simple. As prices rise, they will eventually rise above a moving average. Eventually, the moving average will begin to rise as well. At this point, prices need to continue to rise to increase the spread between the current price and the underlying moving average.