Drawing tools : how to add your favorite settings with a chart button ?
How to use the Activate Drawing tool preset button purpose
How to use the Activate Drawing tool preset button purpose
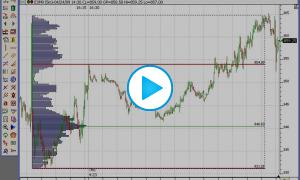
This video takes a fresh look at the use of the Profile Indicator drawing tool to lay down and adjust Custom or MicroComposite profiles around any group of bars or data. Many new features of the Profile Indicator are explored as they relate to such profile.
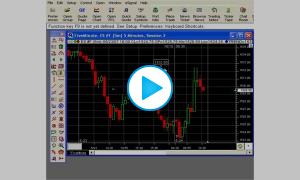
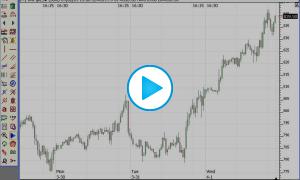
This video is going to demonstrate how to add and manipulate trend line based indicators or drawing tools in Investor/RT traditional bar and candle charts.
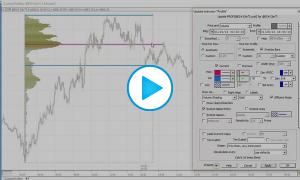
This video demonstrates a new Stepped Blocks drawing style for the Price Bands Indicator which allows user to draw retracements and multiples between any two prices historically. This is a very powerful feature especially when combined with the flexibilty of the Session Statistics Indicator to compute key prices of various durations.
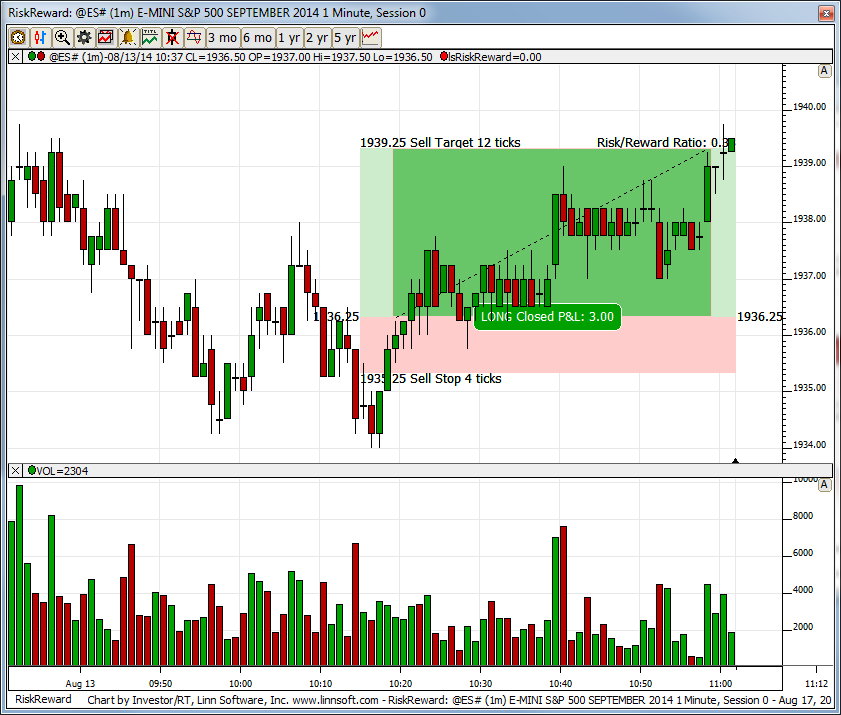
This is a 1 minute chart of the S&P Emini illustrating the Risk Reward Indicator, a new indicator in Version 12. The Risk Reward indicator is a rectangular drawing tool that studies a range of trading, showing how profit target and stop loss settings would have played out has you entered the market at some base price. For more information on using the Risk Reward indicator see the Risk Reward indicator in the Indicator Library.
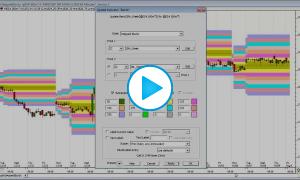
This video demonstrates how to draw volume or time-based profiles across any group of consecutive bars of any periodicity. It also discusses how to edit and manipulate these profiles, as well as how to add buttons that activate different profile settings.
This video demonstrates enhancements made to the Profile drawing tool in version 9.2.8 including an option to shade each price based on volume, easier dragging and manipulation, an open/close candle body, and more.