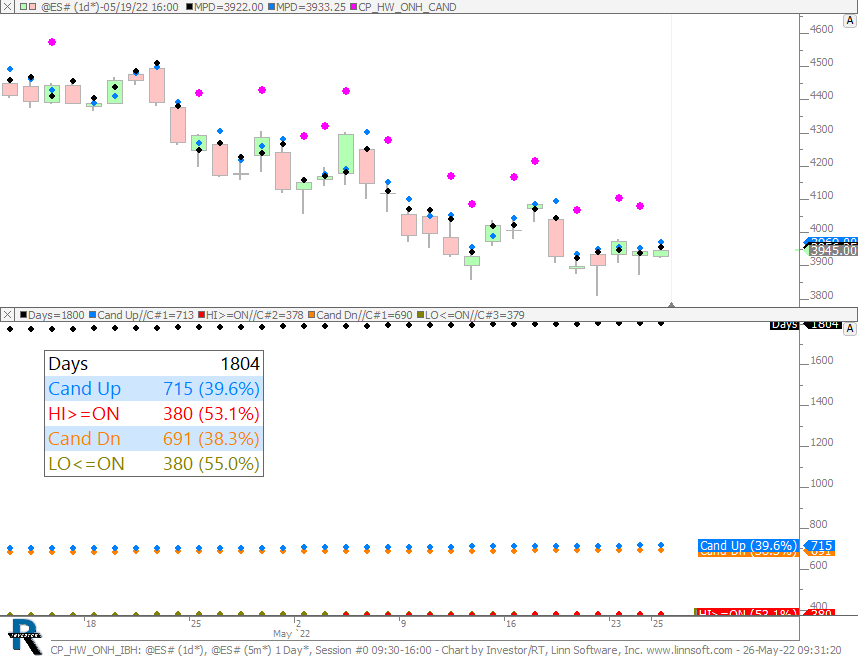
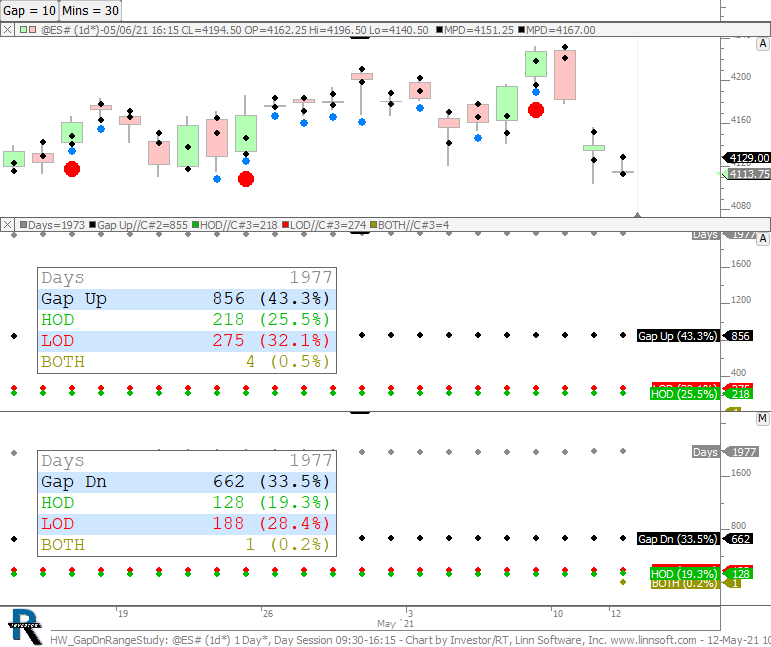

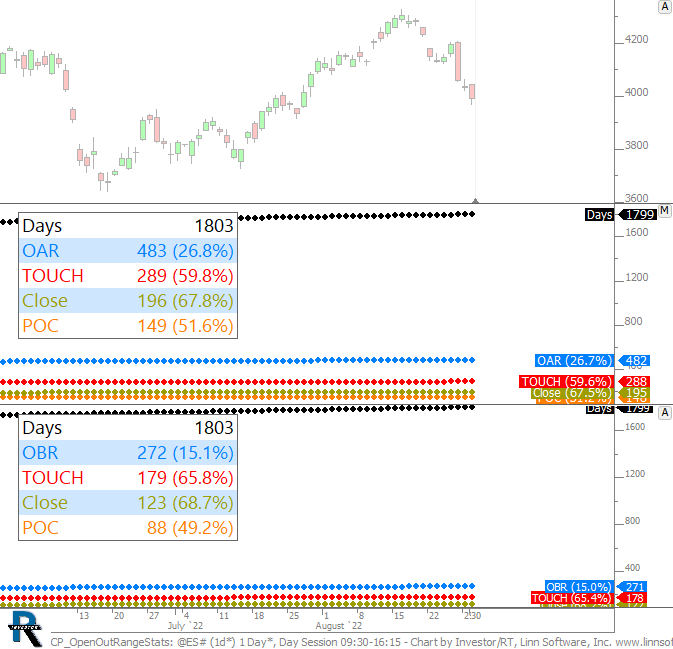
Chart identifies which bar or bracket FIRST breaks the Initial Balance. 2nd pane identifies which bar first breaks the IBH (3 represents 3rd 30-min bar or 3rd bracked or C Bracket - Also 1st bar following the completion of IB). 3rd pane identifiees which bar/bracket first breaks the IBL (Initial Balance Low = low of 1st 60 minutes of day session). And the 4th pane identifies which bar/bracket first broke out of the IB (either direction).
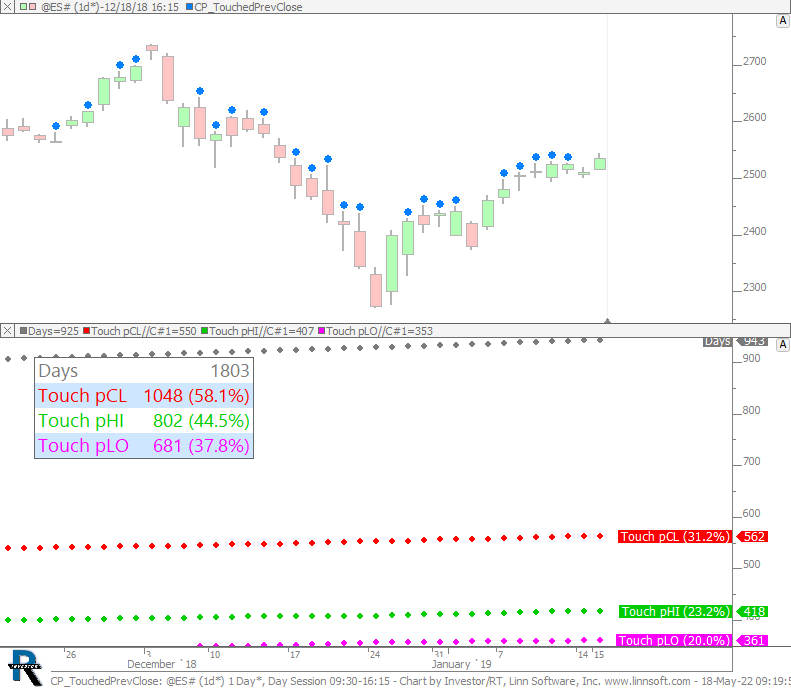
CP OpenOutRangeStats (@ES#)
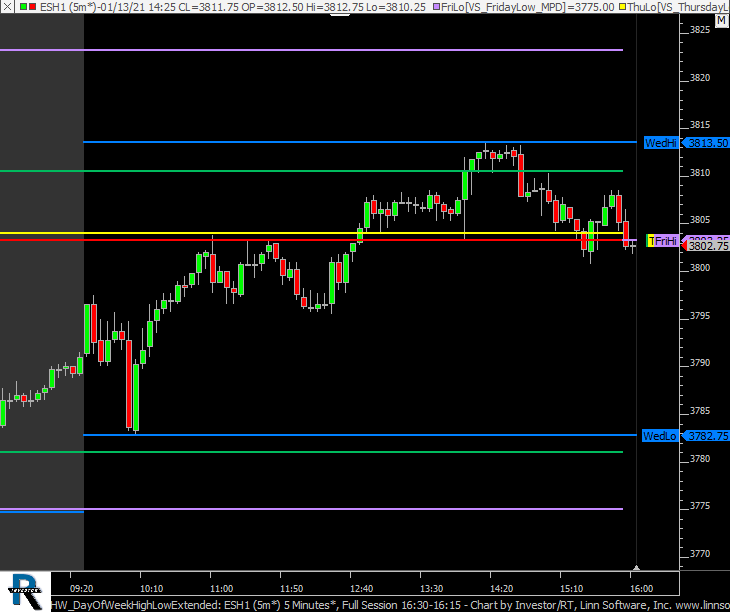
This chart was uploaded by Investor/RT 15.1.10 showing symbol: @ES#.