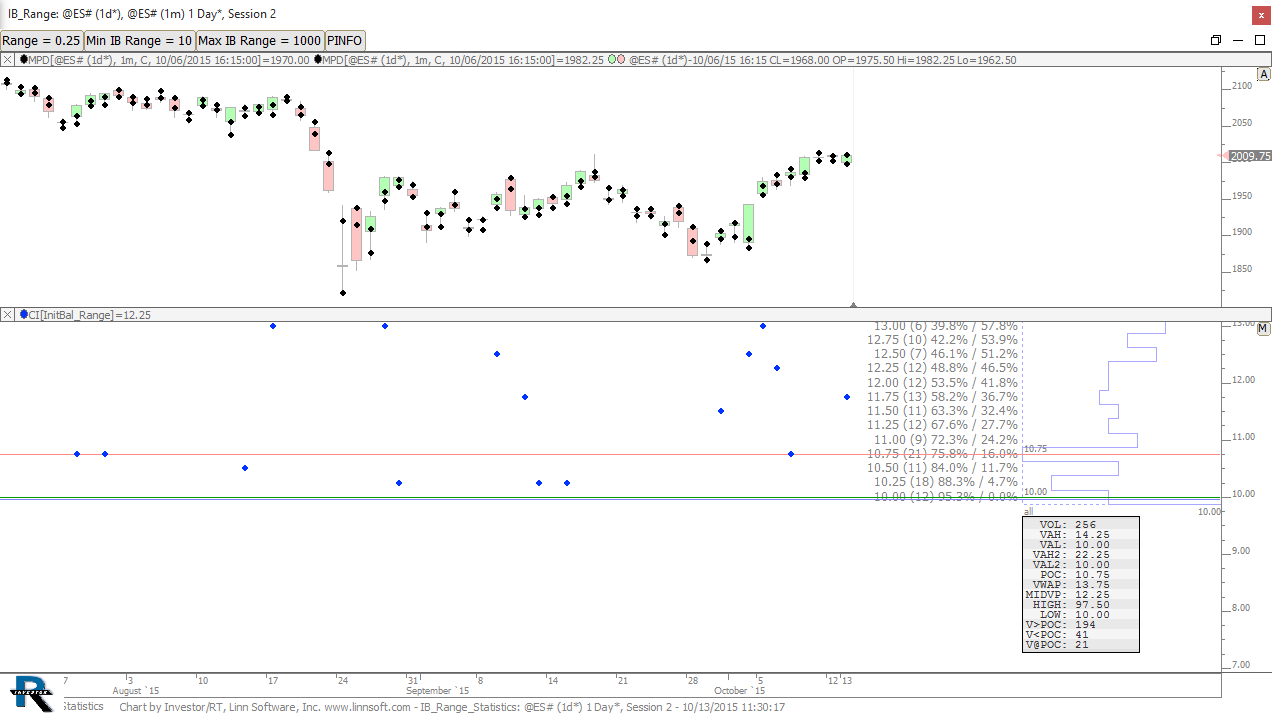
This video, lesson 5 in the series on extracting market data, focuses on the statistics available in the Info Box of the Profile Indicator and explains their relevance when applying profiles to indicators.
This video was a response to a few user requests. First off, the video covers in depth how to create and use infoboxes within panes in Investor/RT. Additional topics include well as how to create two basic custom indicators and leverage them to demonstrate divergence.
This video demonstrates how to customize the text labels for each indicator shown by the Info Box indicator.
Info Box is a chart drawing tool that provides a tabular display of an instrument's market data and, optionally, the values of technical indicators included in a given pane (or all panes) of a chart.
The "Show data for" section of the preference window determines which bar the instrument data is displayed for. It includes 4 options:
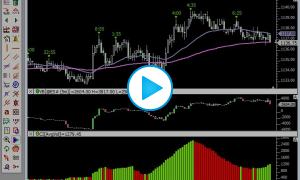
This video demonstrates how to add and manipulate the Info Box indicator to provide the user with both instrument and indicator data for each bar.