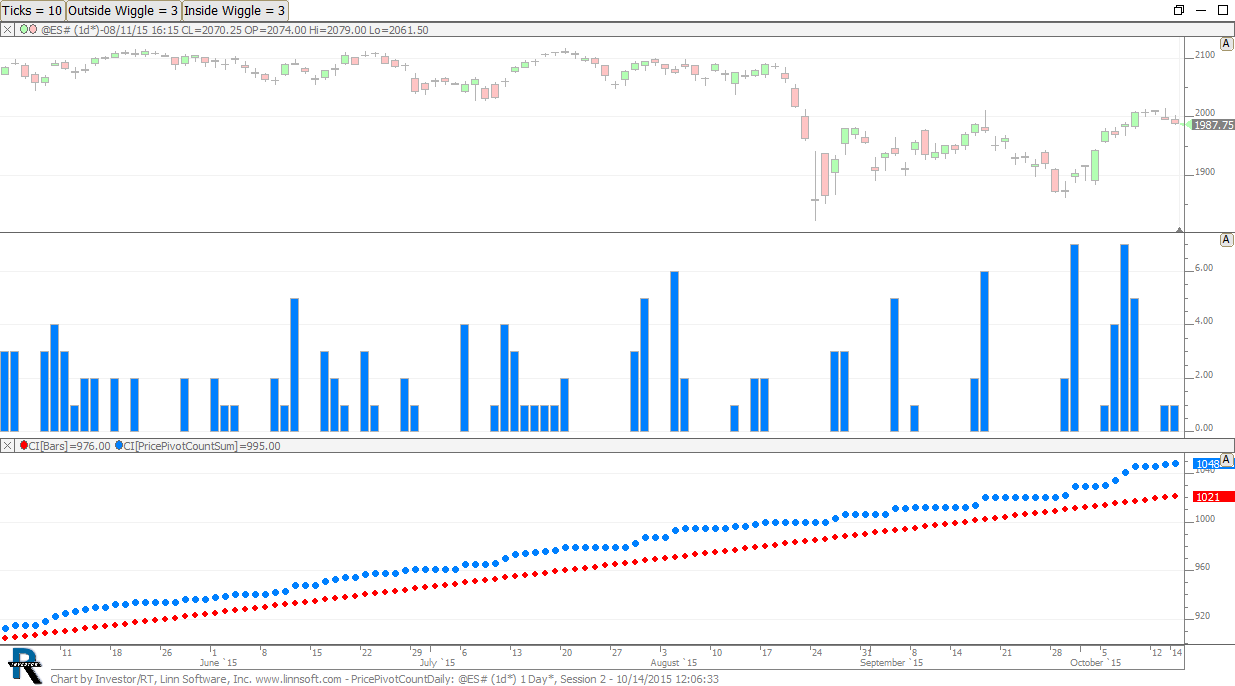
Price Pivot Effectiveness Intraday
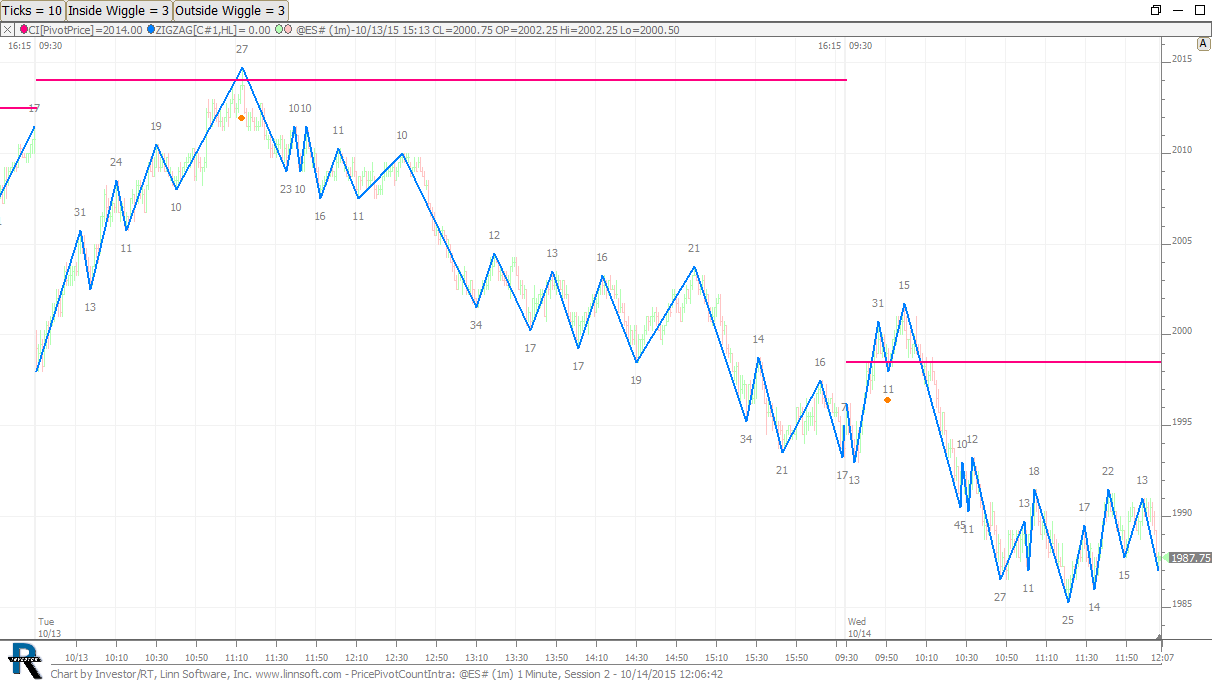
Companion chart to Homework #20: Measuring Effectiveness of Key Prices as Reversal Prices
Companion chart to Homework #20: Measuring Effectiveness of Key Prices as Reversal Prices
Companion chart to Homework #20: Measuring Effectiveness of Key Prices as Reversal Prices
This video, the 20th video in the series Homework, Research, and Statistics, demonstrates a method for measuring the effectiveness of various key prices as reversal prices or pivot points. Key prices might be overnight high, overnight low, previous high, previous low, etc. It measures their effectiveness by counting the number of times price reversed the following day/session at these prices using the endpoints of the Zig Zag indicator.
This video demonstrates how to automate pivot levels, support and resistance levels and the pivot point price on the TPO profile charts.
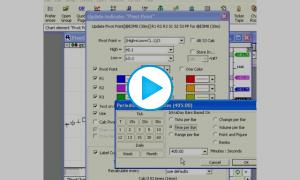
This video is going to discuss the pivot point indicator in an Investor/RT and give you a few ways to compute it.
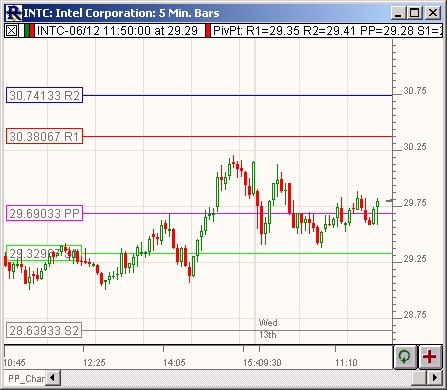
The Pivot Point study is one which works best in markets with a wide daily trading range (high volatility). The study uses the previous day high, low, close, and open price to generate a pivot, two support levels, and two resistance levels. Because it is generated from daily data it is recommended that you check the "Use Daily" checkbox when adding this study to an intraday chart. Otherwise, the pivot point lines will be calculated using bars of whatever periodicity the chart is in.