Homework #26: Studying Effectiveness and Reactiveness of Key Daily Price Levels Using Pivot Strategy Analysis
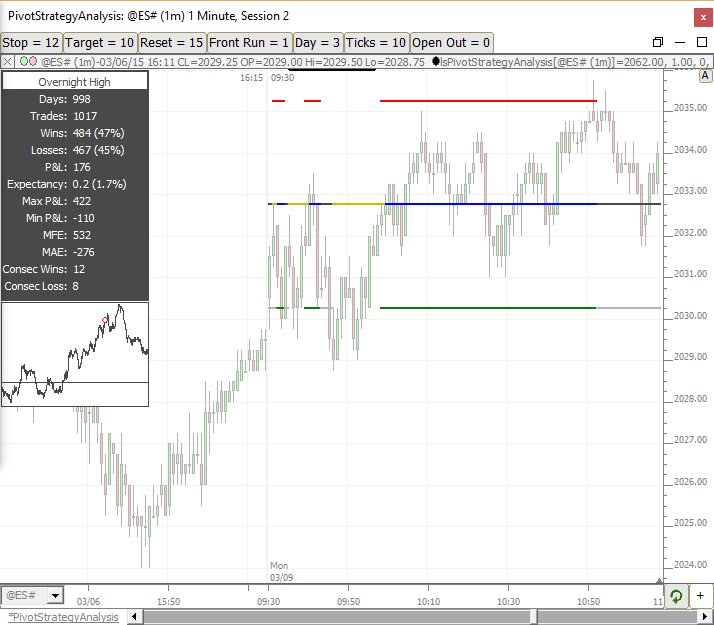
In this video, Homework #26, we explore the effectiveness of key daily price levels and study how price reacts to these key levels, accumulating reaction data over any user-specified period of time. The RTX Indicator Pivot Strategy Analysis (PSA) is an extremely powerful indicator that is custom made to simplify this type of analysis. In this video, we take a look specifically at how price reacts to the day session midpoint. We also explore the use of the Pivot Strategy Optimizer indicator for optimizing variables such as reset distance, target, and stop.