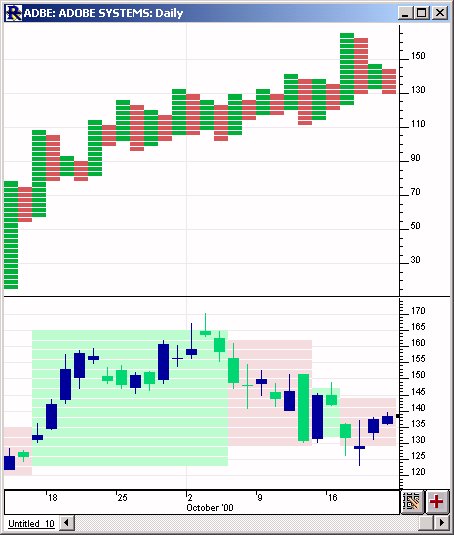
Point and Figure Highs and Lows - Missing Volume
This video explains how point and figure bars are formed and why volume is often missing at the high or low prices of PNF bars (ghost or phantom prices). It also explains how to set a configuration variable, PnfConventionalHighLows, to FALSE, to avoid this situation.