lsSlopeLines (@ES#)
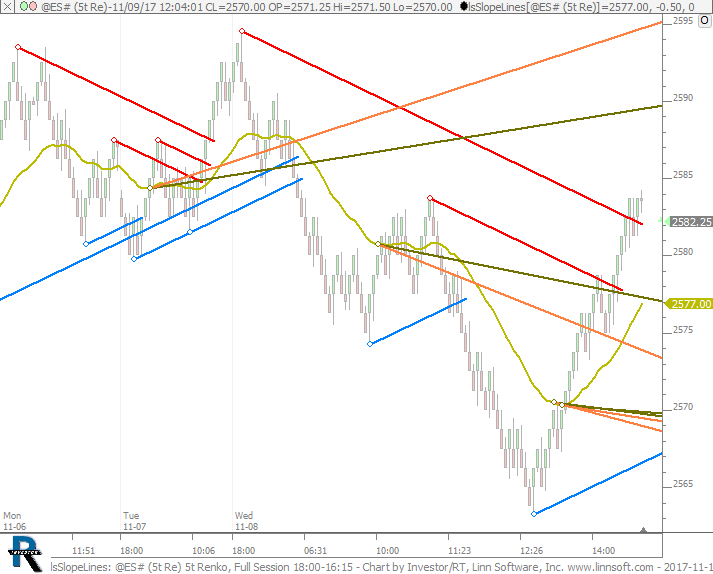
lsSlopeLines. This chart was uploaded by Investor/RT 13.1.1 showing symbol: @ES#.
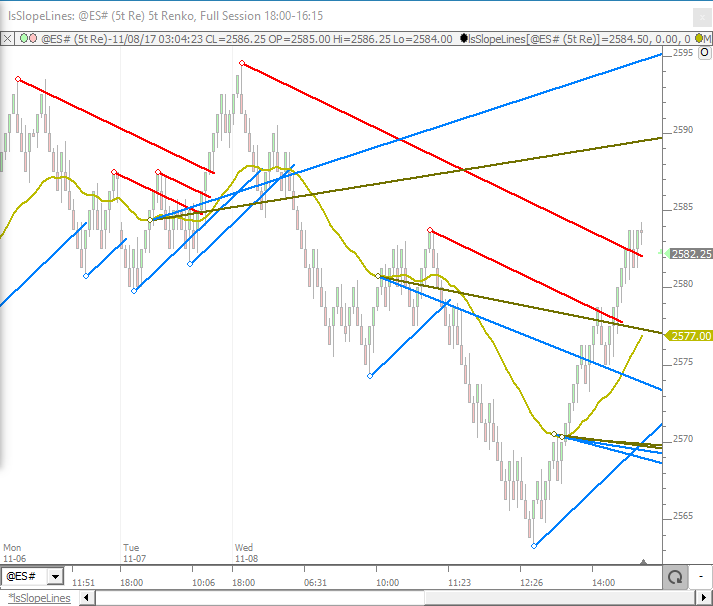
lsSlopeLines. This chart was uploaded by Investor/RT 13.1.1 showing symbol: @ES#.
SlopeLines is an RTX Extension indicator that automates the drawing of trendlines using signals and custom indicators, giving the user complete control over where the lines begin, the starting price of the lines, the slope of the lines, and how far the lines extend. Users control how far back the lines will be drawn. Options are availble to project the lines into the past, as well as to draw up to 6 additional lines from each starting point each with a unique multiple of the original slope and unique color/style.
Trendlines are one of the basic trading tools used to follow trends in market data. They are easy to draw in Investor/RT using the trendline drawing tool: click on a starting point; drag and drop on the ending point. Investor/RT has some trendline automation features as well that attempt to determine the current trend and auto draw lines to depict the trend. Introducing SlopeLines - a new tool that takes trendline automation to the limit.
This chart was uploaded by Investor/RT 13.1.1 showing symbol: @ES#.
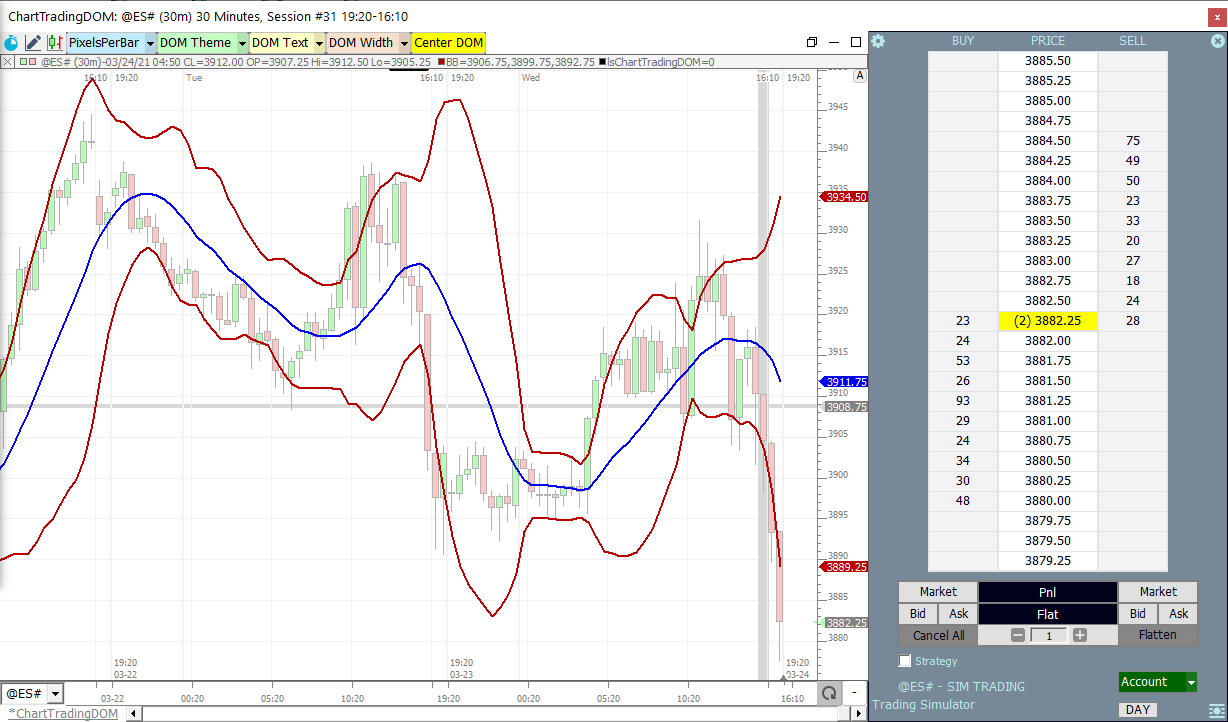
ChartTradingDOM Sample Chart with Bollinger Bands and DOM Buttons

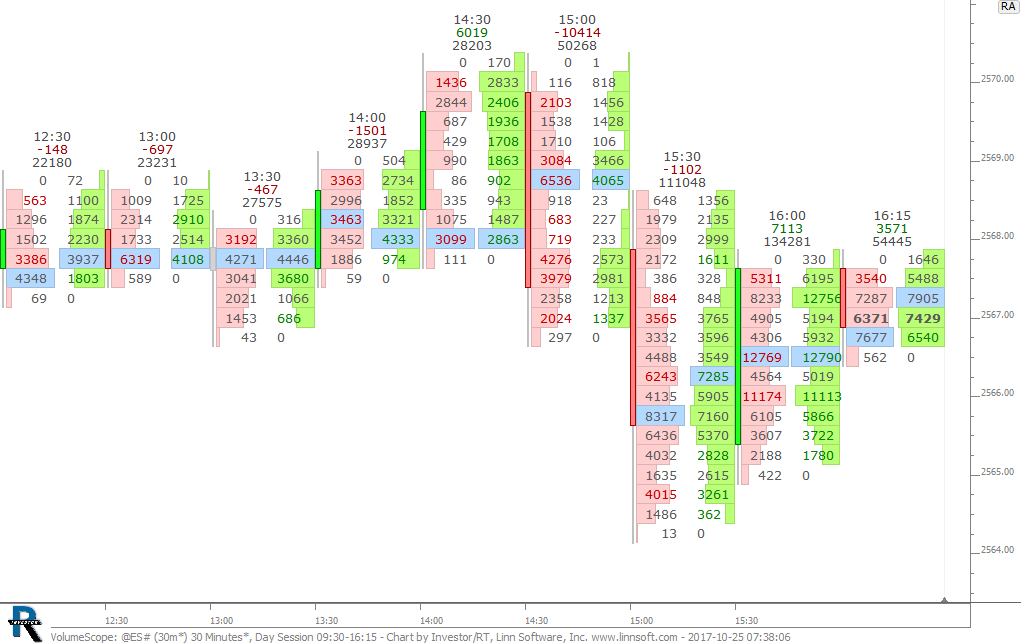
Linn Software is a leading innovator of market data profiling and volume analysis charting tools for professional traders, creating indicators and real-time market data displays to help traders to identify profit making opportunities and to make more timely trading decisions. Some of our most advanced work in this area was developing the Footprint™ feature, previously available on a charting platform developed by Linn Software, powered by Investor/RT but marketed and distributed by MarketDelta.
VolumeScope® allows the user to view each bar under a microscope and closely inspect the volume at price data with great flexibility. VolumeScope has three primary components: Background, Text, and Candle, each optional and each with a variety of data and presentation options. Volume is broken down into Ask Volume (Buying) and Bid Volume (Selling) at each price and the VolumeScope builds upon this information with profiling, coloring, and scaling options based upon relative volume, delta, imbalance, and much more.
This video takes a close look at the data, color, and scaling options available within the Background Component of the VolumeScope® Indicator.

This video takes a close look at the data, color, and scaling options available within the Text and Background Components of the VolumeScope® Indicator.
This video covers a variety of ways to manipulate the vertical and horizontal space required by the VolumeScope® Indicator. Because VolumeScope often displays text at each price, it has unique requirements with respect to the amount of vertical and horizontal space available for each price. The video explains how to adjust using the scroll wheel, by dragging scales, and using the button indicator.