RTX

ChartTradingDOM (RTX)

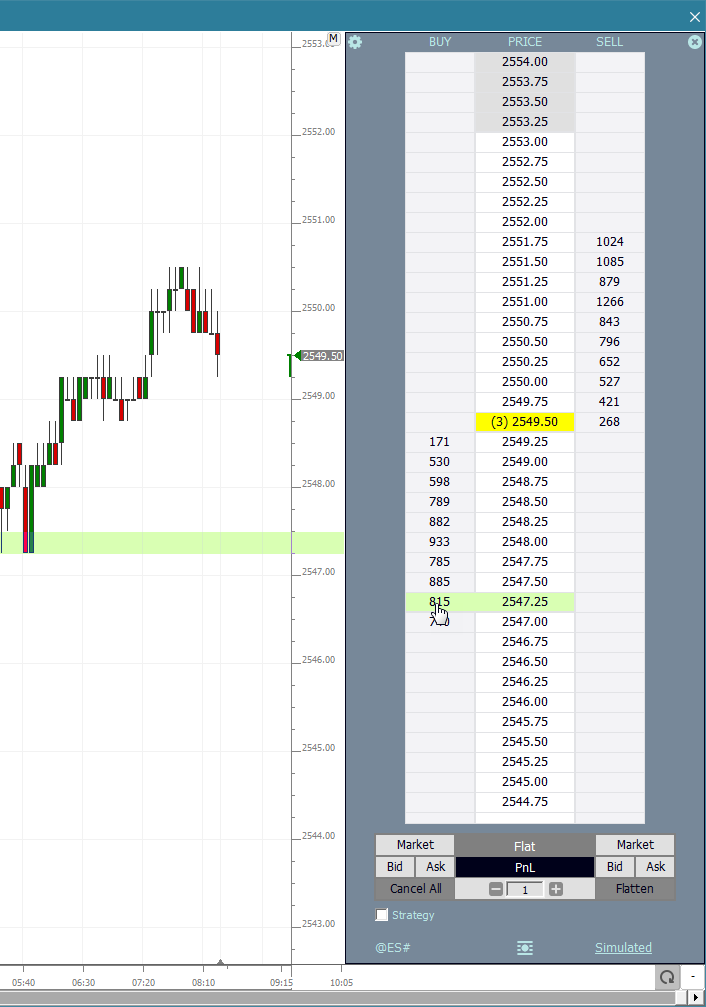
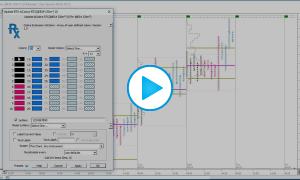
ChartTradingDOM an RTX extension available to all Investor/RT subscribers. To invoke the DOM, right-click in any multi-pane chart and choose Trade... The ChartTradingDOM is a price ladder supporting single click in the Buy or Sell column to place limit/stop orders at specific prices. For users of RIthmic and CQG order routing, server side OCO bracket orders are supported using  Trading Strategy setups.

Spread Matrix (RTX)

The Spread Matrix RTX extension is designed to automatically compute the optimal number of contracts of shares for each component of a pair.

Paint Indicator 2.5 Innovations: Shapes and Labels

Paint Indicator 2.5 Innovations: Shapes and Labels

This video highlights new innovations in Paint Indicator 2.5 and beyond including flexible labeling and custom shapes. A number of new custom shape styles are available including: Circle, Diamond, Arrow, Triangle, Wedge, Flag, Laser, Hammer, Plus, Clock, and Label Only. Most shapes also have an orientation option of up, down, left, or right. All shapes are candidates for painting, variable sizing, and gradient coloring. Label options are now available, complete with options to label with multiple custom indicator values, custom text, or time. Indicator values have a display format option.

Scatter Plot (RTX) Introduction

Scatter Plot (RTX) Introduction

ScatterPlot takes two custom indicators and plots one on the horizontal (X Axis) and one on the vertical (Y Axis) and then computes a best fit polynomial regression line through the data of user-specified degree. Any two custom indicators may be used for the data set of this analysis. Each data point represent the values of the two custom indicators on any given bar. Each bar is represented with a point/dot in the scatter plot. As a simple example, a user may want to plot the daily volume against the daily range.

Paint Indicator 2.0 (RTX) New Drawing Options

Paint Indicator 2.0 (RTX) New Drawing Options

This video highlights a number of exciting new drawing options available in version 2.0 of the Paint Indicator (RTX). New vertical positioning options are available including Offset from Top, Offset from Bottom, Offset from High, and Offset from Low. Six new drawing styles exist including Stack Blocks, Stack Dots, Dots (Custom), Blocks (Custom), Circle (Custom) and Square (Custom). These styles offer a great deal of flexibility with respect to horizontal positioning of the drawn shape within each bar and enable users to maximize the horizontal space available.

Colors (RTX) Introduction

Colors (RTX) Introduction

The Colors Indicator is designed to feed the Profiles Indicator custom colors and/or custom letters for TPOs. Up to 50 colors and letters may be customized. When the Letters option of the Profile Indicator is turned on and lsColors is chosen for the colors, the Profile Indicator will then pull the colors and letters from the lsColors indicator in the same chart (if present). If 10 colors are specified in the Colors indicator, but there are more than 10 TPOs in a profile, the color wrap back around and the 11th TPO would use the 1st color, 12th TPO would use the 2nd color, etc.

Boundaries (RTX) Introduction

Boundaries (RTX) Introduction

The Boundaries indicator is designed to allow user to manually identify and mark boundaries (bars or date/times) which can then be used effectively by other indicators such as the Profile Indicator and the Price Statistics Indicator. Visually, the Boundary Indicator is a horizontal strip at a user-specified height upon which user can click to mark or unmark any bars as the start and/or ending boundary. A single instance of the Profile Indicator can feed off the Boundaries to provide the starting and ending bars for multiple profiles and facilitate splitting and merging profiles.

Pages