Shape Indicator
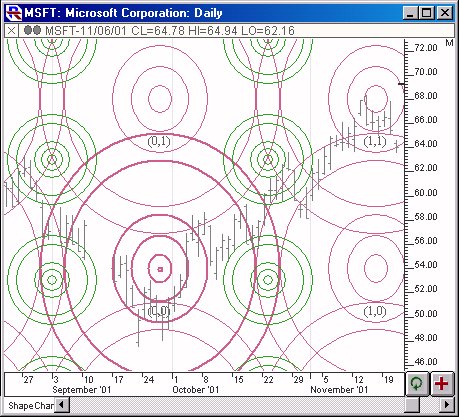
The Shape indicator is a drawing tool indicator with a button on the chart toolbar to faciliate drawing shapes at the desired location in the chart. The button depicts a red square and a blue circle. Click the toolbar button to activate the drawing tool; the cursor will change to a pencil. Drag a rectangle encompassing the region where the Shape is to be drawn. Once the Shape is in place, it can be moved by dragging the small dot which is either in the center, or lower left corner of the shape (depending on whether Center on Coordinates is checked in the Shape preferences).