GC Layout003f (QGC#)
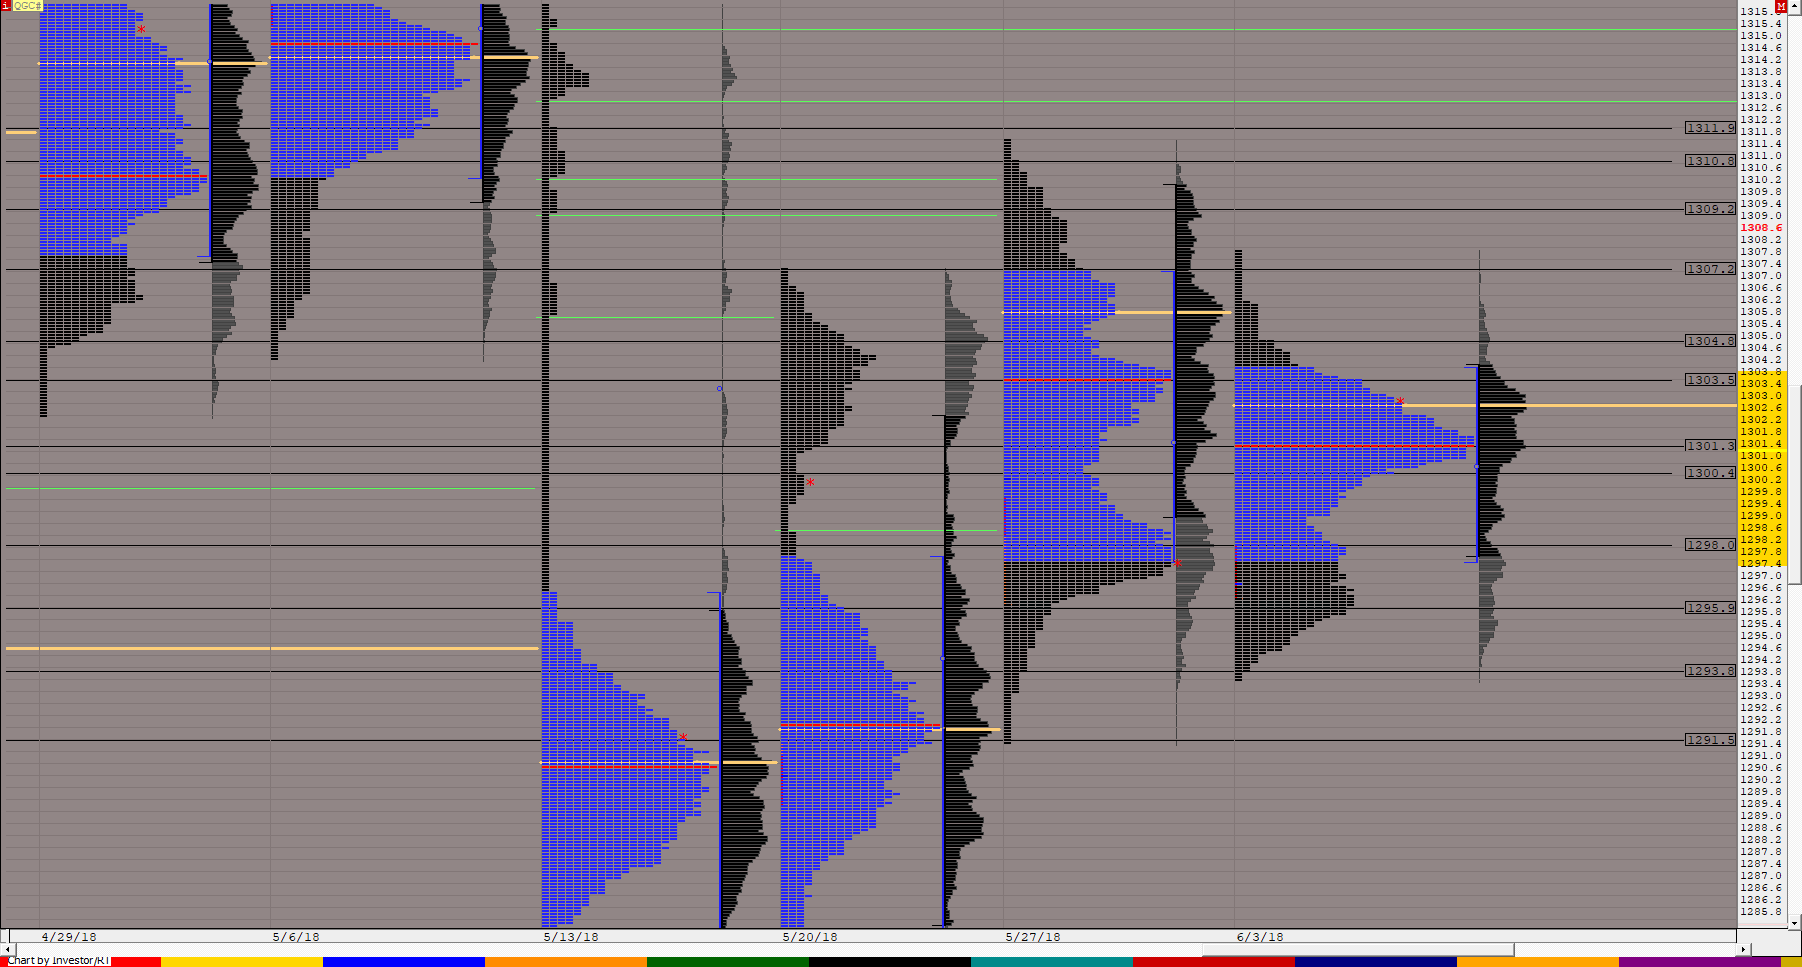
This chart was uploaded by Investor/RT 13.3.3 showing symbol: QGC#.
This chart was uploaded by Investor/RT 13.3.3 showing symbol: QGC#.
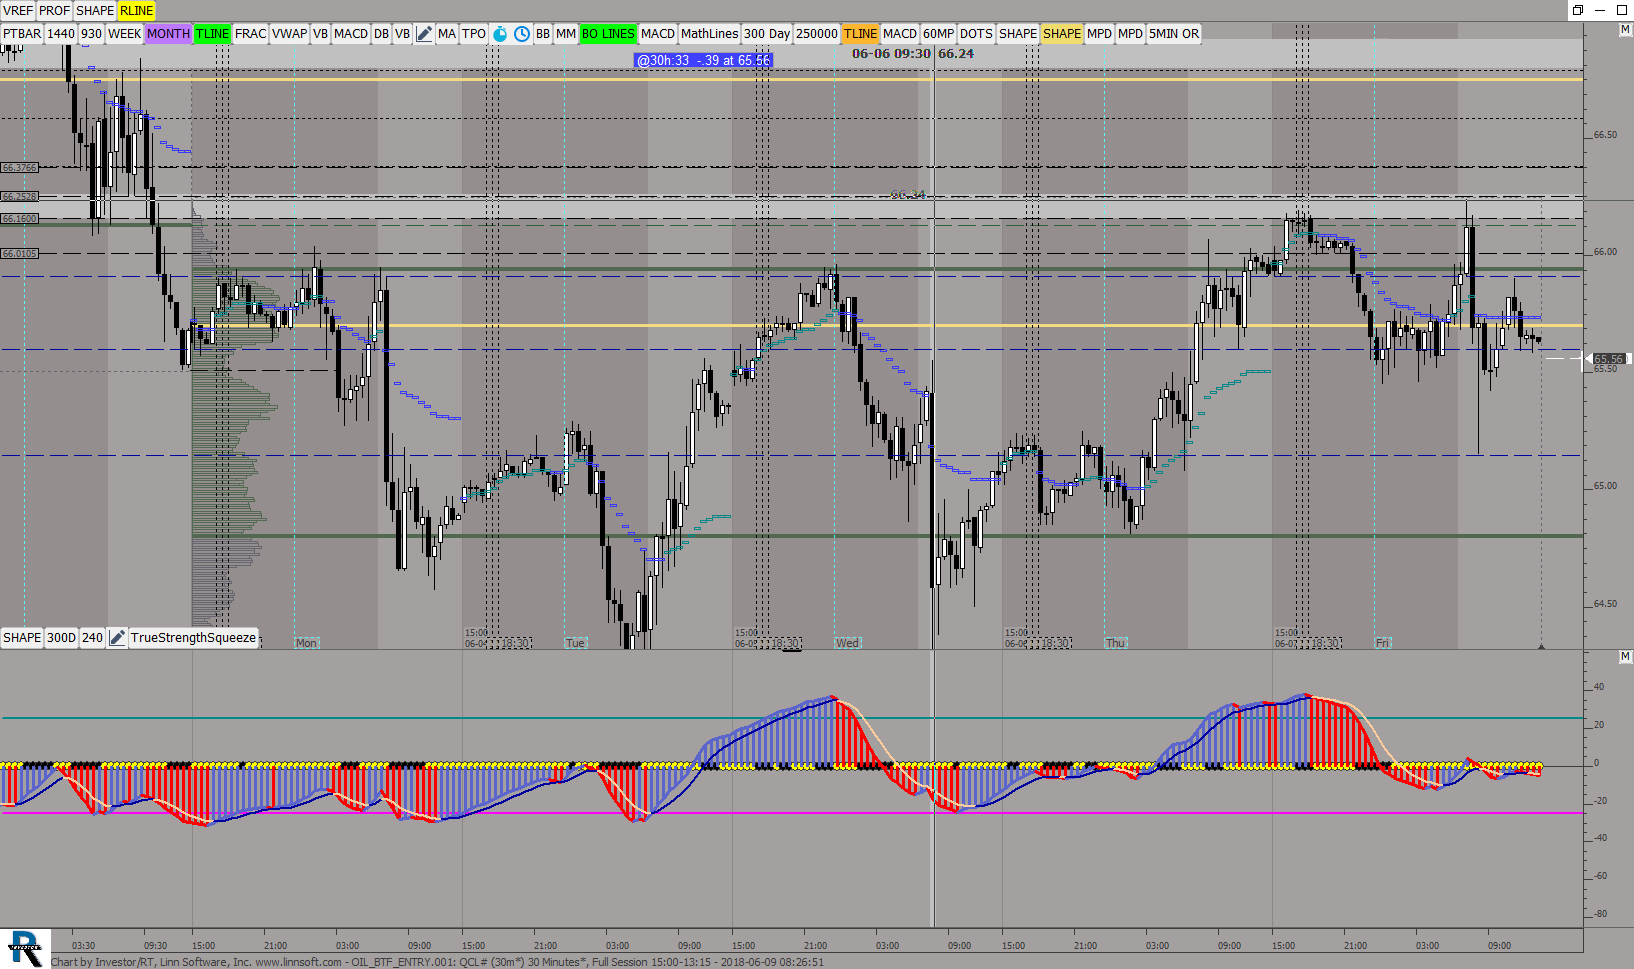
This chart was uploaded by Investor/RT 13.3.3 showing symbol: QCL#.
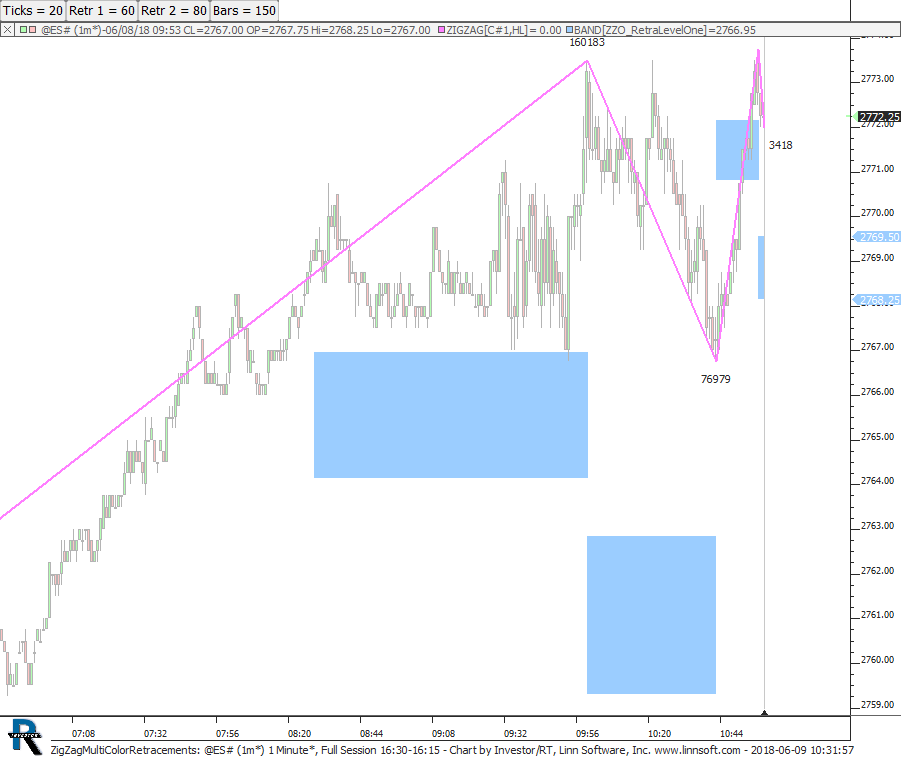
This chart was uploaded by Investor/RT 13.3.3 showing symbol: @ES#.
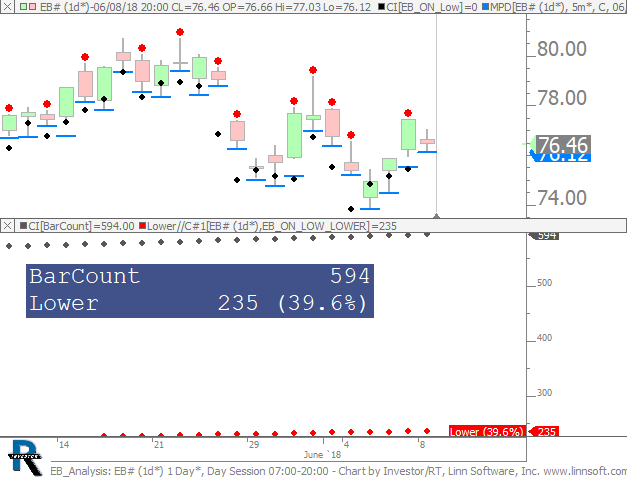
Analysis of IB Overnight Lows. This chart was uploaded by Investor/RT 13.3.4 showing symbol: EB#.
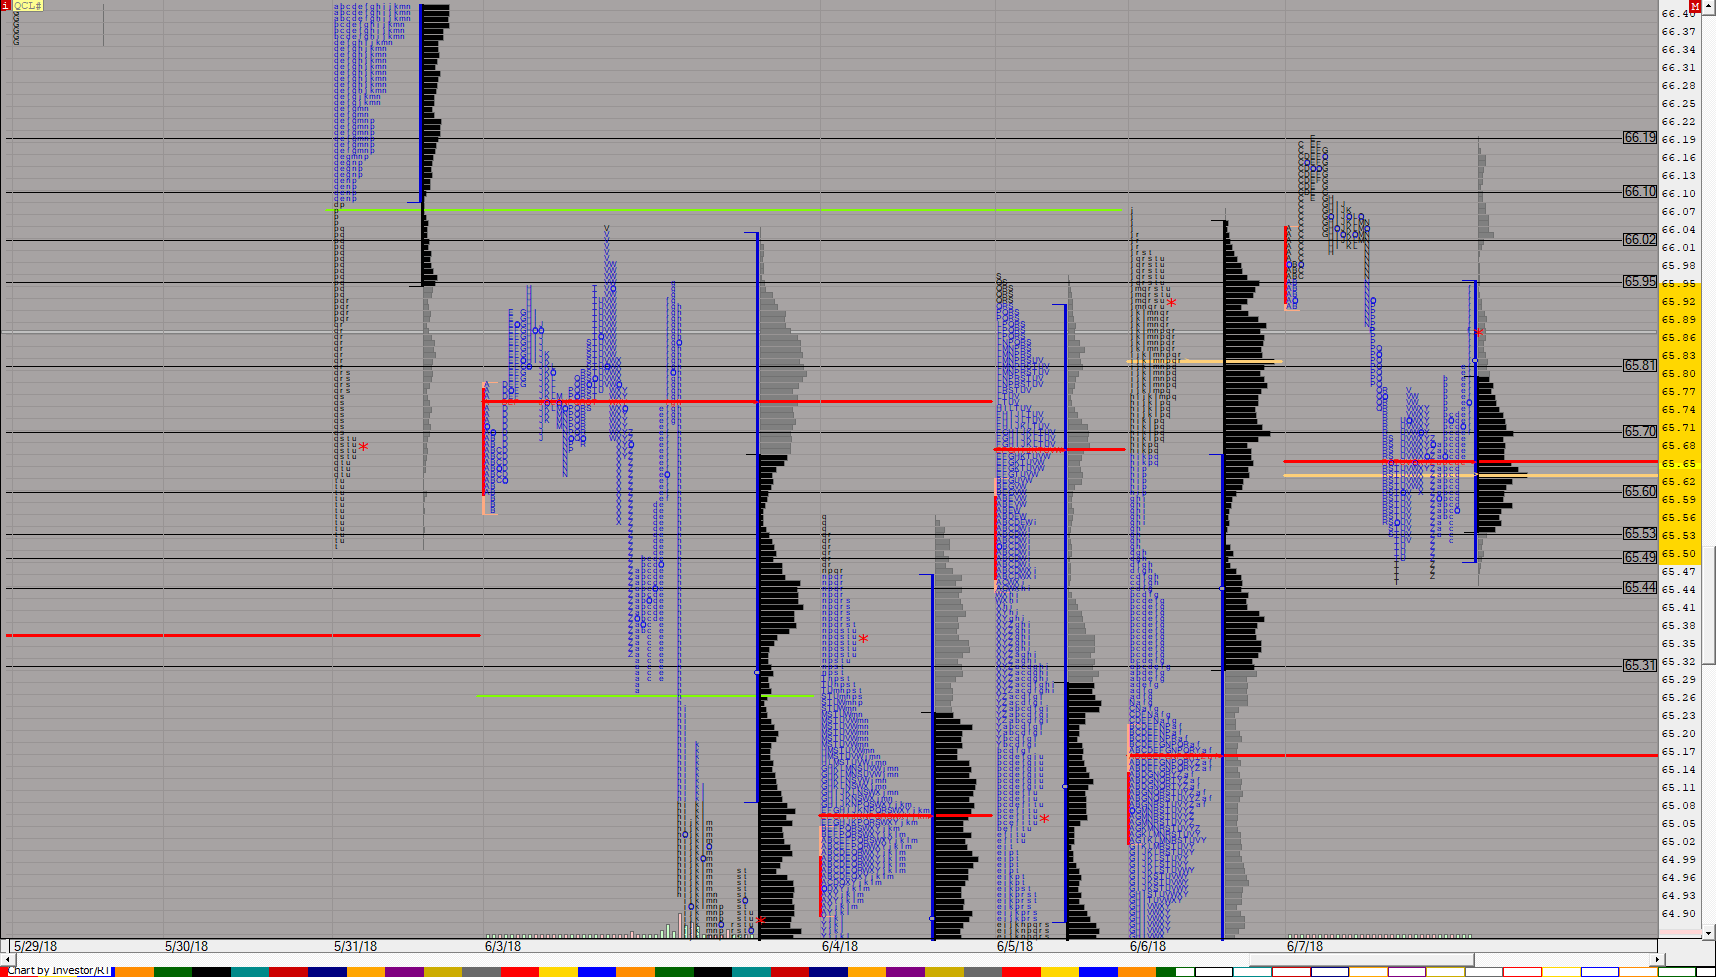
This chart was uploaded by Investor/RT 13.3.3 showing symbol: QCL#.
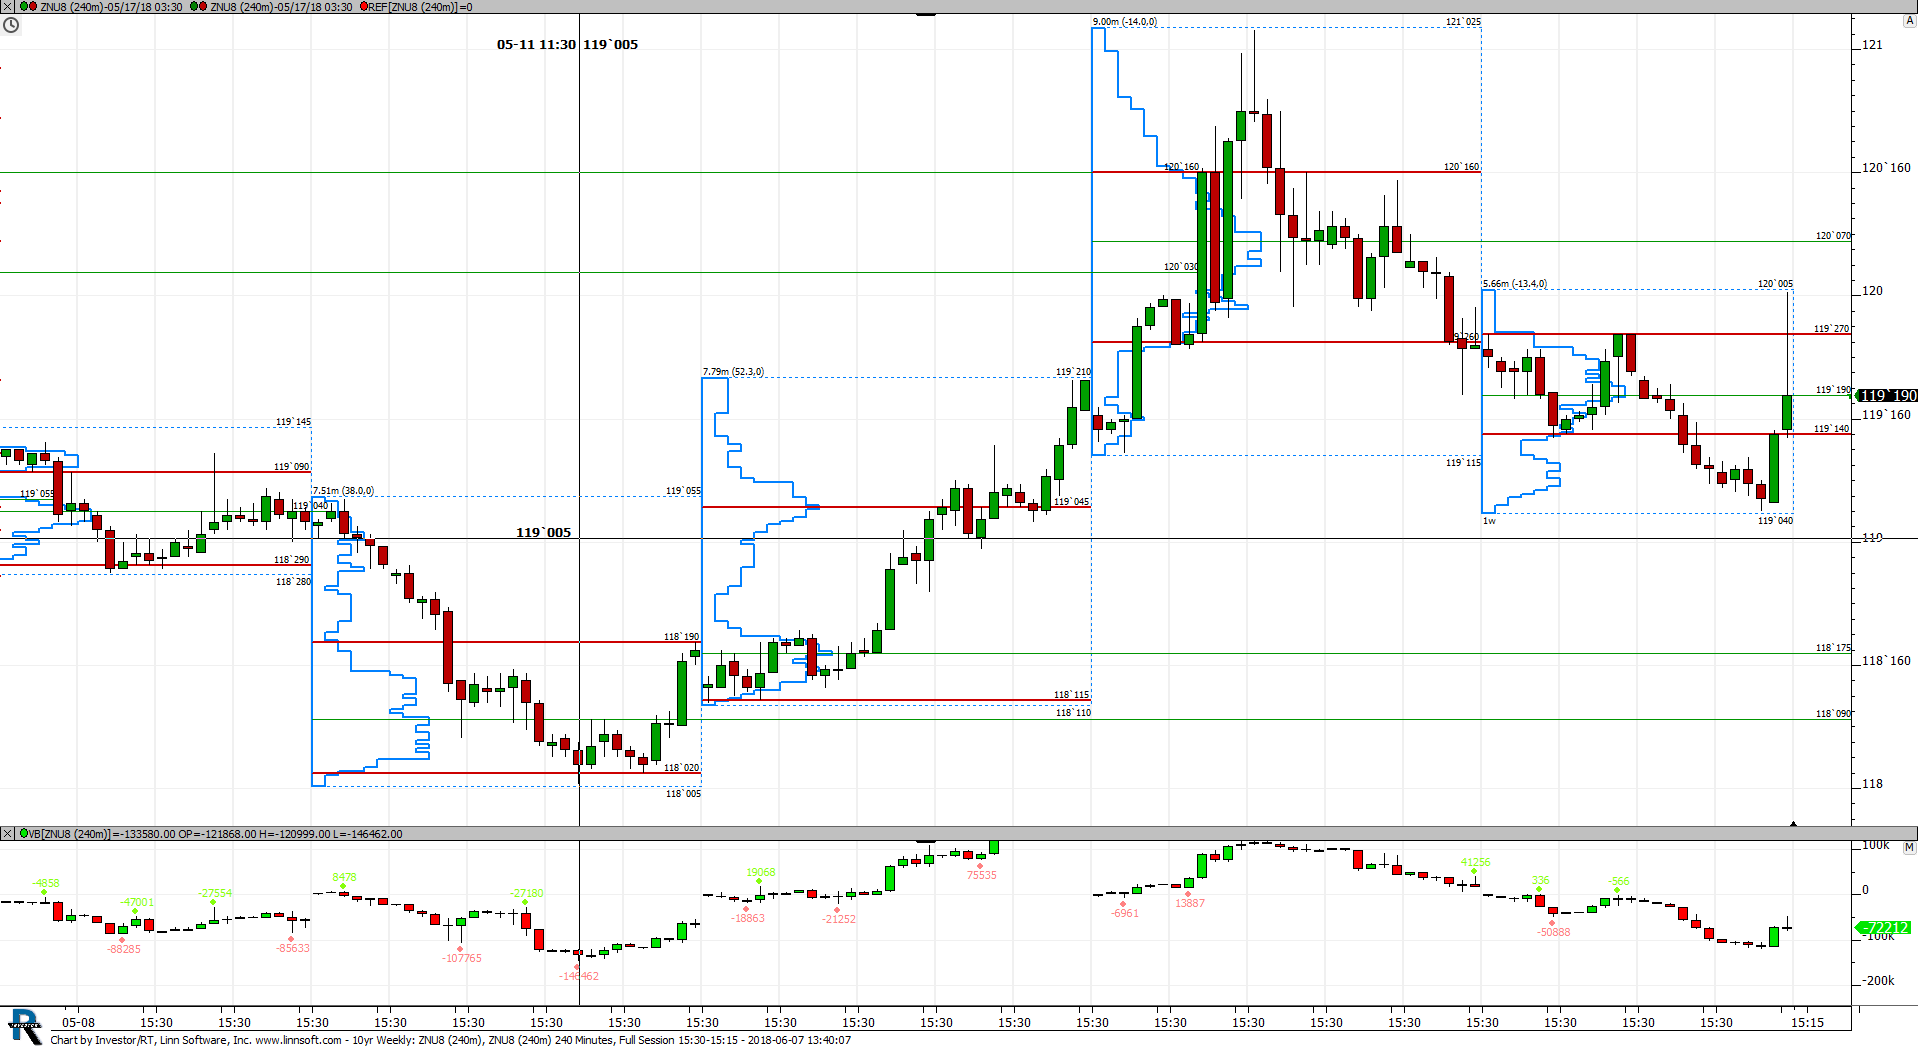
This chart was uploaded by Investor/RT 13.3.3 showing symbol: ZNU8.
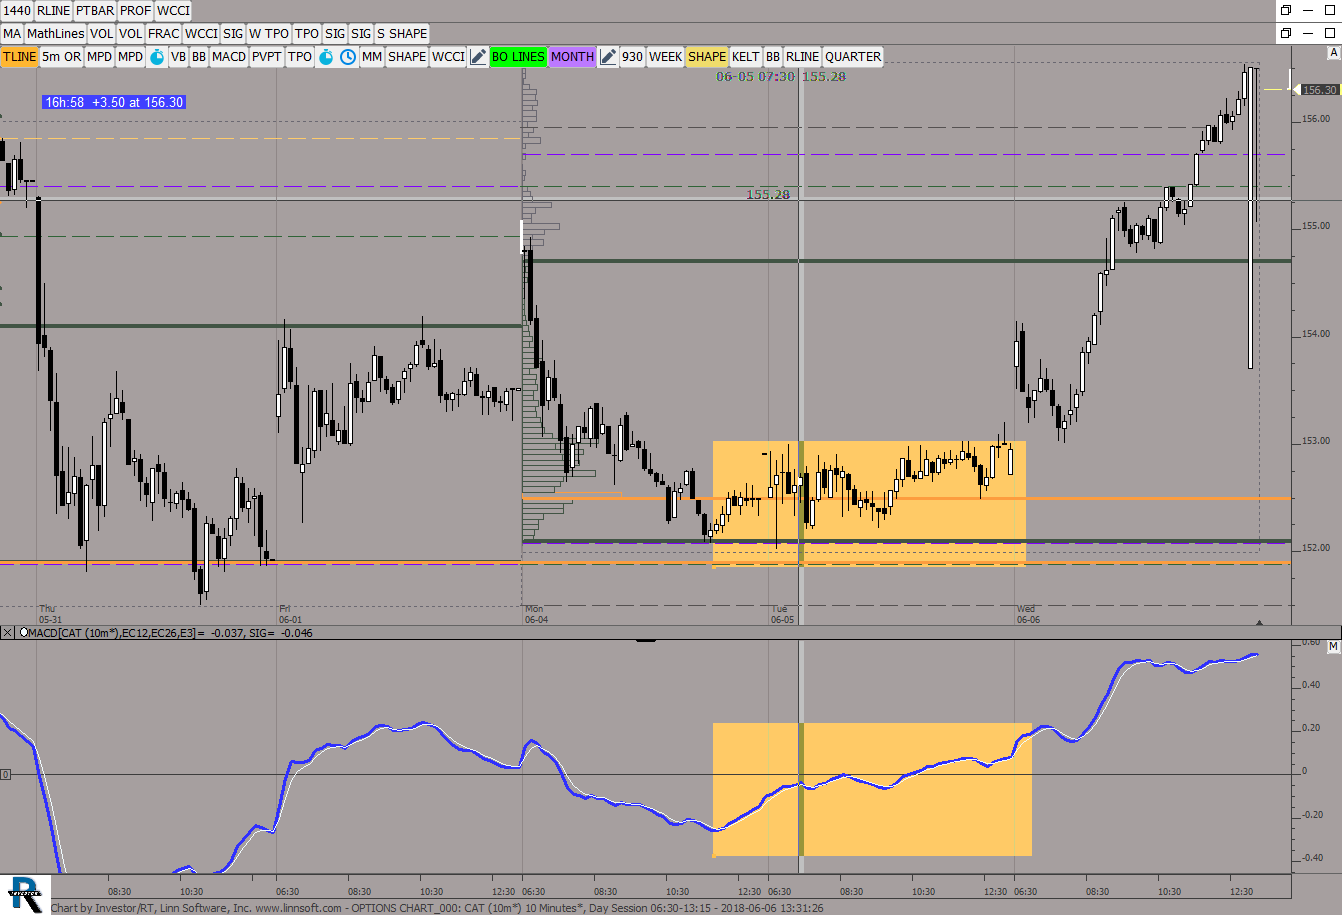
This chart was uploaded by Investor/RT 13.3.3 showing symbol: CAT.
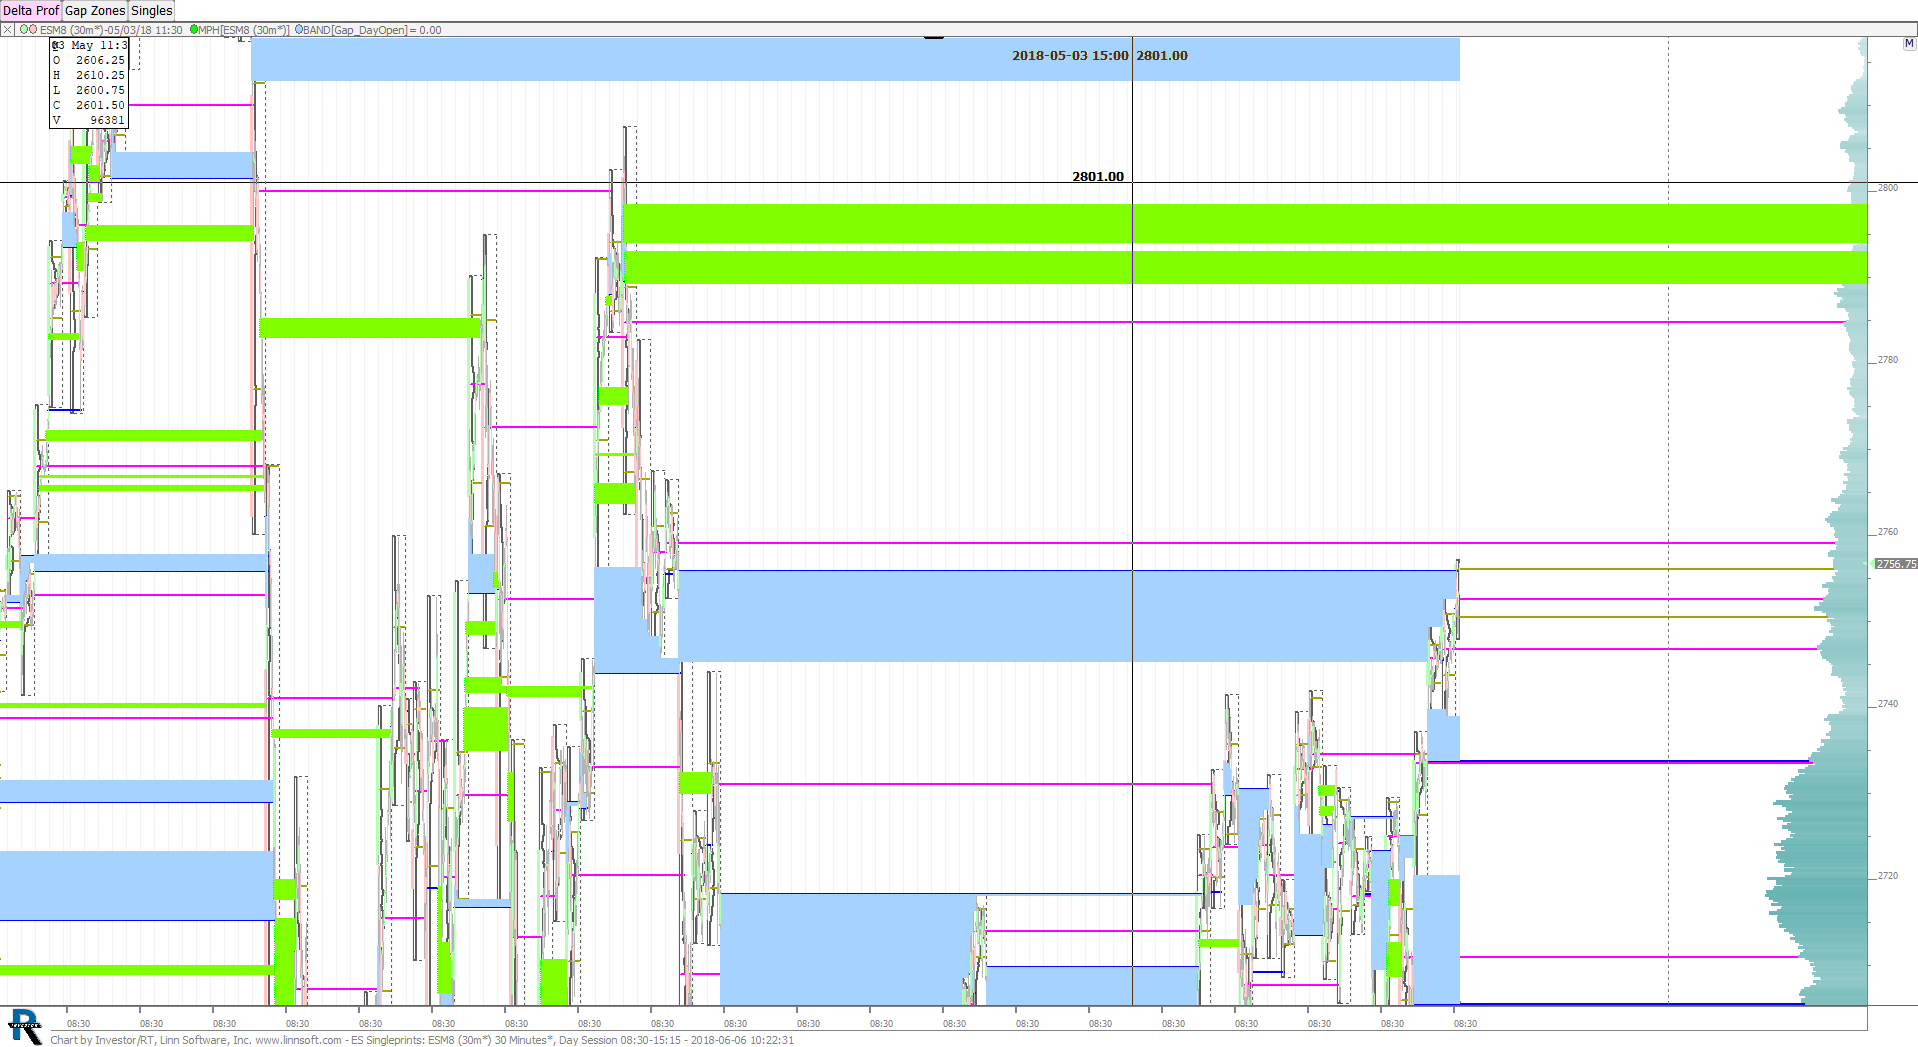
This chart was uploaded by Investor/RT 13.3.3 showing symbol: ESM8.
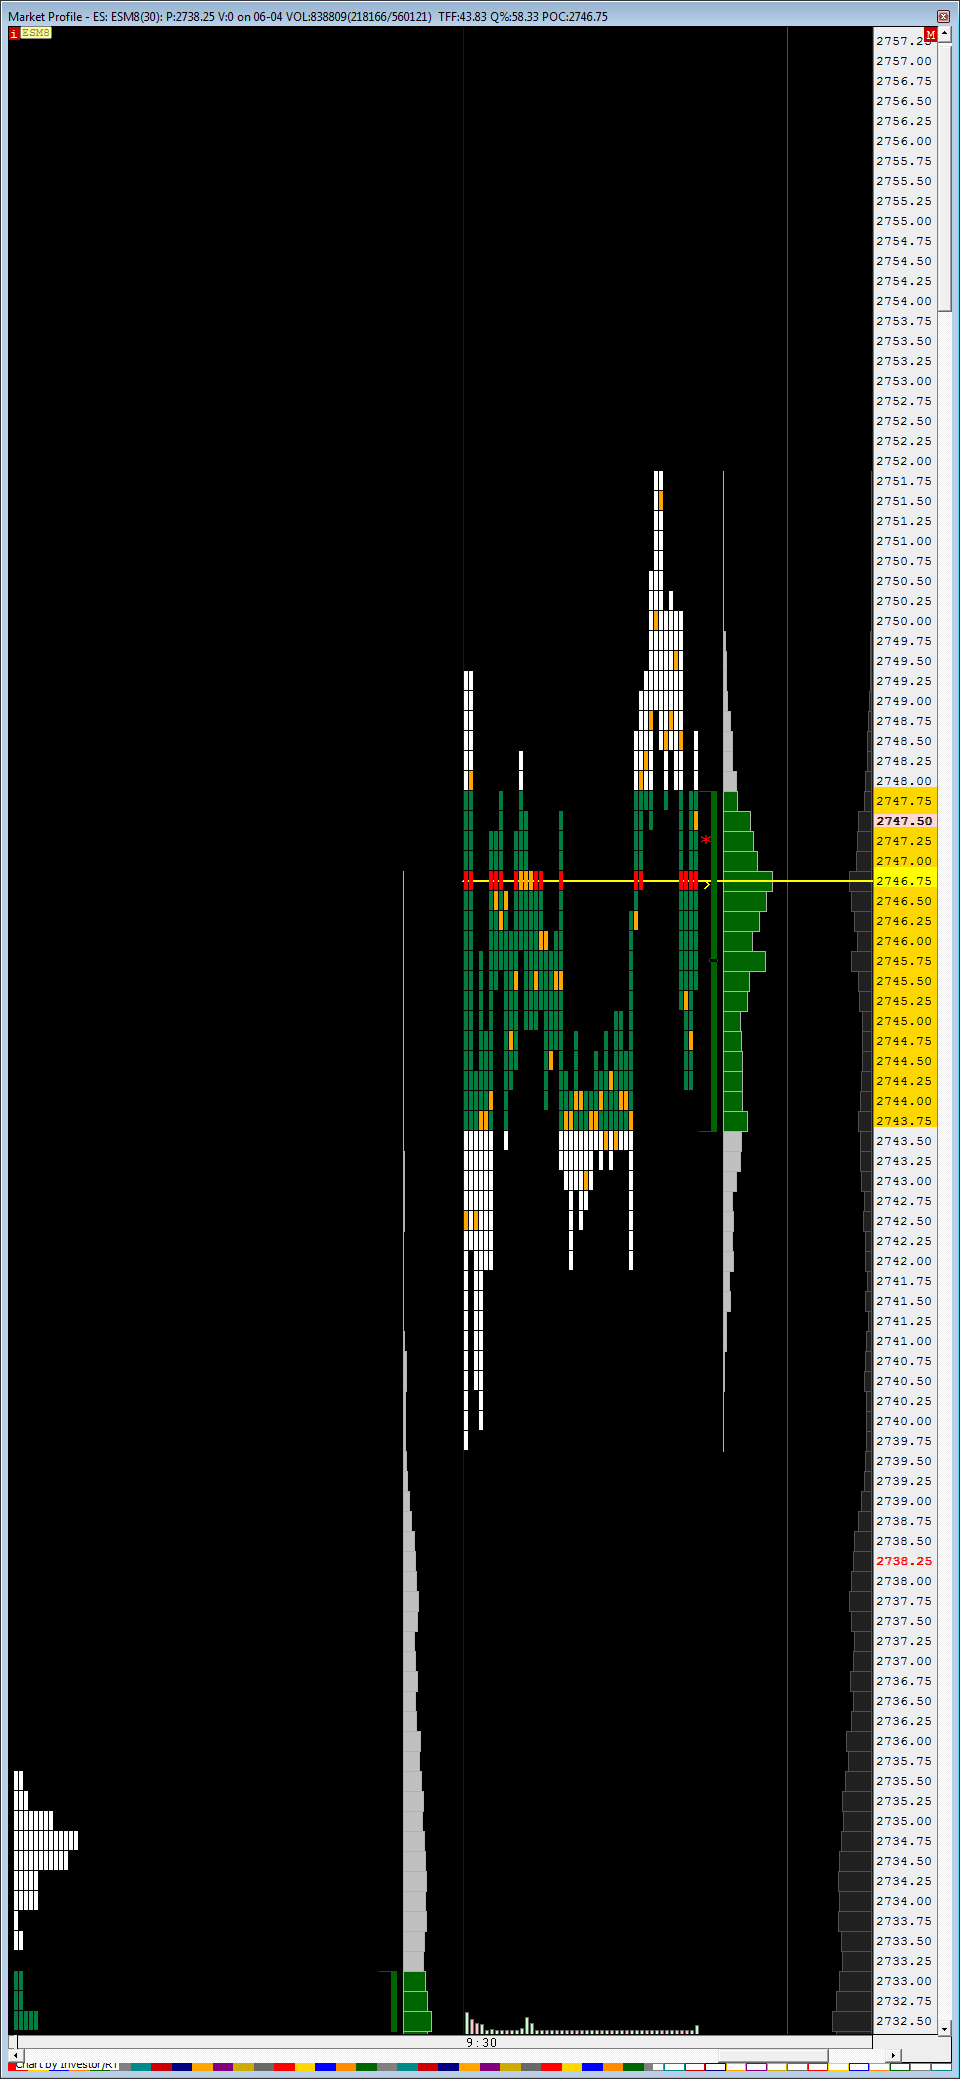
This chart was uploaded by Investor/RT 13.3.3 showing symbol: ESM8.
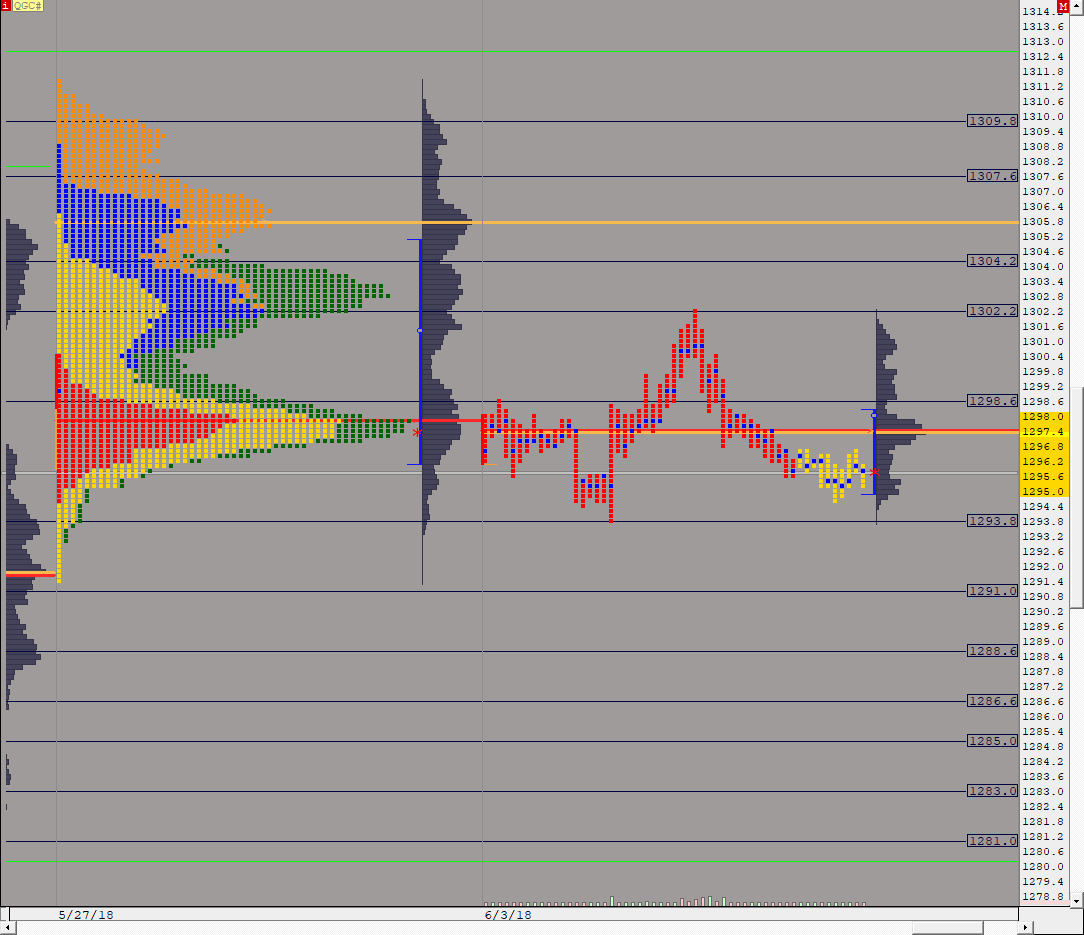
This chart was uploaded by Investor/RT 13.3.3 showing symbol: QGC#.