CL VOL ABOVE BELOW VPOC (QCL#)
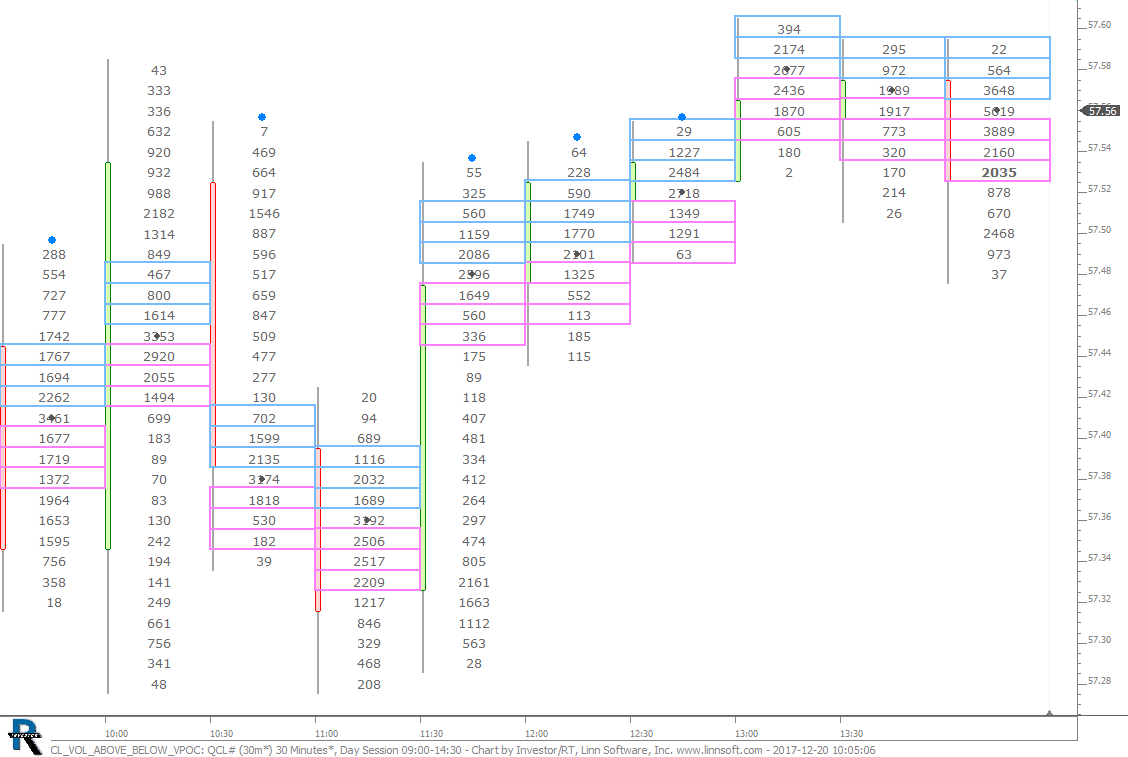
This chart was uploaded by Investor/RT 13.1.4 showing symbol: QCL#.
This chart was uploaded by Investor/RT 13.1.4 showing symbol: QCL#.
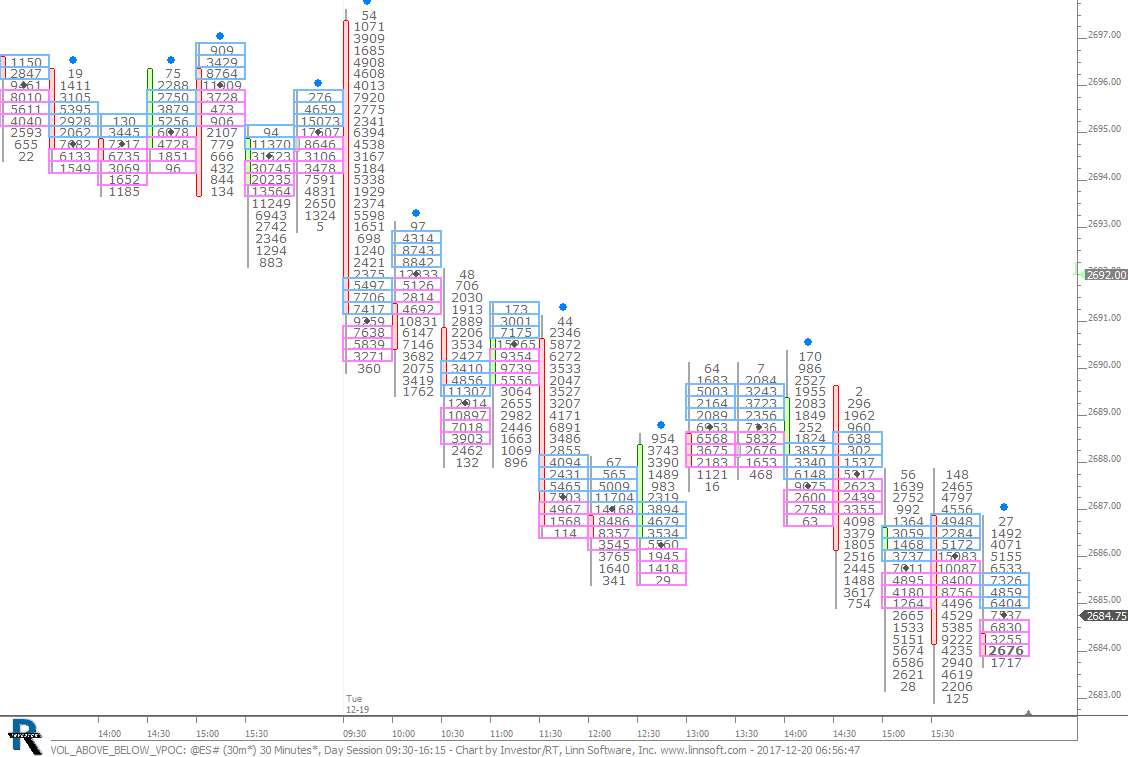
Volume 3 Prices Above and Below VPOC. This chart was uploaded by Investor/RT 13.1.4 showing symbol: @ES#.
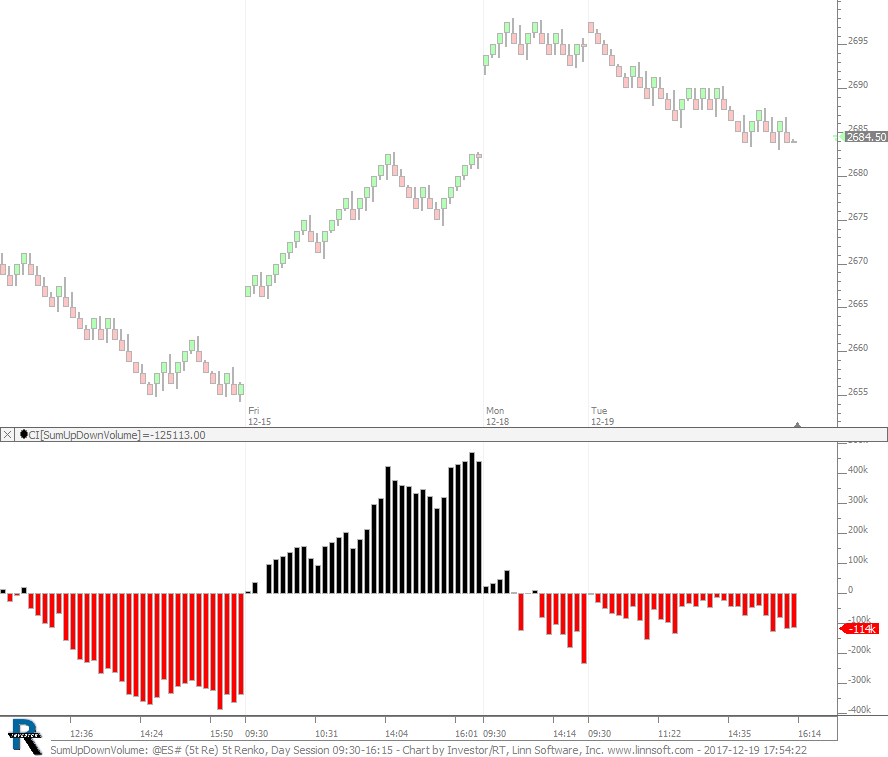
Sum Up Down Volume for Session. This chart was uploaded by Investor/RT 13.1.4 showing symbol: @ES#.
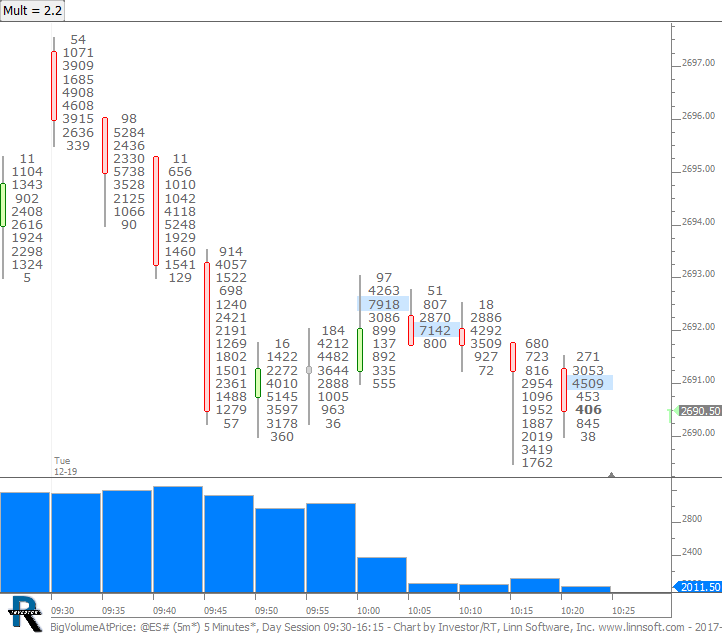
Chart identifies large volume at price relative to average volume at price of previous 9 bars. Use button to control multiplier. This chart was uploaded by Investor/RT 13.1.4 showing symbol: @ES#.
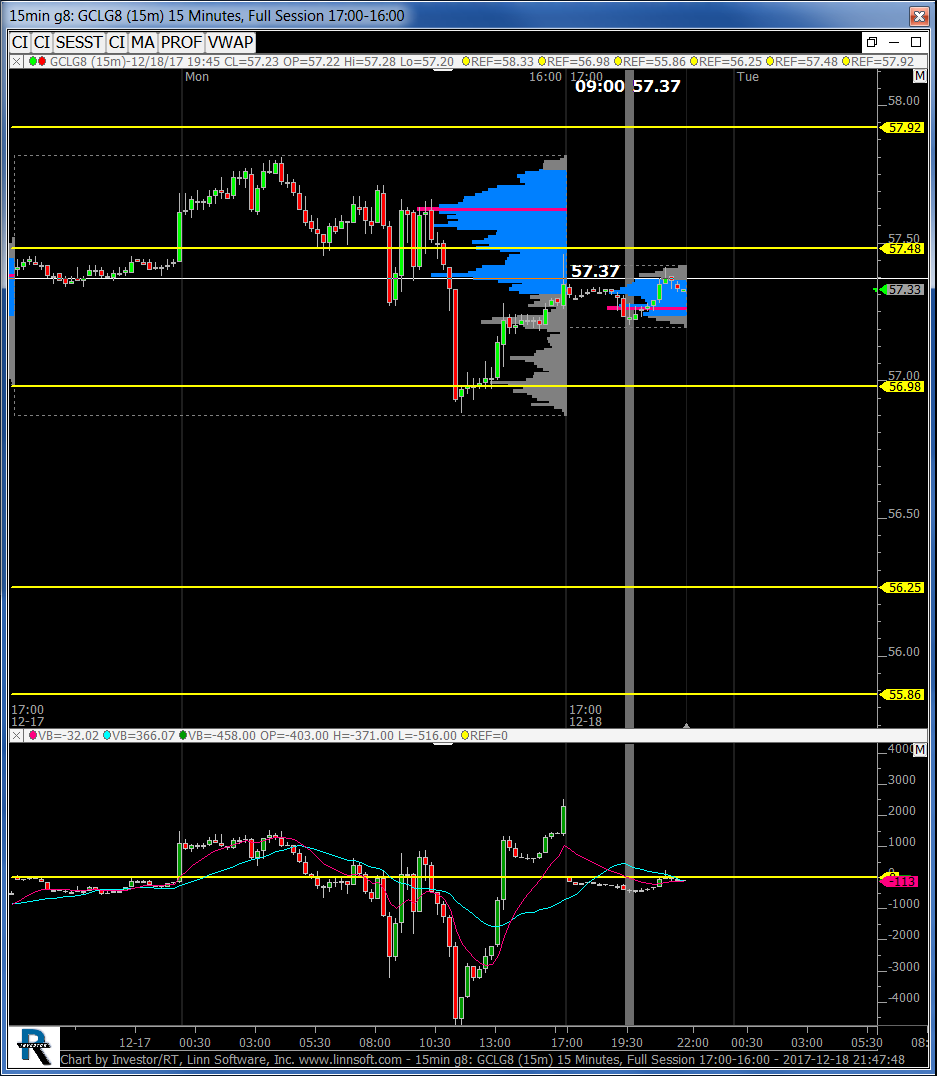
15 min g8. This chart was uploaded by Investor/RT 13.1.2 showing symbol: GCLG8.
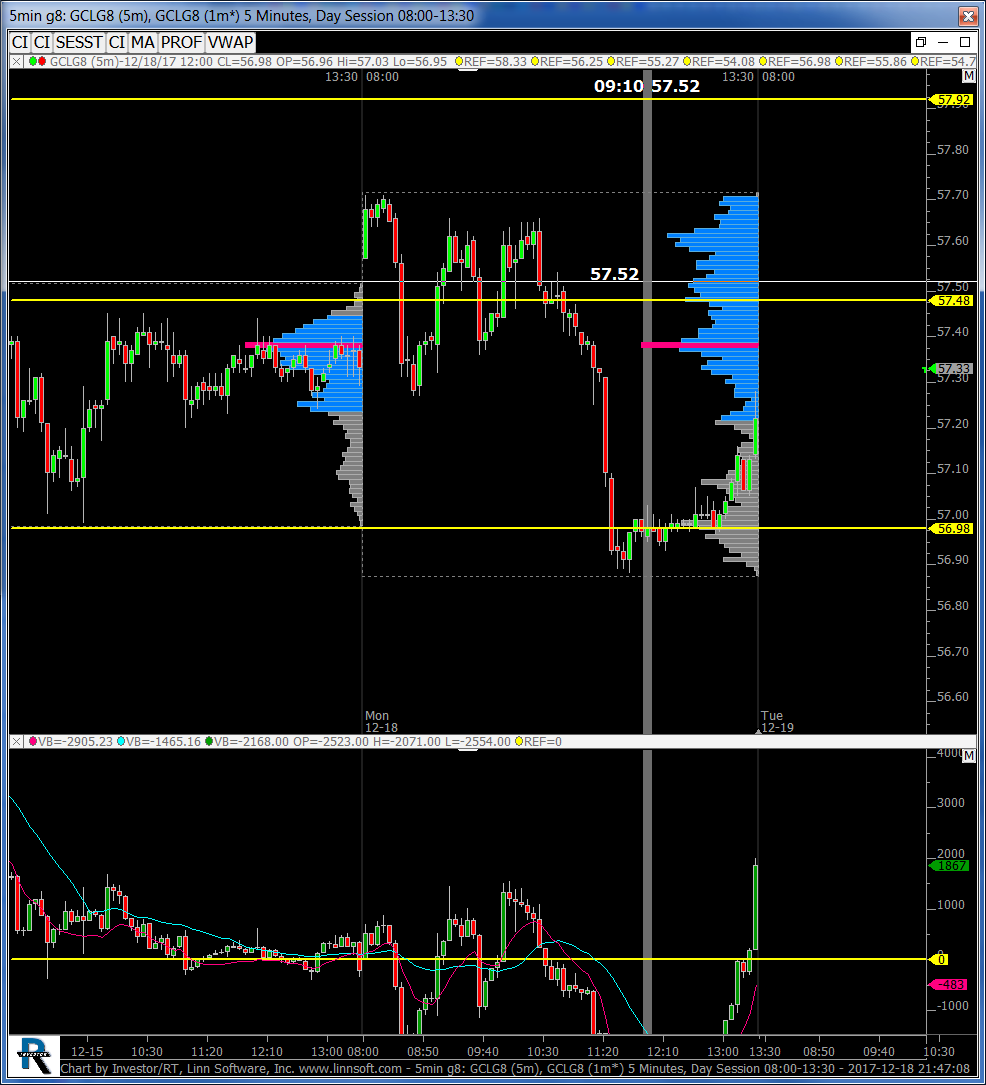
5m g8. This chart was uploaded by Investor/RT 13.1.2 showing symbol: GCLG8.
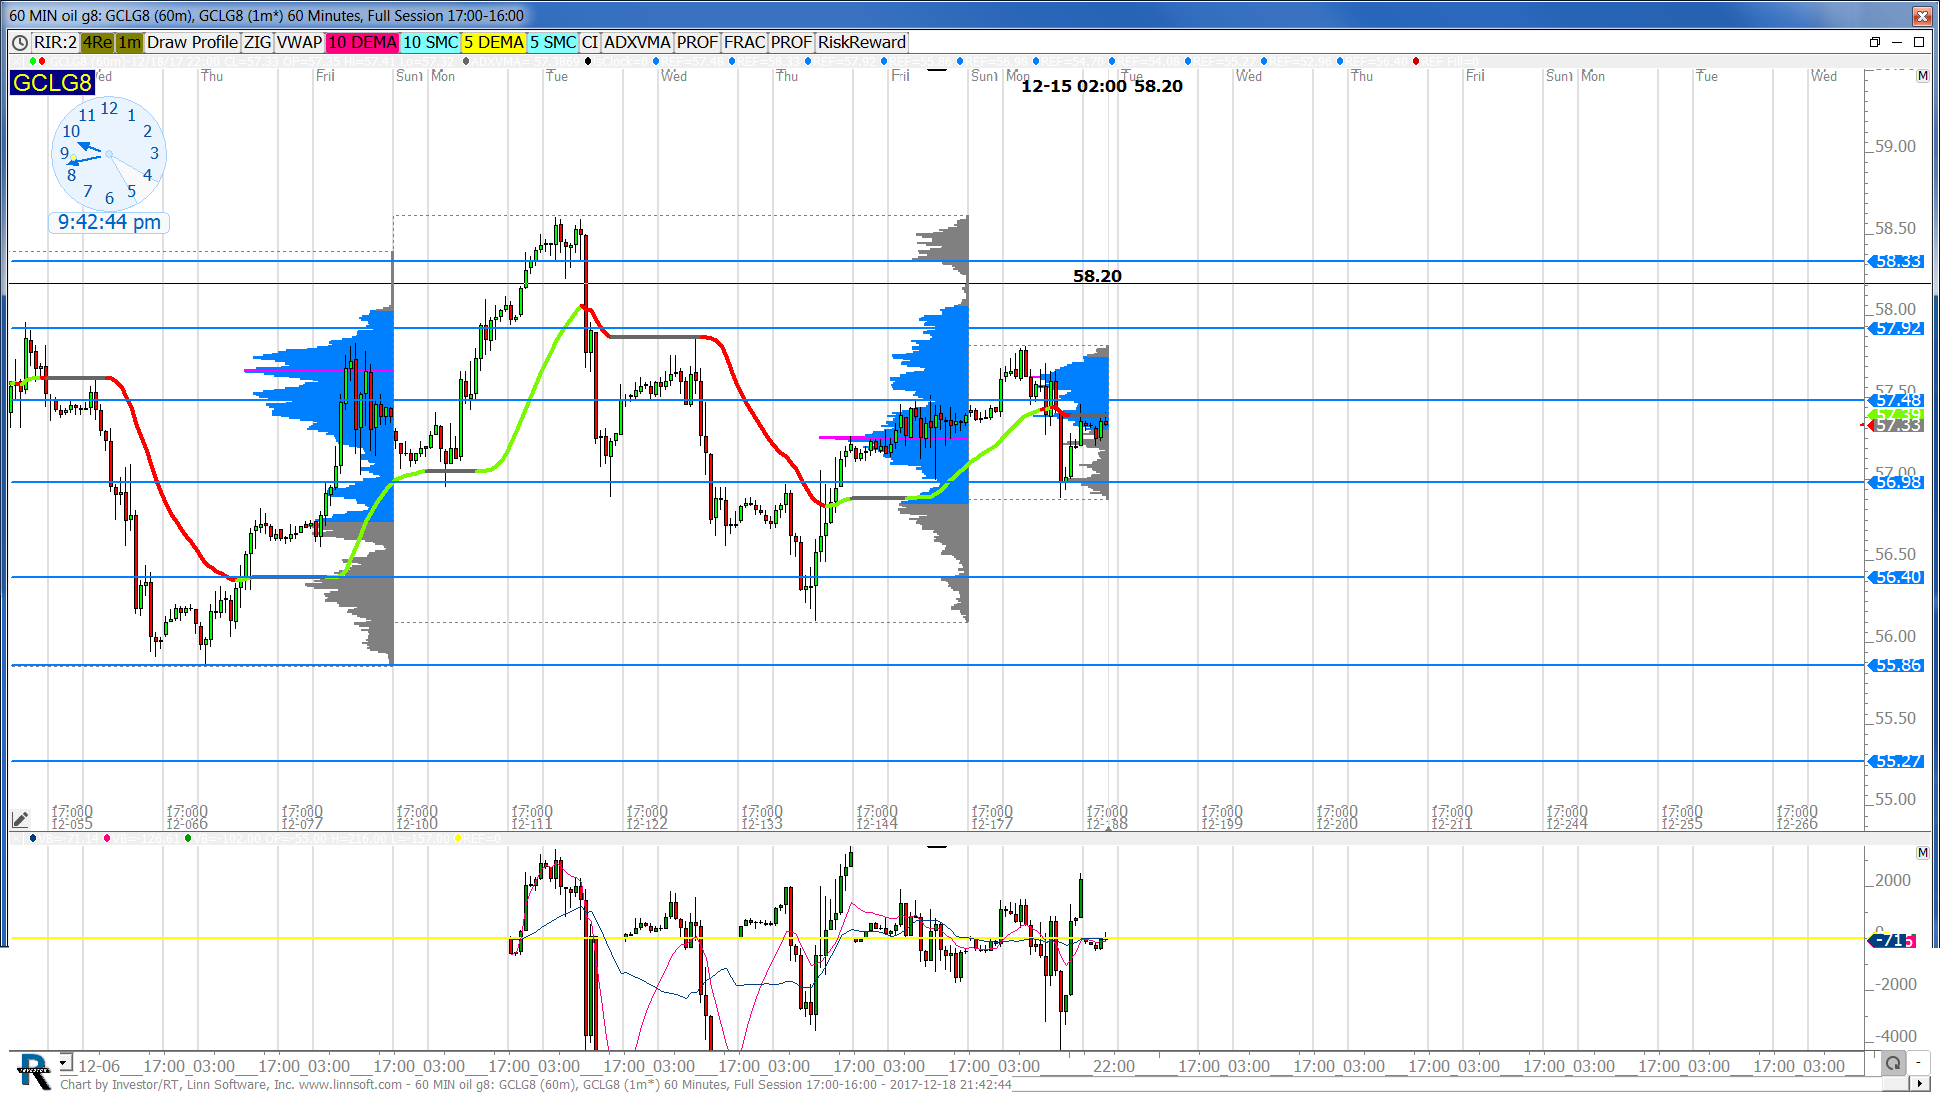
60. This chart was uploaded by Investor/RT 13.1.2 showing symbol: GCLG8.
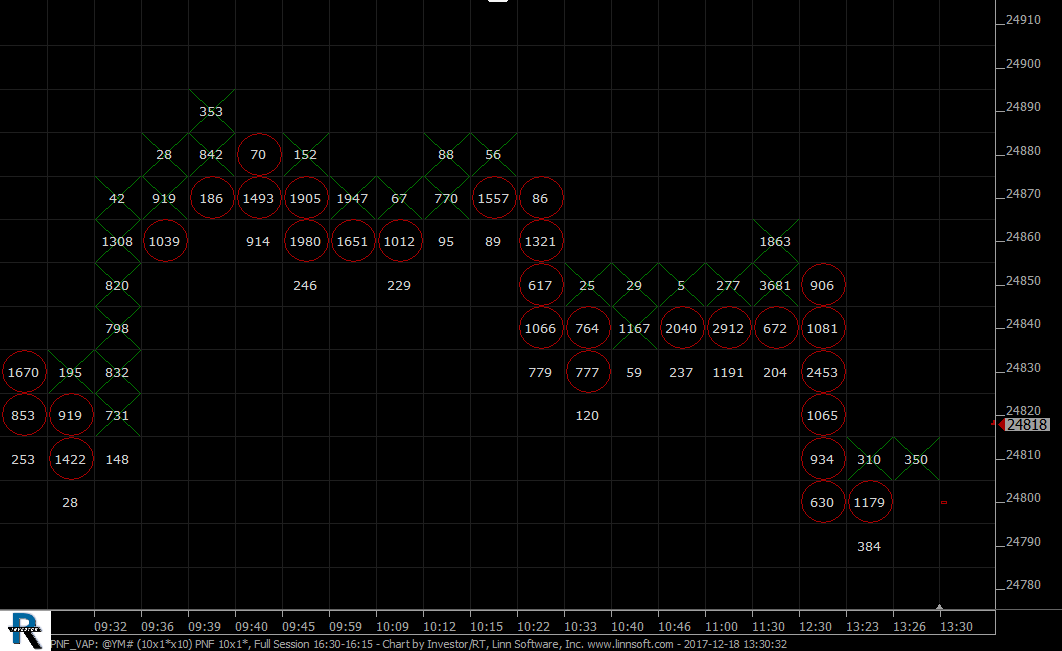
Point and Figure with Volume at Price. This chart was uploaded by Investor/RT 13.1.4 showing symbol: @YM#.
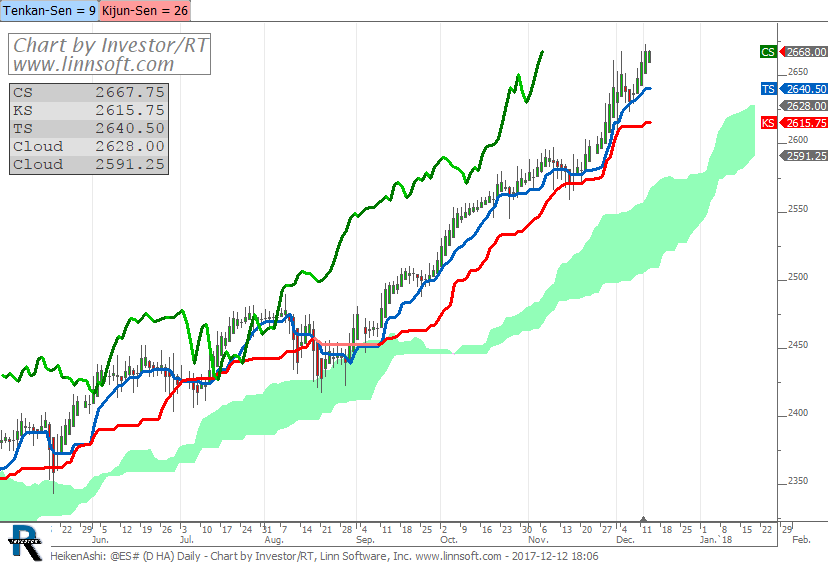
Heiken-Ashi with Ichimoku Kinko Hyo. This chart was uploaded by Investor/RT 13.1.1 showing symbol: @ES#.
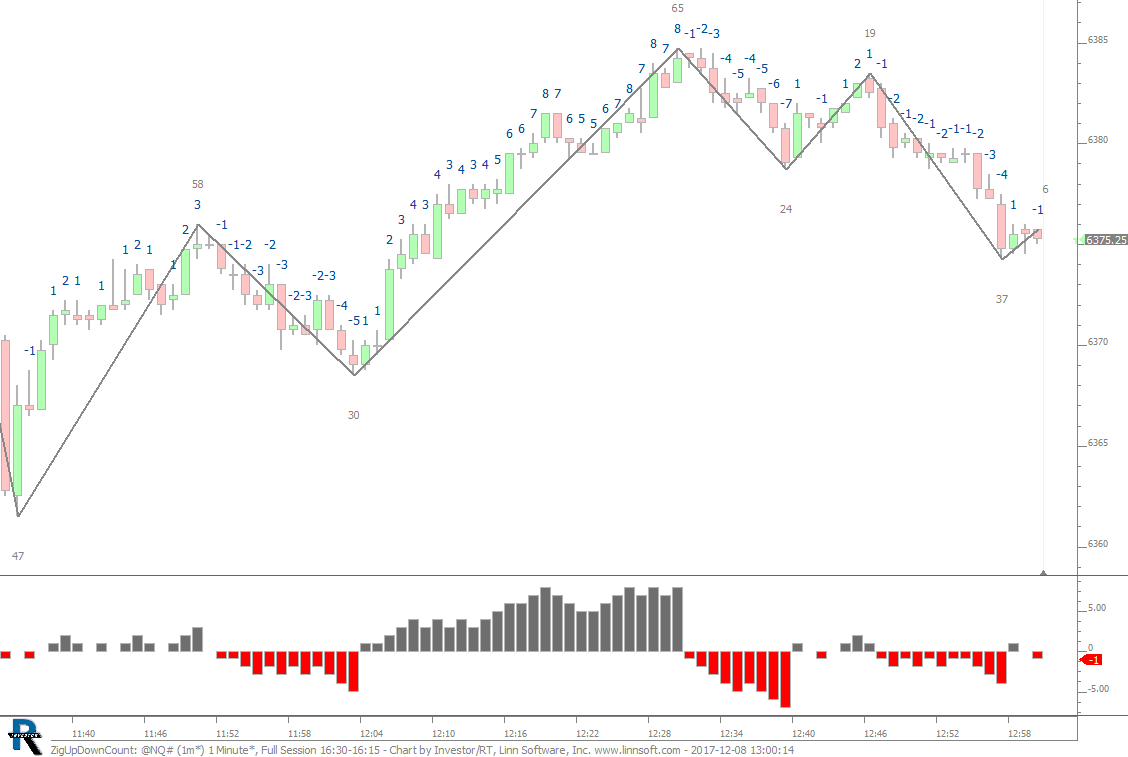
Counting Cumulative Up and Down Bars In Each Move. This chart was uploaded by Investor/RT 13.1.1 showing symbol: @NQ#.