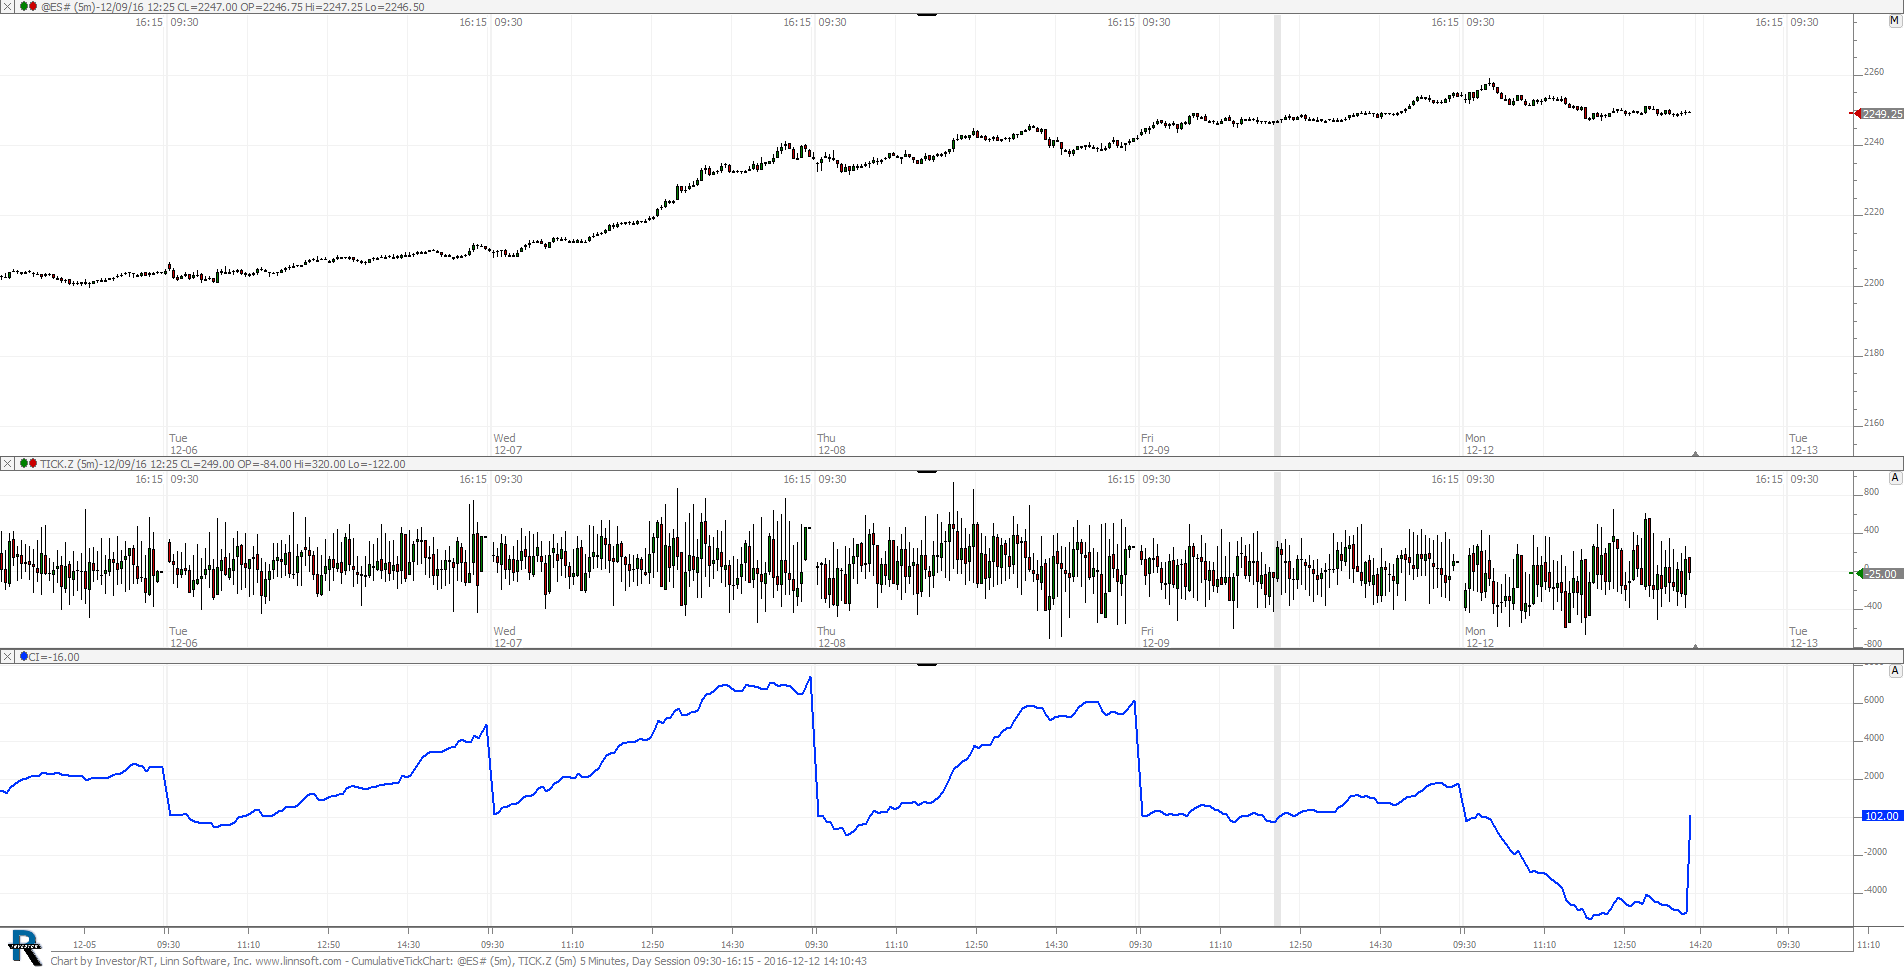
CustomTickInstrument (TICK.Z)
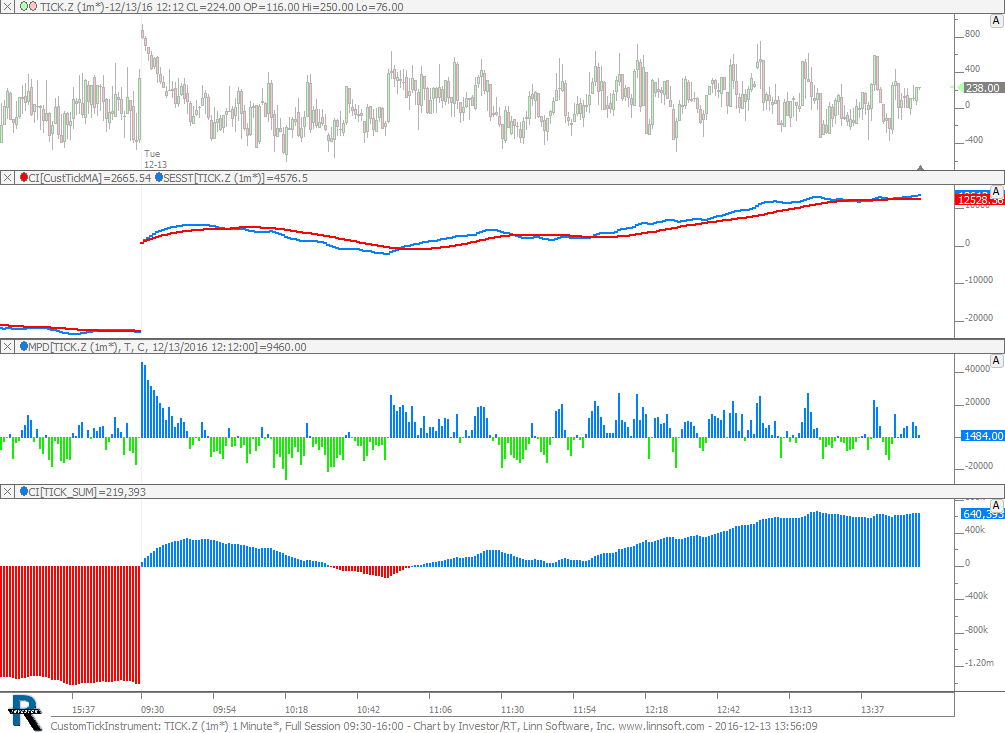
Custom Tick Instrument / Indicator. This chart was uploaded by Investor/RT 12.7.1 showing symbol: TICK.Z.
Custom Tick Instrument / Indicator. This chart was uploaded by Investor/RT 12.7.1 showing symbol: TICK.Z.
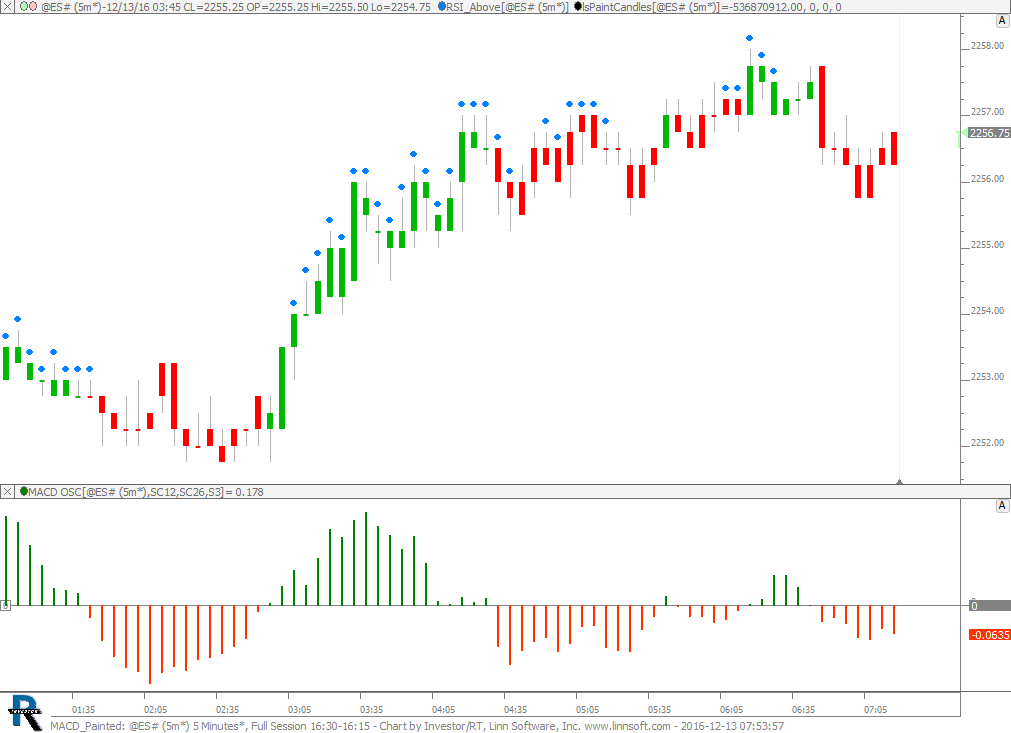
MACD Painted Bars. This chart was uploaded by Investor/RT 12.7.1 showing symbol: @ES#.
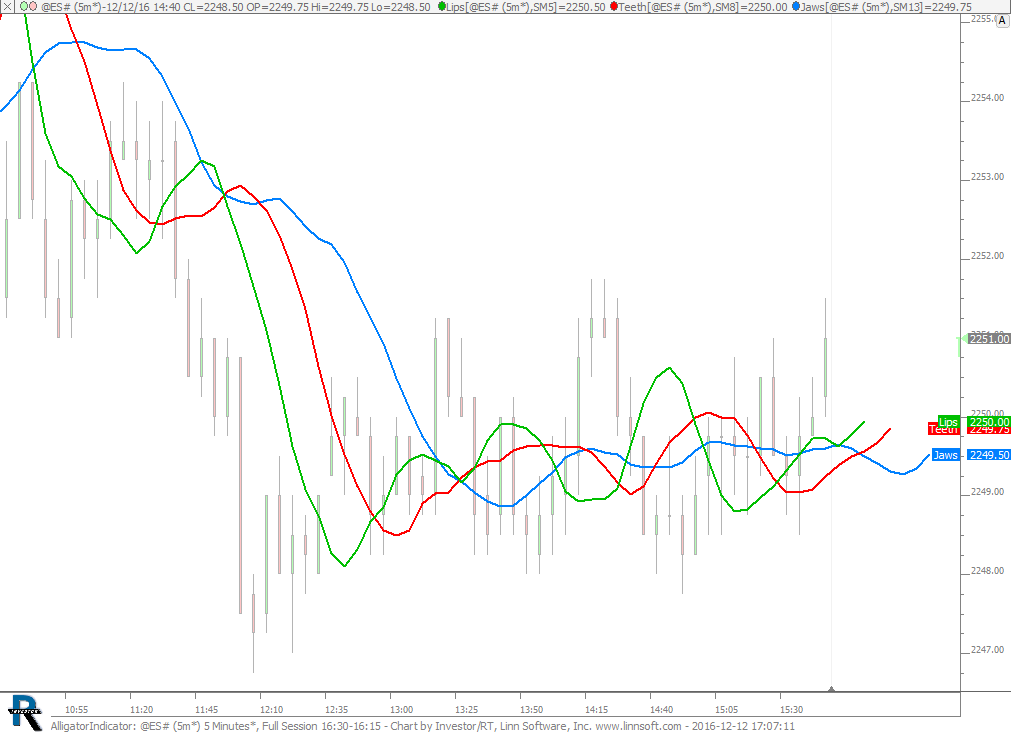
Alligator Indictor (Jaws, Teeth, Lips). This chart was uploaded by Investor/RT 12.7.1 showing symbol: @ES#.
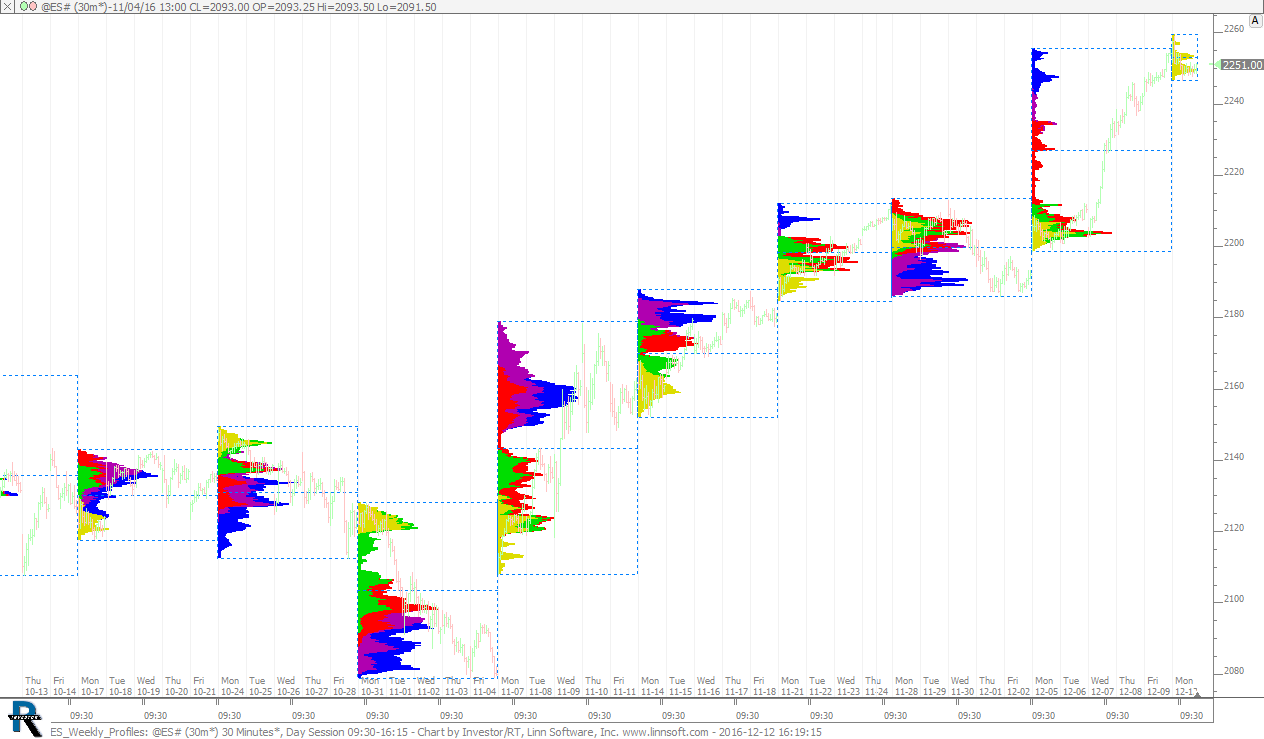
ES Weekly Profiles. This chart was uploaded by Investor/RT 12.7.1 showing symbol: @ES#.
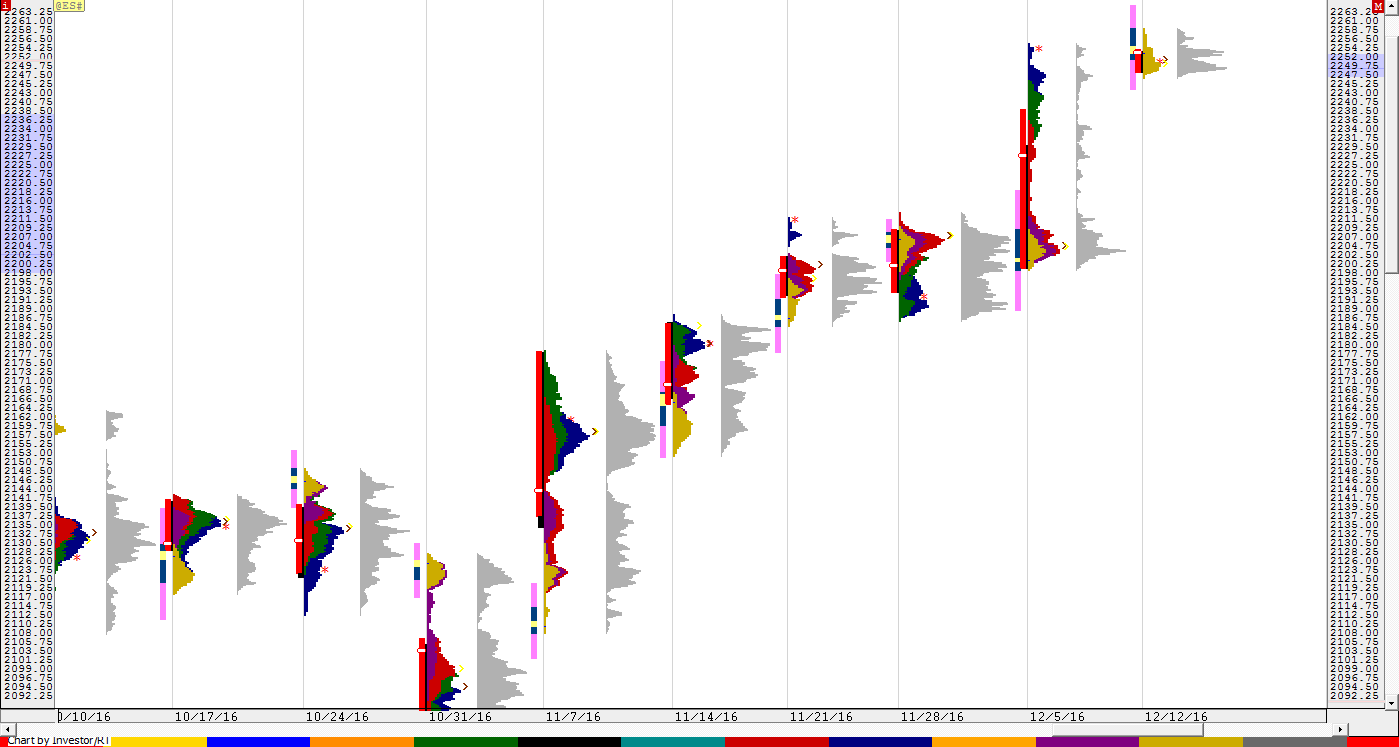
ES Weekly TPO Chart. This chart was uploaded by Investor/RT 12.7.1 showing symbol: @ES#.
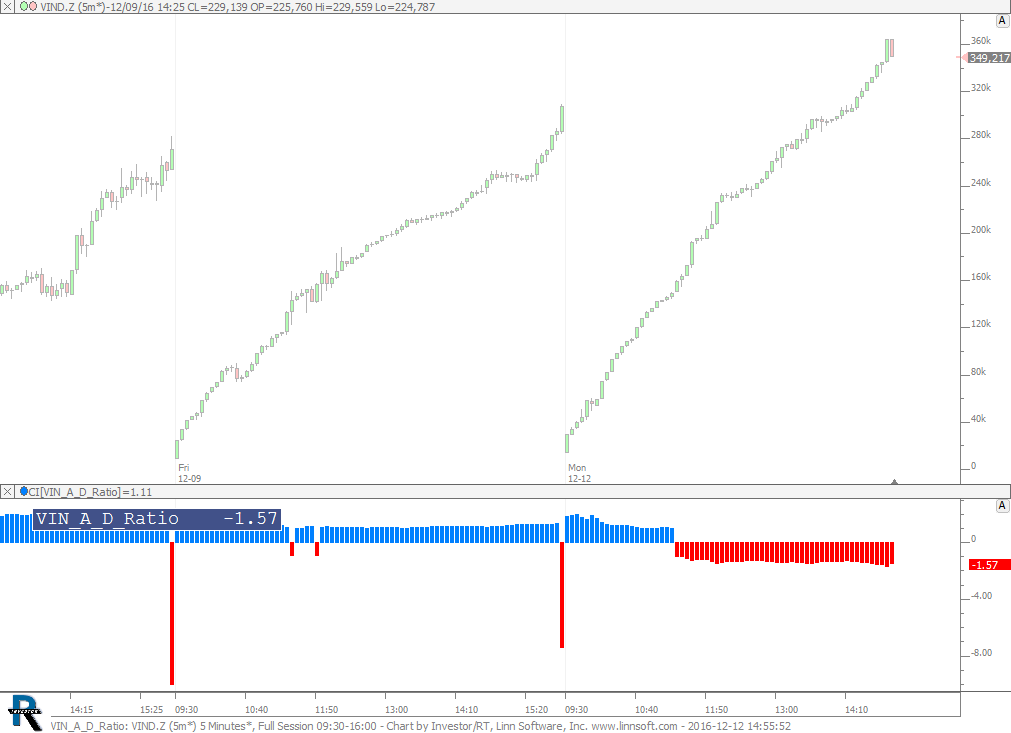
VIN A D Ratio. This chart was uploaded by Investor/RT 12.7.1 showing symbol: VIND.Z.
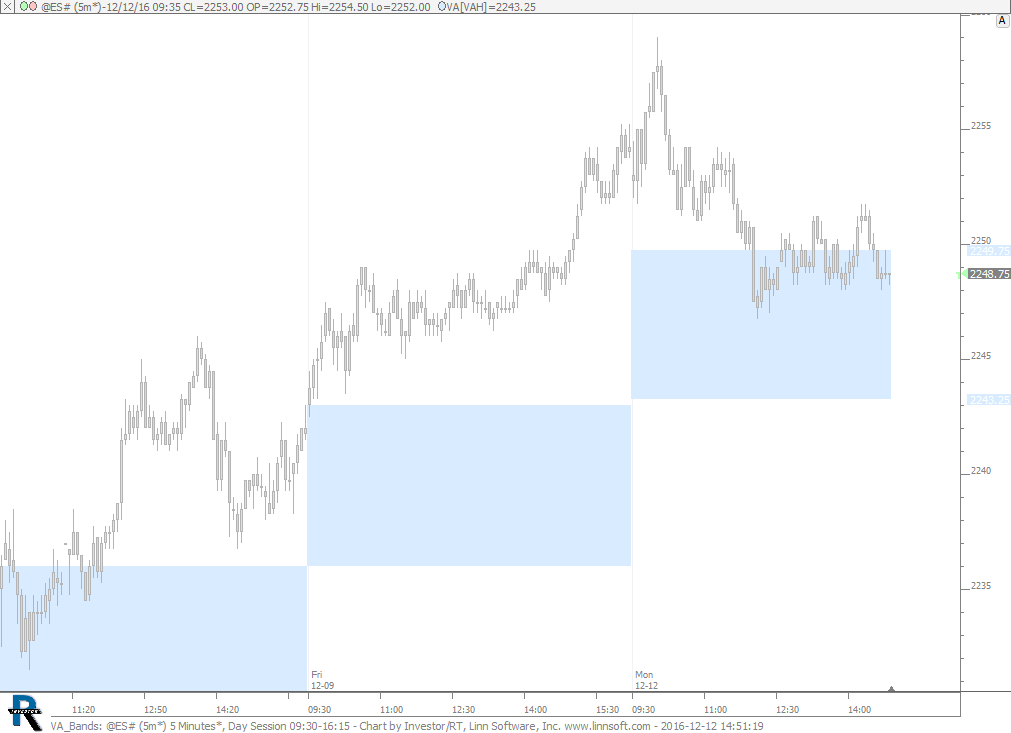
Previous Value Area Bands. This chart was uploaded by Investor/RT 12.7.1 showing symbol: @ES#.
This chart was uploaded by Investor/RT 12.7.1 showing symbol: @ES#.
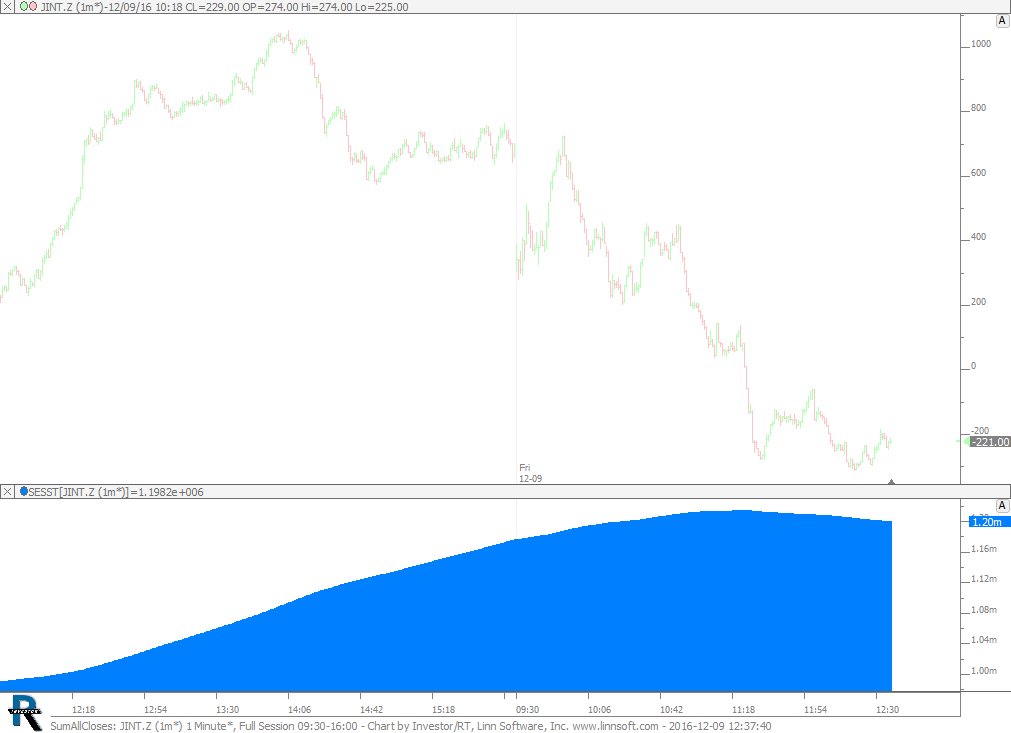
Sum all Closes - JINT.Z. This chart was uploaded by Investor/RT 12.7.1 showing symbol: JINT.Z.
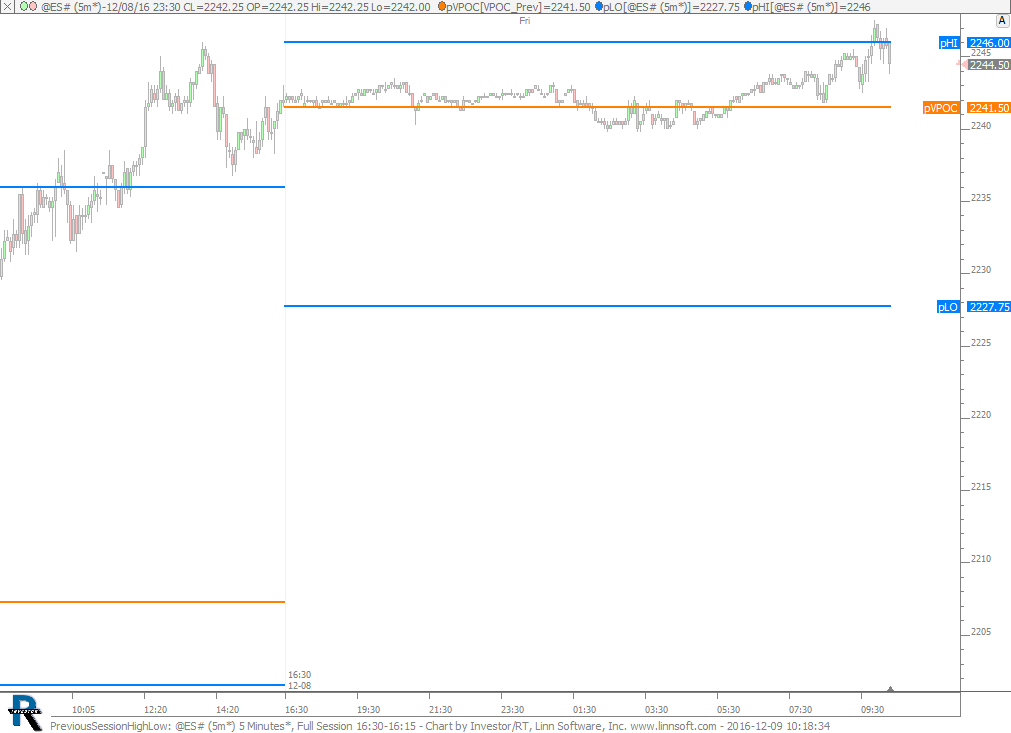
Previous Session High and Low and VPOC. This chart was uploaded by Investor/RT 12.7.1 showing symbol: @ES#.