BetterVolumePaintCandles (@ES#)
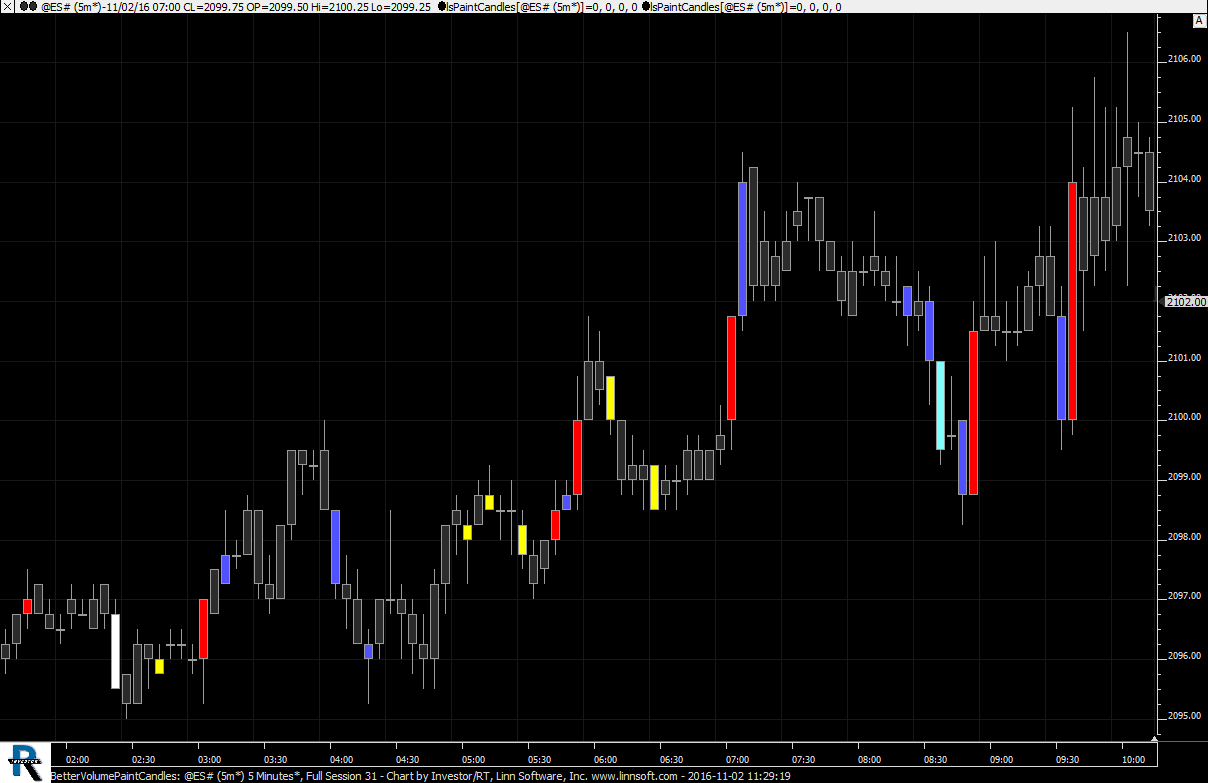
Better Volume with Paint Candles. This chart was uploaded by Investor/RT 12.6.7 showing symbol: @ES#.
Better Volume with Paint Candles. This chart was uploaded by Investor/RT 12.6.7 showing symbol: @ES#.
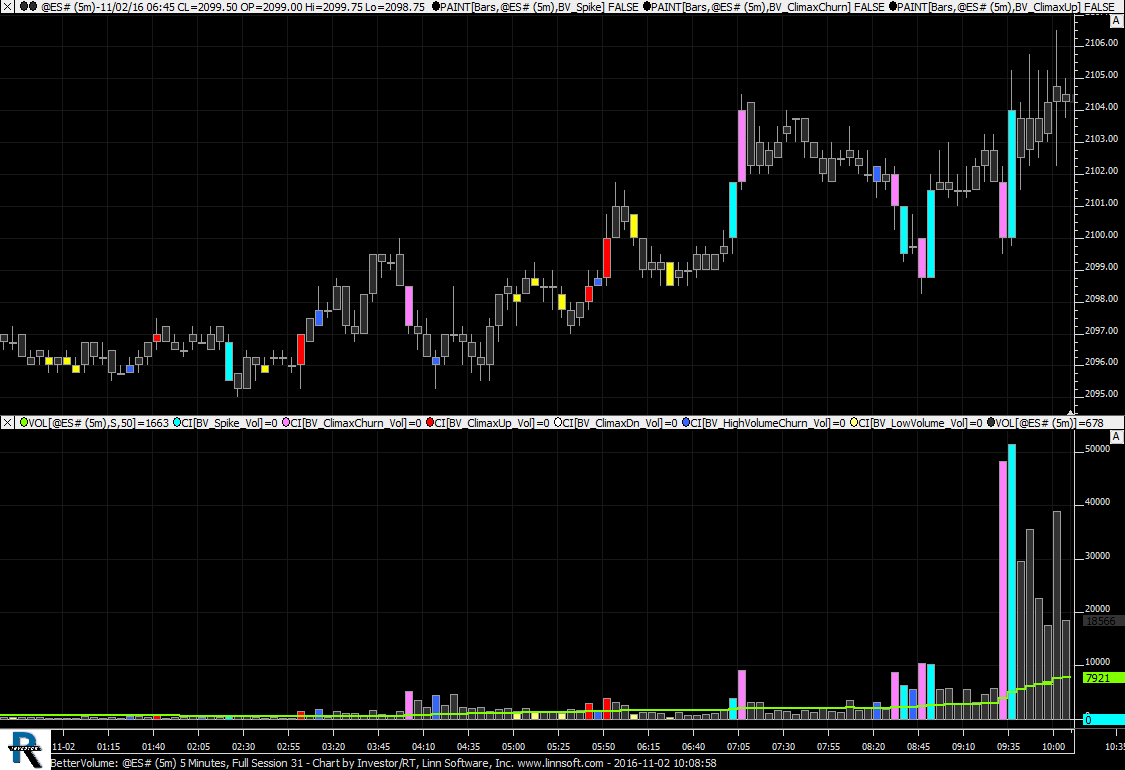
Better Volume. This chart was uploaded by Investor/RT 12.6.7 showing symbol: @ES#.
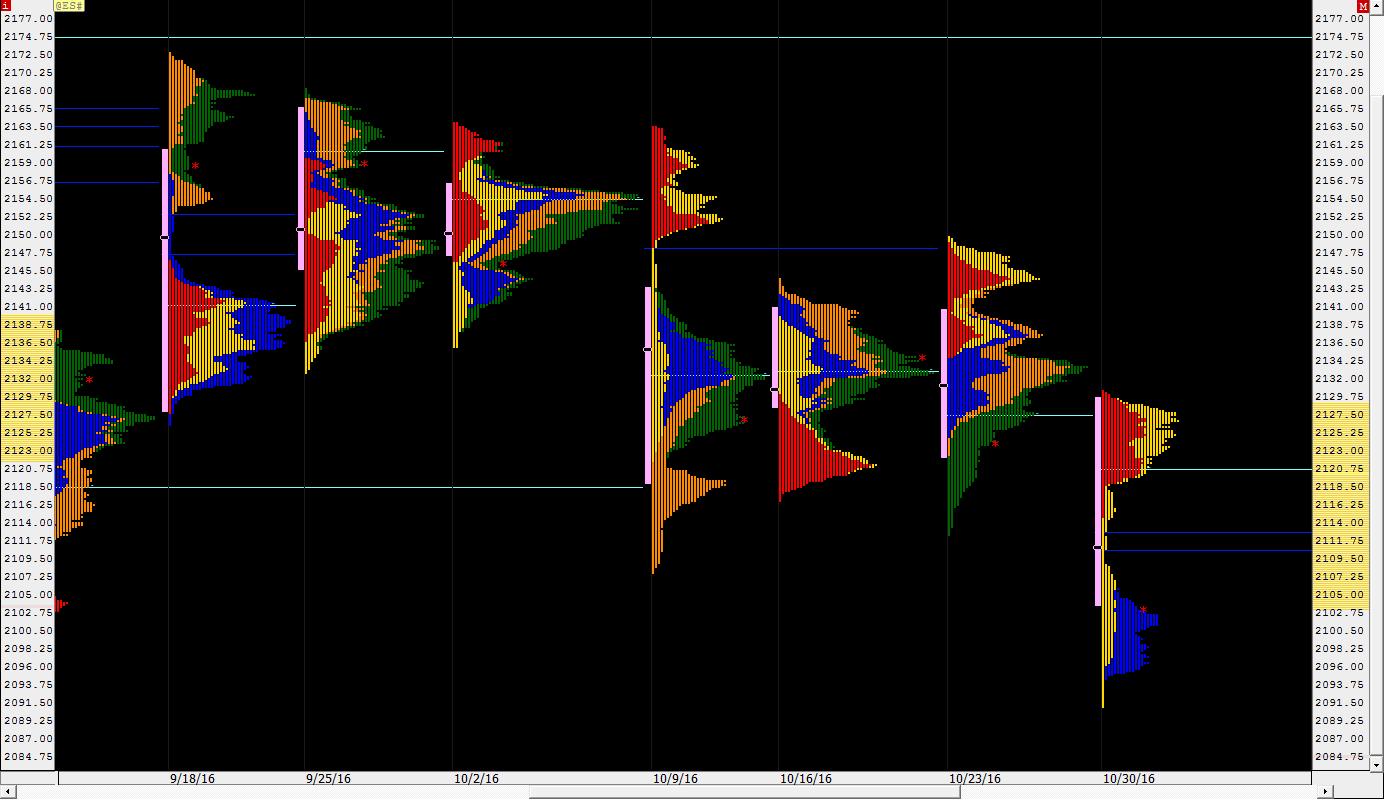
Weekly TPO Chart of ES. Each Day shaded different colors. This chart was uploaded by Investor/RT 12.6.7 showing symbol: @ES#.
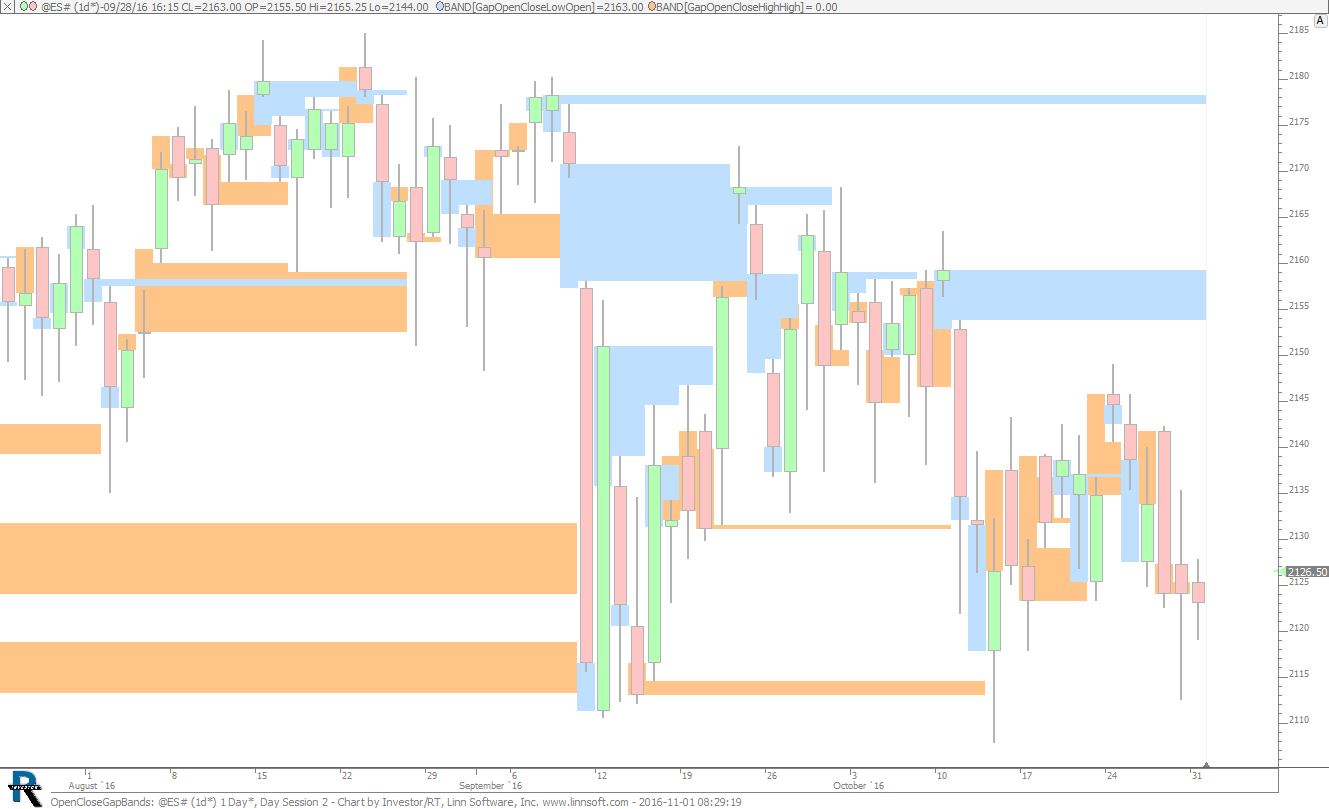
Gap Bands for gaps between previous close and open of day. This chart was uploaded by Investor/RT 12.6.7 showing symbol: @ES#.
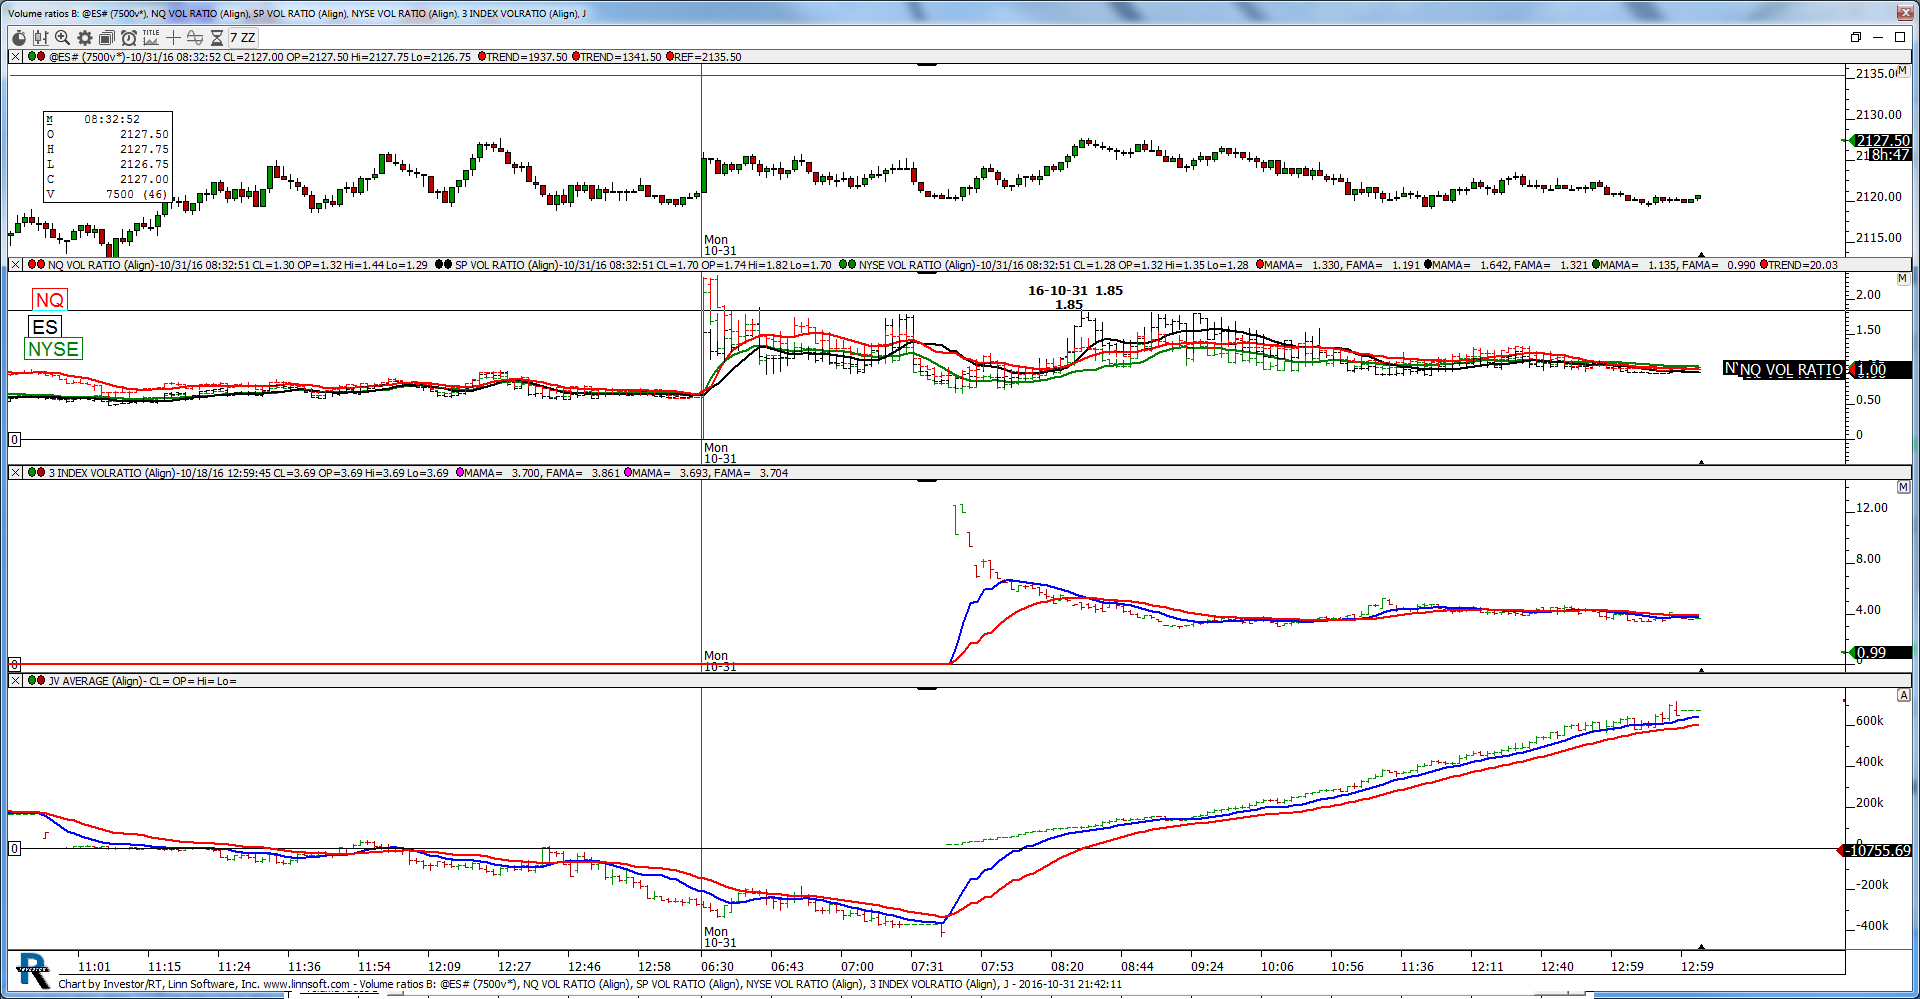
volume ratios after data importation. This chart was uploaded by Investor/RT 12.6.7 showing symbol: @ES#.

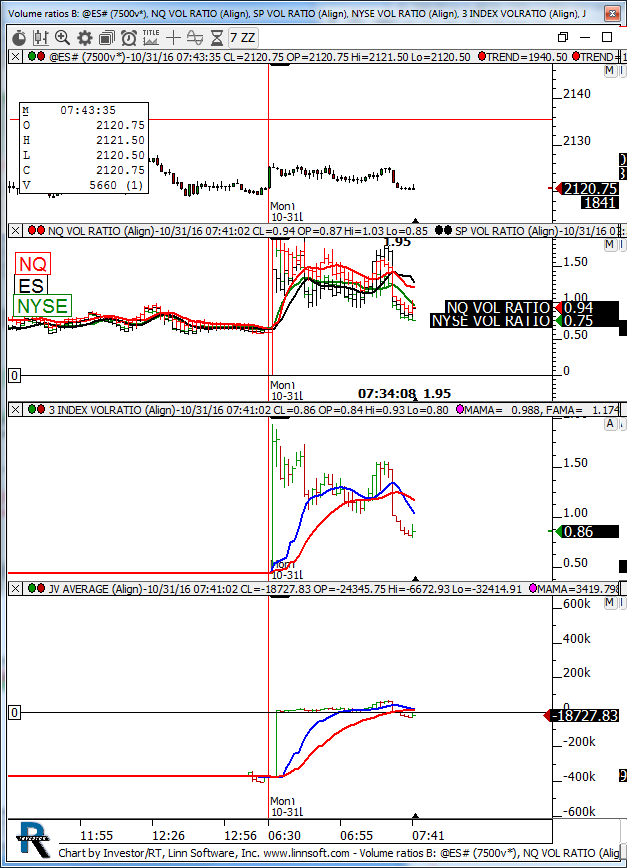
volume ratios. This chart was uploaded by Investor/RT 12.6.7 showing symbol: @ES#.
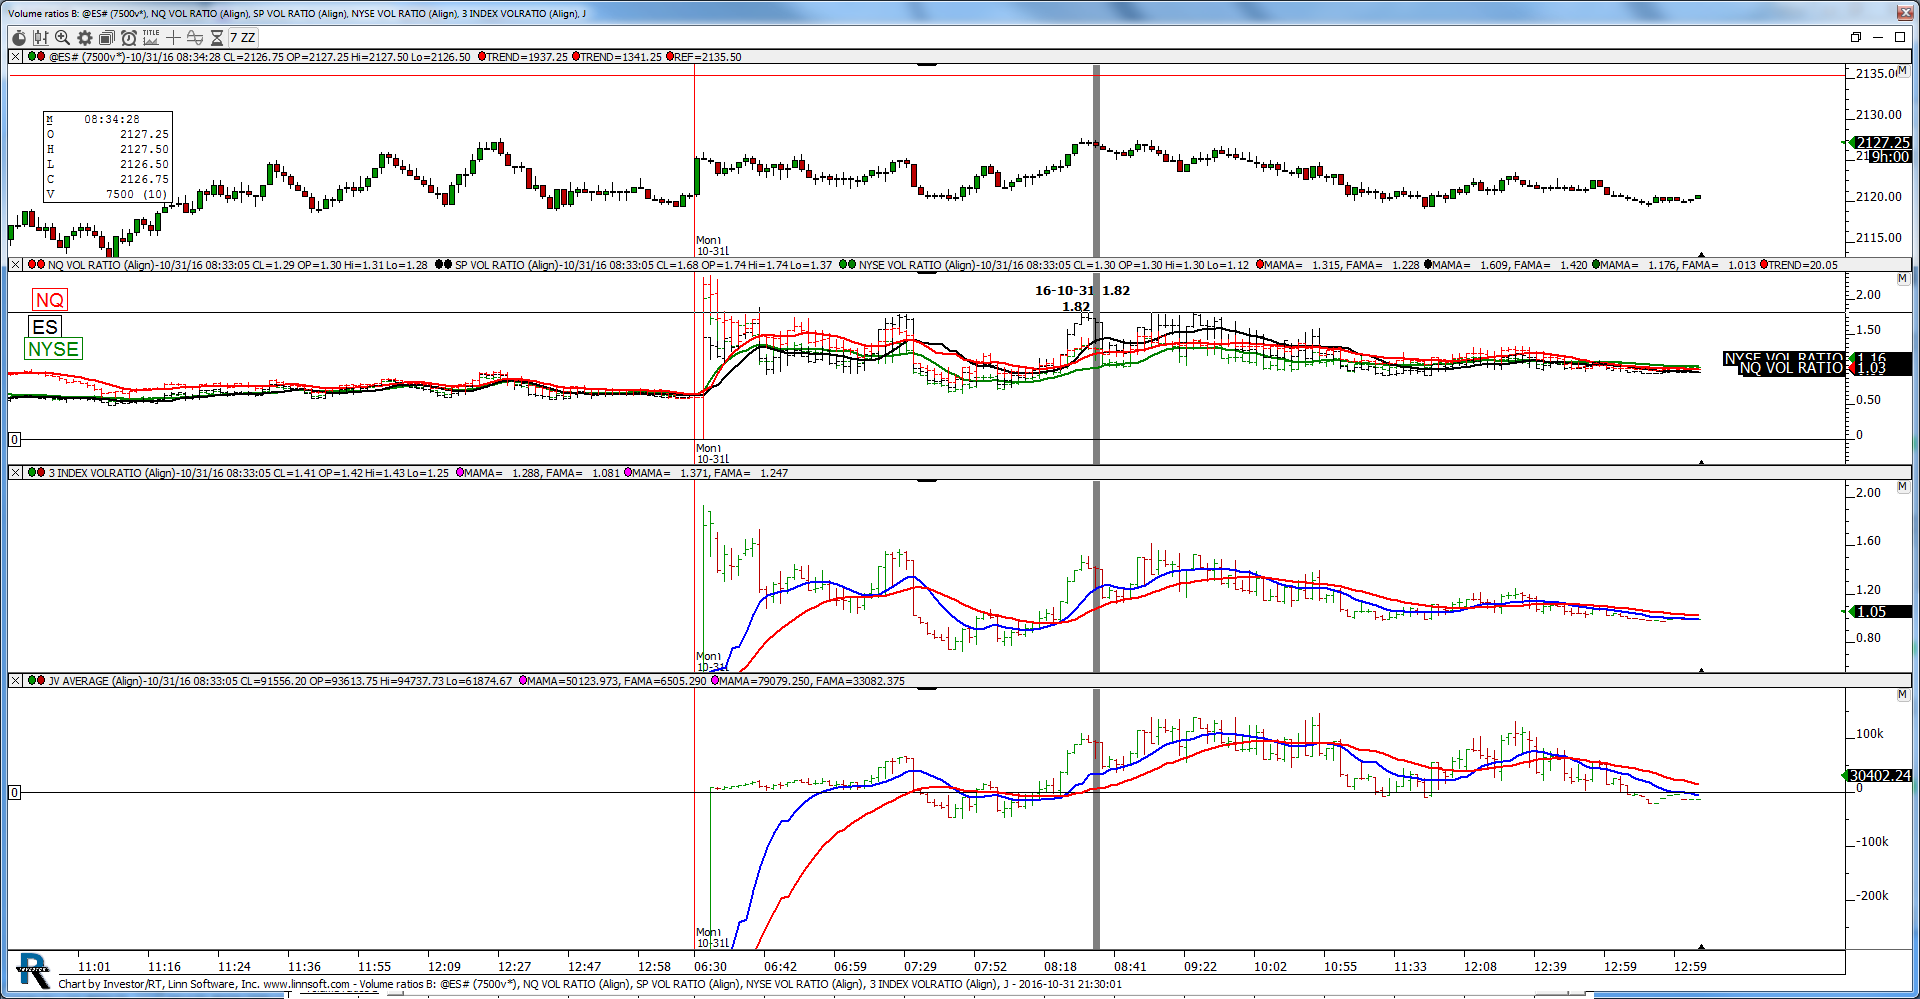
volume ratios. This chart was uploaded by Investor/RT 12.6.7 showing symbol: @ES#.
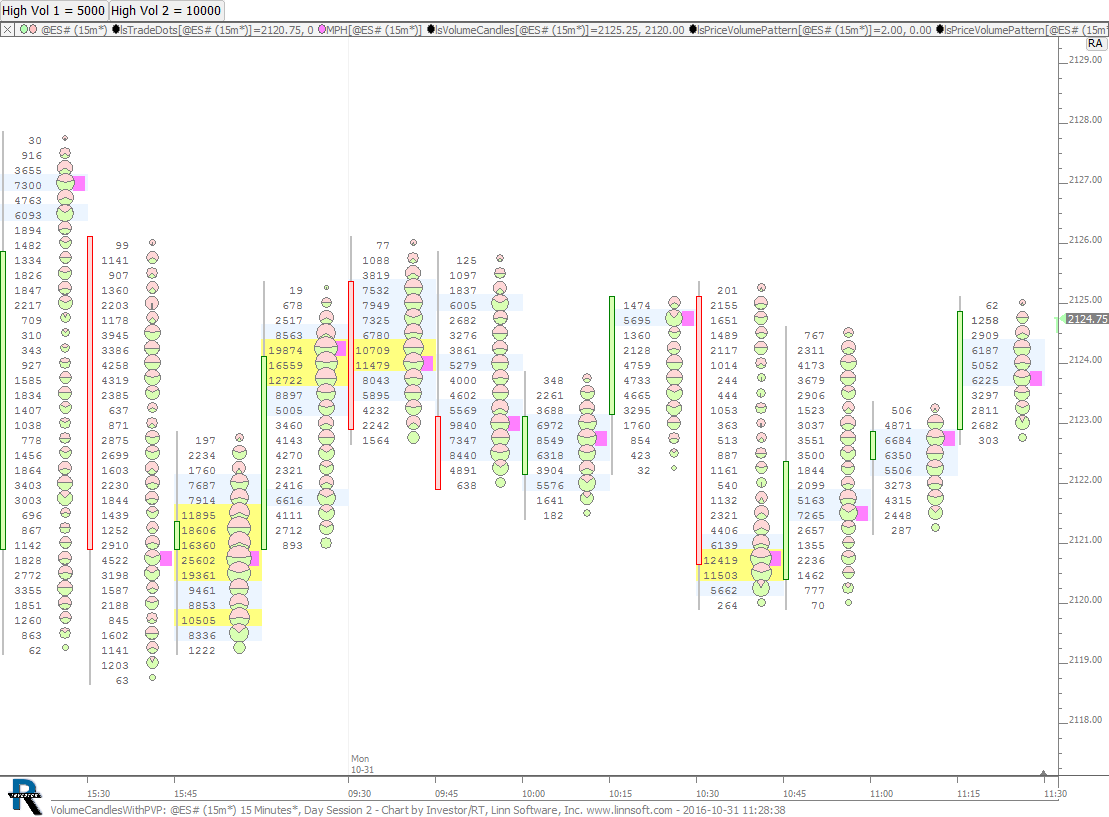
Volume Candles with Trade Dots, PVP, and MPH. Use the buttons at top to adjust the high volume at price filters (blue and yellow highlighting). This chart was uploaded by Investor/RT 12.6.7 showing symbol: @ES#.
volume ratios. This chart was uploaded by Investor/RT 12.6.7 showing symbol: @ES#.
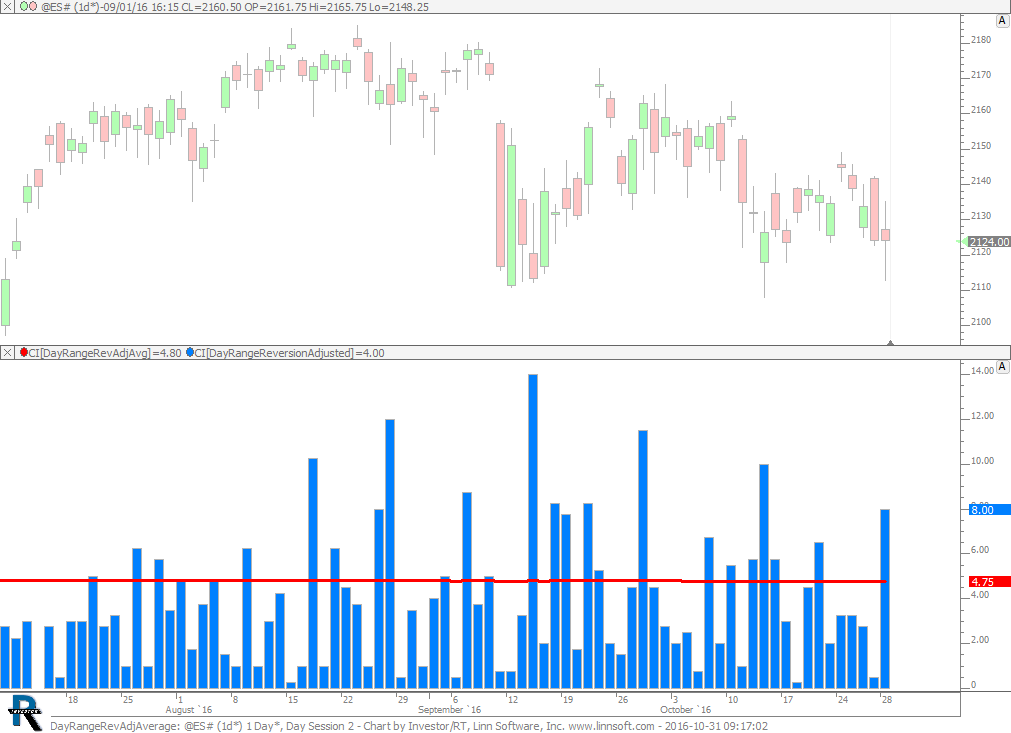
Day Range Average - Reversion Adjusted. This chart was uploaded by Investor/RT 12.6.7 showing symbol: @ES#.