Systems - Trade The Price Swings
The system detailed below is discussed in the article "Trade The Price Swings" by Barbara Star, Ph. D, in the December 2003 issue of Technical Analysis of Stocks and Commodities Magazine.
The system detailed below is discussed in the article "Trade The Price Swings" by Barbara Star, Ph. D, in the December 2003 issue of Technical Analysis of Stocks and Commodities Magazine.
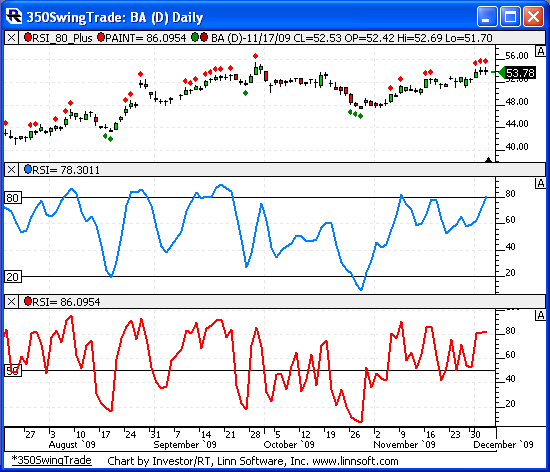
This chart shows the 3 period RSI in red in the lower pane, and the smoothed(3) 3-period RSI in blue in the middle pane. The upper pane uses a Paint Bar indicator to pain the candles green when the 3-period RSI is above it's 50 line and red when it's below it's 50 line. The upper pane also has signal markers showing when the smoothed RSI is above 80 (red diamonds above high) or below 20 (green diamonds below low).