ten point

Ten Point Profile

Ten Point Profile

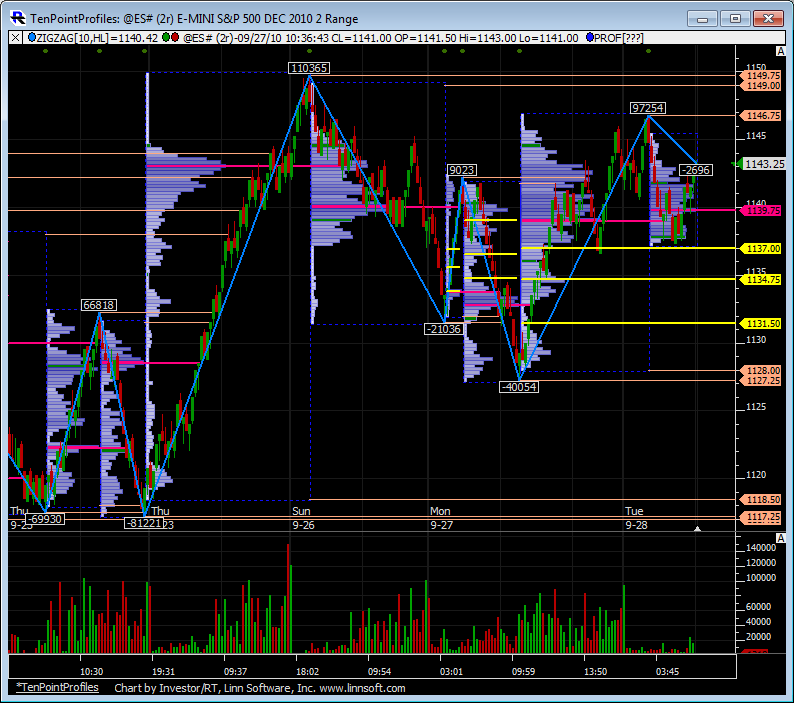
This video demonstrates how to use the Zig Zag Indicator to identify ten point moves and label them with the delta of each move. It also shows how to use the Profile Indicator to plot volume profiles of each of these moves and extend the naked VPOC, High, and Low of those profiles.

Ten Point Profile

This 2 Rangebar chart of ES includes the Zig Zag Indicator identifying 10 point moves and labeling the delta of each move. The Profile Indicator gives the volume profile of each move and extends the naked VPOC, High, and Low of each profile until it is taken out by a future price. This chart is explained in more detail in the video Ten Point Profile. The video also explains how to create the chart from scratch. This chart requires the Investor/RT TPO Profile Package.