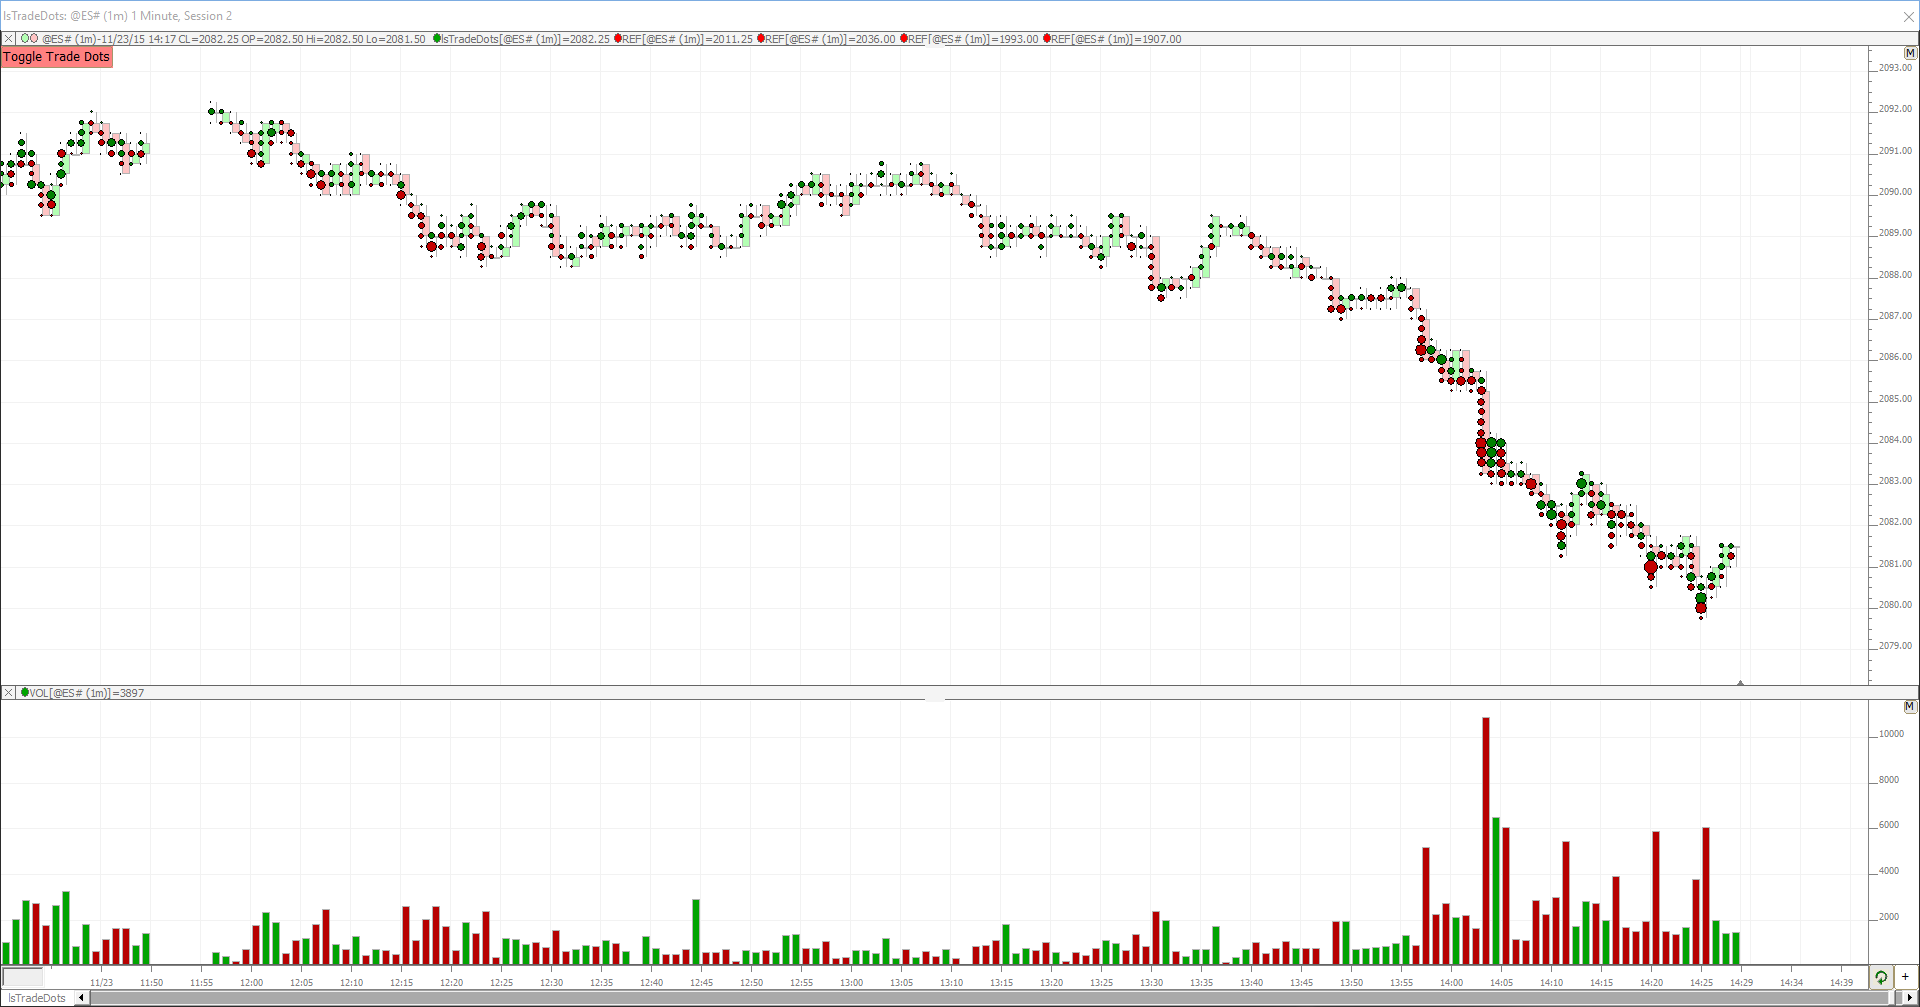

Hello,
I would like to configure my chart to display trade markers (dots) along the bottom axis, similar to the reference image provided. Could you please provide professional guidance or a step-by-step walkthrough on how to recreate this specific visualization within my platform?
Trade Dots Chart (RTX)
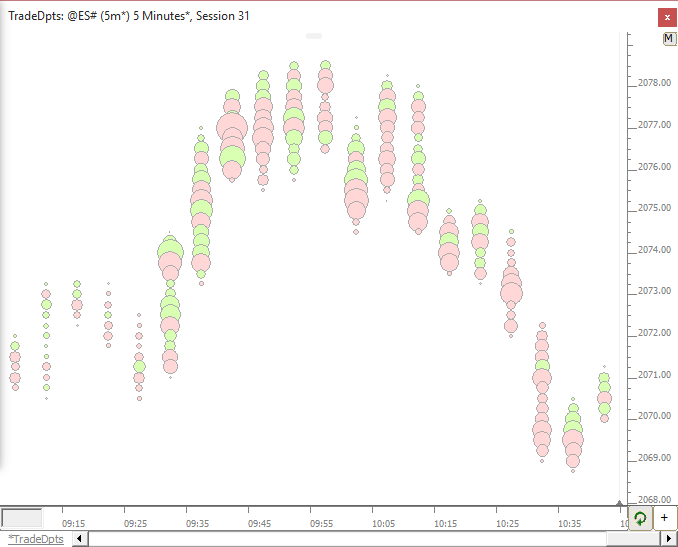
Trade Dots draws Dots at each price sized relative to the volume at that price.