TSYSI

21 posts / 0 new
Last post
Mickster
Last seen: 4 years 3 months ago
Joined: 06/29/2018 - 17:47
Backtesting & TSYSI Questions

I have a strategy in development and have some questions about what I am seeing when applying the TSYSI to a 5 min chart of the ES.

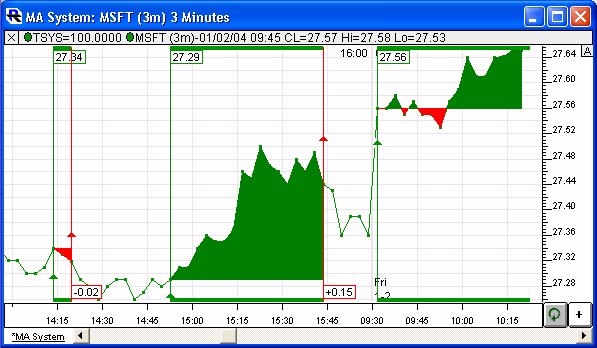
The attached chart shows 4 trades. The first two trades occurred back to back (trade 2 entry happens on same bar as trade 1 exit). The trade box encompasses both trades instead of separating into two boxes. Is this normal behavior based on the fact that entry and exit are on same bar?

In trade 1, the stop and target lines are not drawn at the correct levels. Why is this?

Trading System Indicator (TSYSI)

The Trading System Indicator (TSYS) charts the actions of a Trading System built using the Investor/RT Trading System Tools. The TSYS can operate on bars of any periodicity, both historically (backtesting) and going forward. TSYS clearly marks all position changes, whether it be an entry, an exit, a reversal or an addition or reduction of an existing position. Stepped lines are optionally drawn on every bar in every trade, to show the entry price, stop/trailing stop price, target price, and more. An optional trade box can be wrapped around every trade. Since Trading Systems can use multiple signals/rules to manage the behavior of the system over time, this indicator is much more powerful than a single Signal Marker or combination of Signal Markers. The Trading System allows each signal/rule to have knowledge of the current condition of other signals, as well as the current characteristics of the overall system.

Systems - Trade The Price Swings

The system detailed below is discussed in the article "Trade The Price Swings" by Barbara Star, Ph. D, in the December 2003 issue of Technical Analysis of Stocks and Commodities Magazine.

Pages