The chart below shows the Volume Breakdown setup with common settings for cumulative delta bars.
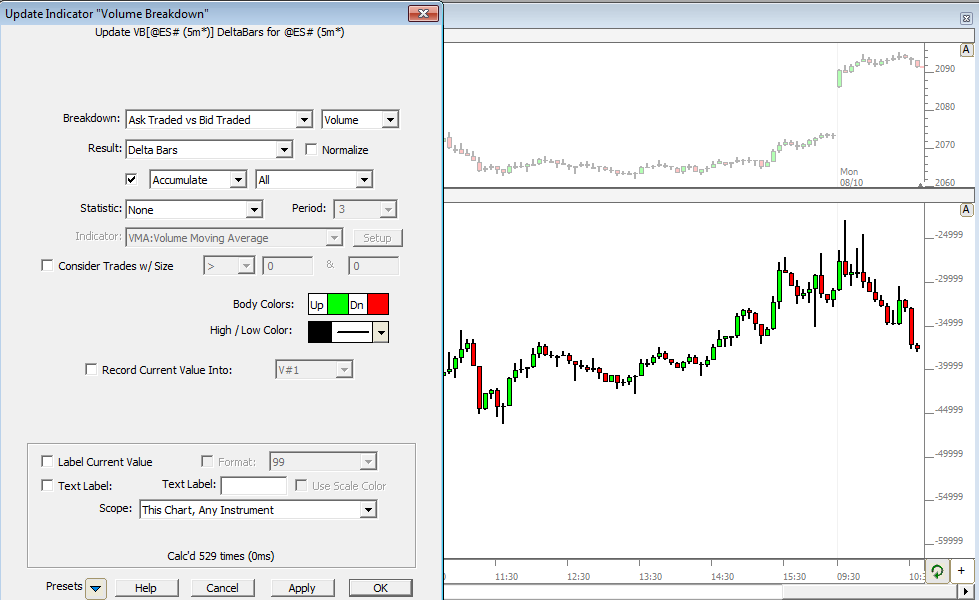
Often users would like to access the high, low, close, or open prices of the delta bars in RTL for creation of signals or custom indicators.
The chart below demonstrates how to setup VB in order to access the high of the delta bars. Notice everything is setup identically to the chart above, except the Statistics is set to "Indicator" and the indicator is set to MA is set to a "1 Period High". To get the low, open, or close (or any other price for that matter), simply select the proper price from the price list within the Moving Average indicator.
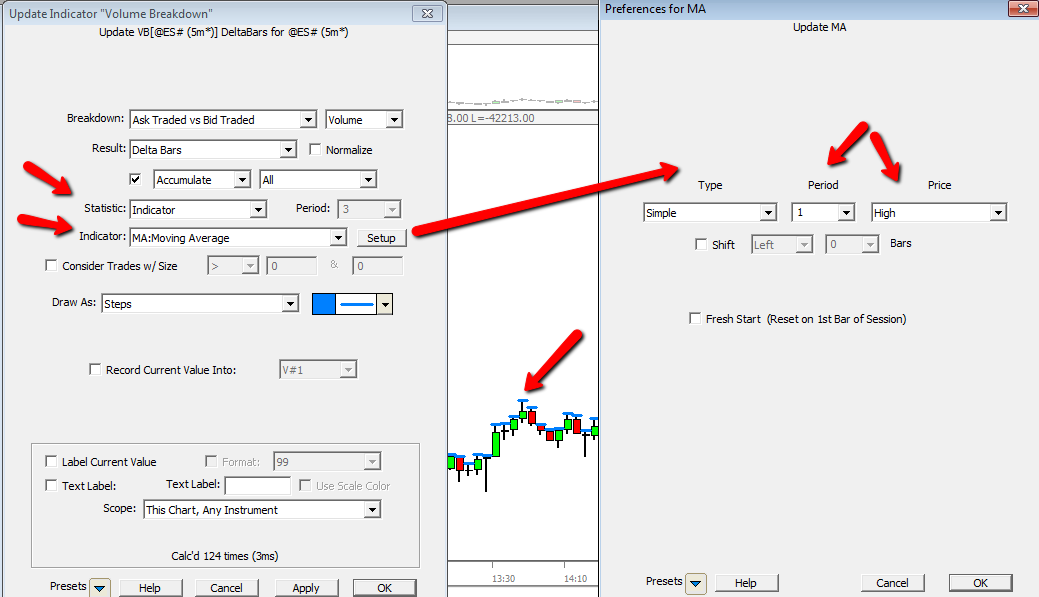
To create a signal for a higher high of delta bars, the syntax might be as follows...
VB_HI > VB_HI.1
where VB_HI was setup as you see above. To look for inside bars...
VB_HI <= VB_HI.1 AND VB_LO >= VB_LO.1
where VB_LO would be setup identically to VB_HI except the low price would be chosen within the MA preferences.
For more complex signals, there is an easier approach. Users could create a signal....
HI <= HI.1 AND LO <= LO.1
or even a more complex signal involving Statistics or Session Statistics, looking for new highs possibly...
POS > 1 AND HI > SESST.1
and save that signal. Then create another signal with syntax.
VB = 1
and simply setup VB as follows...
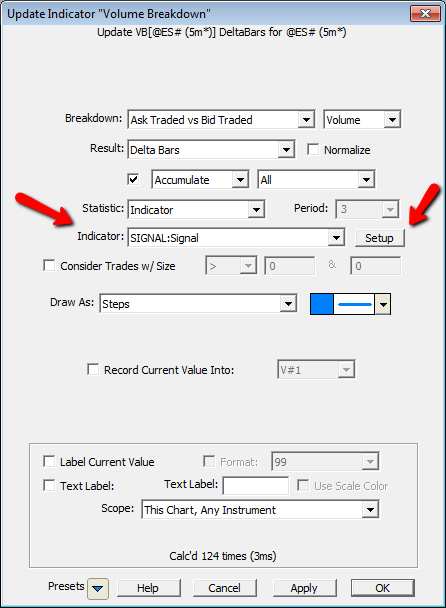
Click the Setup button next and choose the proper Signal from the list. This will cause VB to return TRUE (1) or FALSE (0) based on whether the underlying signal was true or false for each given delta bar.
Note: When sending your VB based signal to a chart, it will by default add it to the instrument/bar pane. Simply drag and drop it into the VB pane. Once you've dropped it, if it doesn't show up, you'll need to edit the element order and send it to the back of the element order for that pane (behind the VB delta bars).
