Creating a "Value Area" Hollow candle
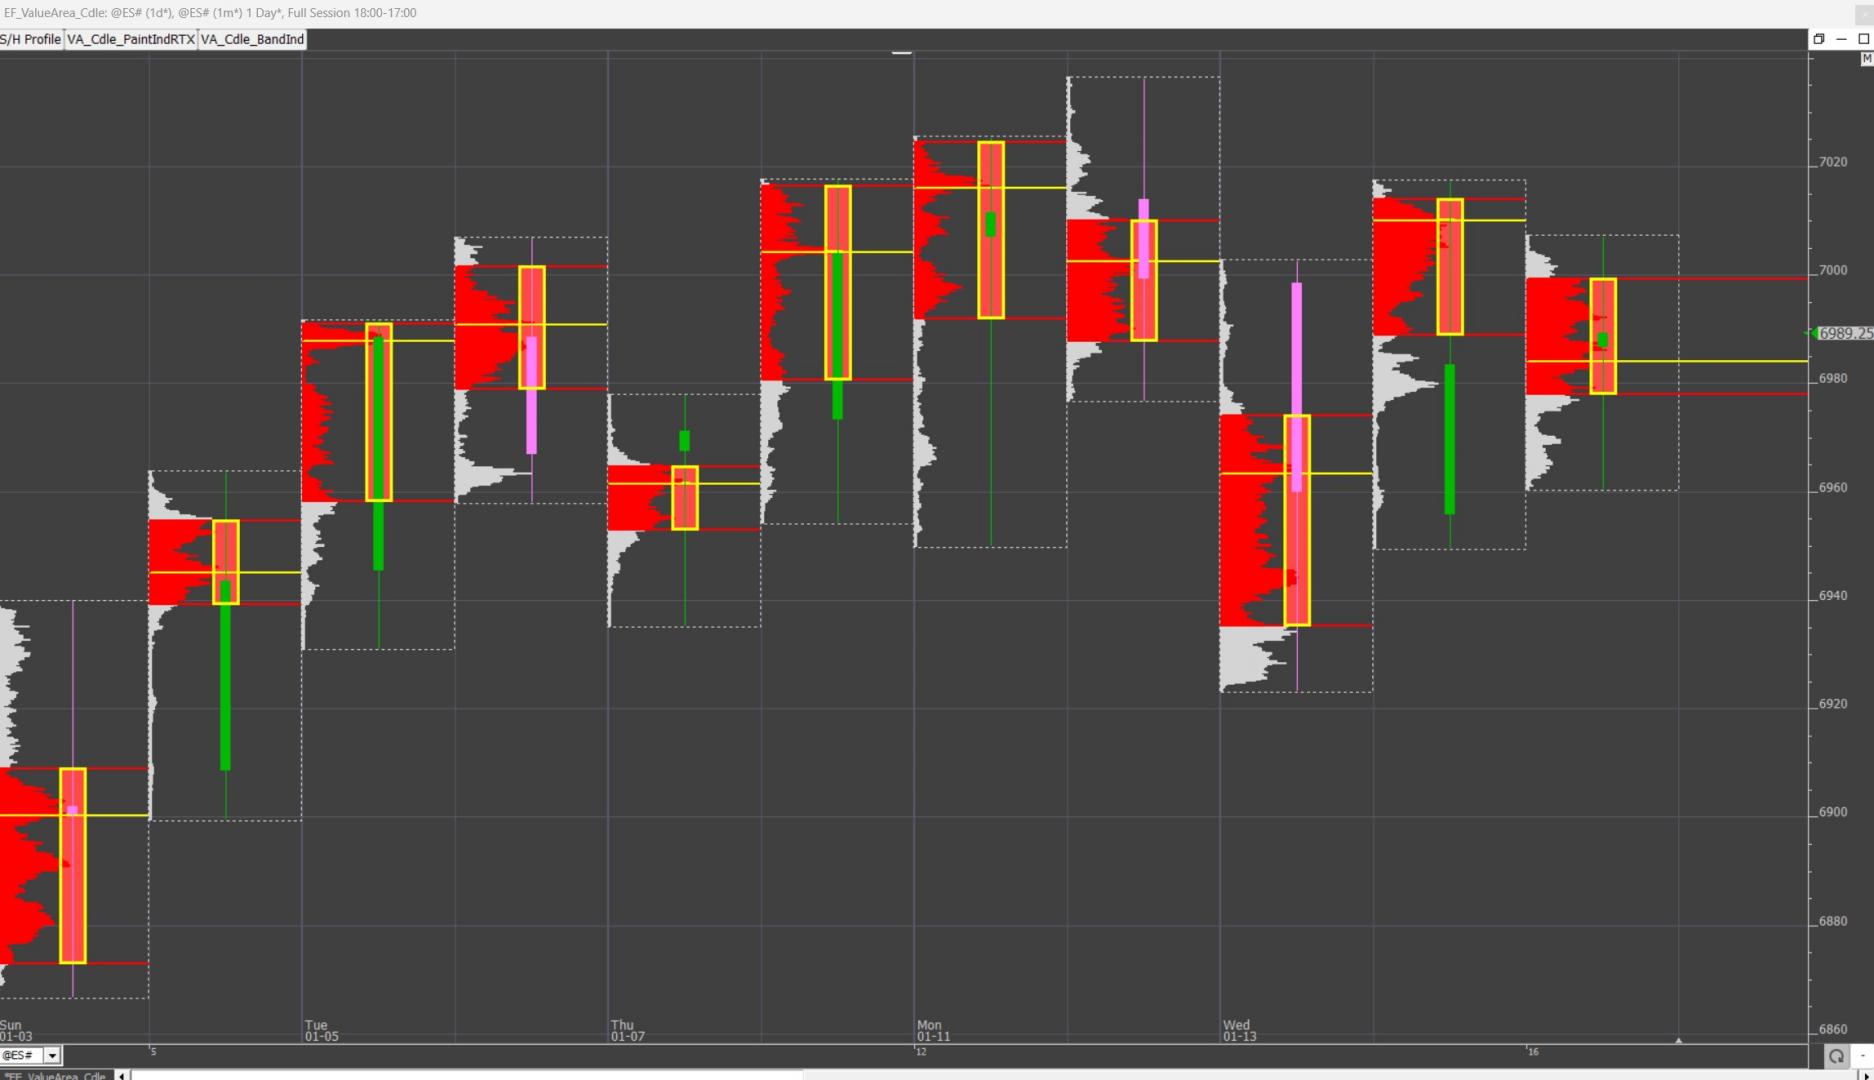
This tip explains how to Create a "Value Area" Hollow candle with the paint Indicator
This tip explains how to Create a "Value Area" Hollow candle with the paint Indicator
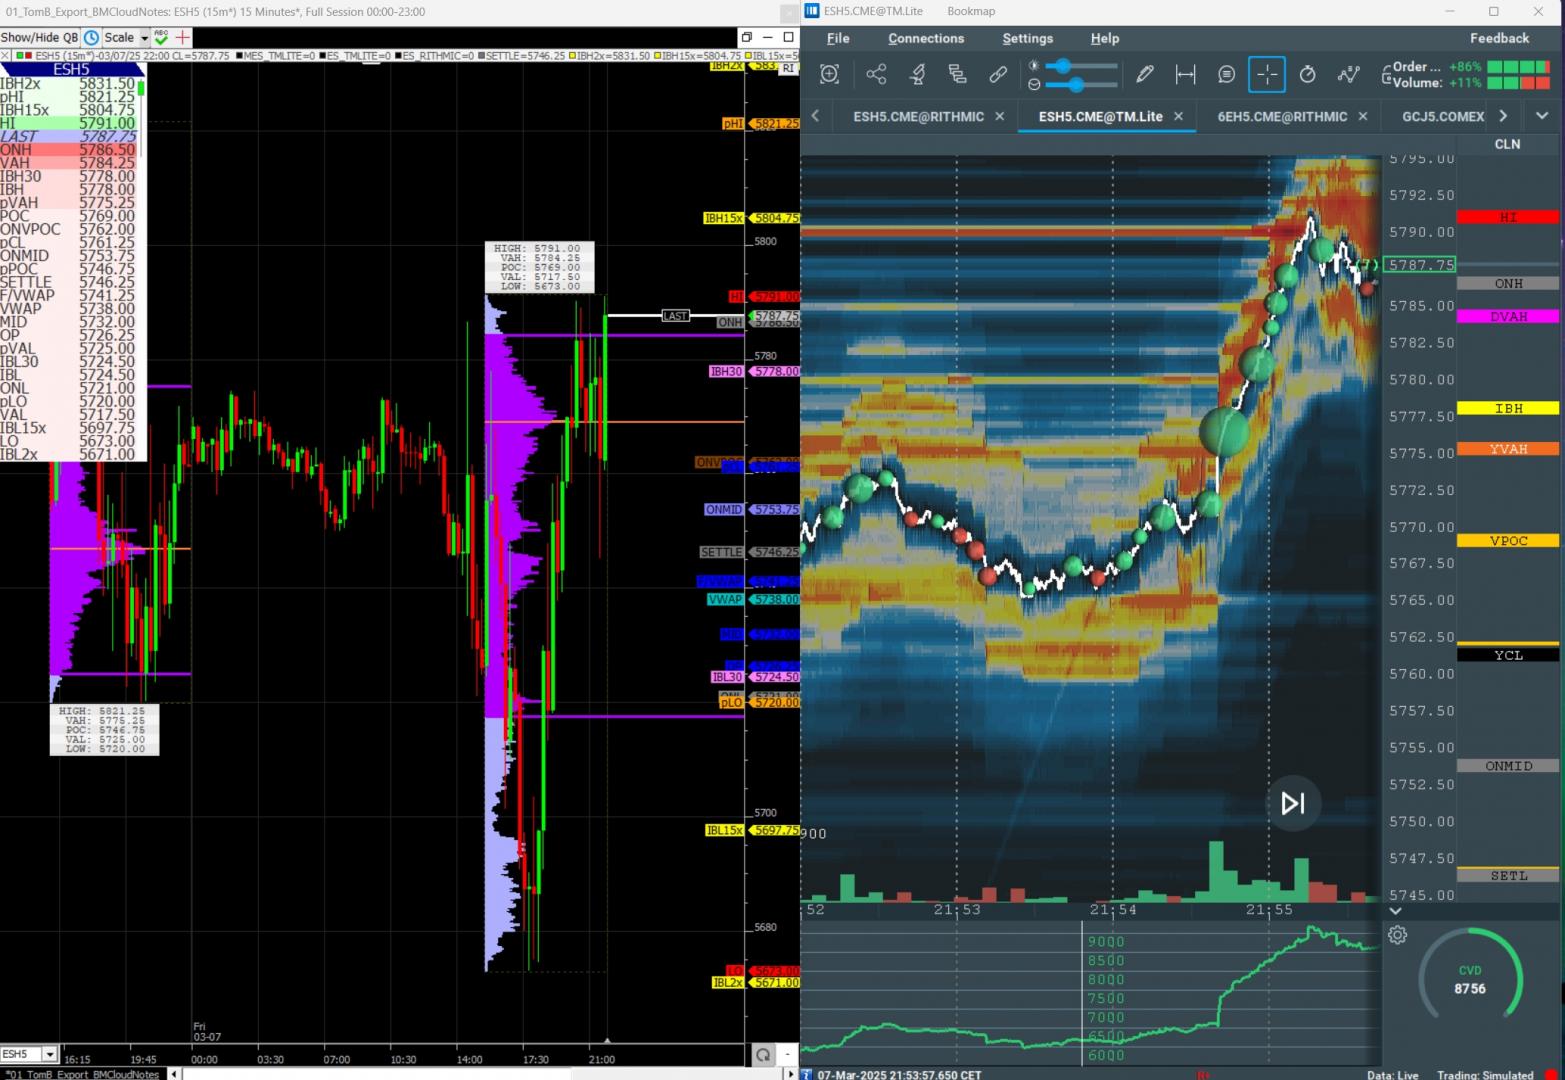
This tip explains how to create the Bookmap Cloud Notes used by Tom B in his Trader's Lab discord chatroom
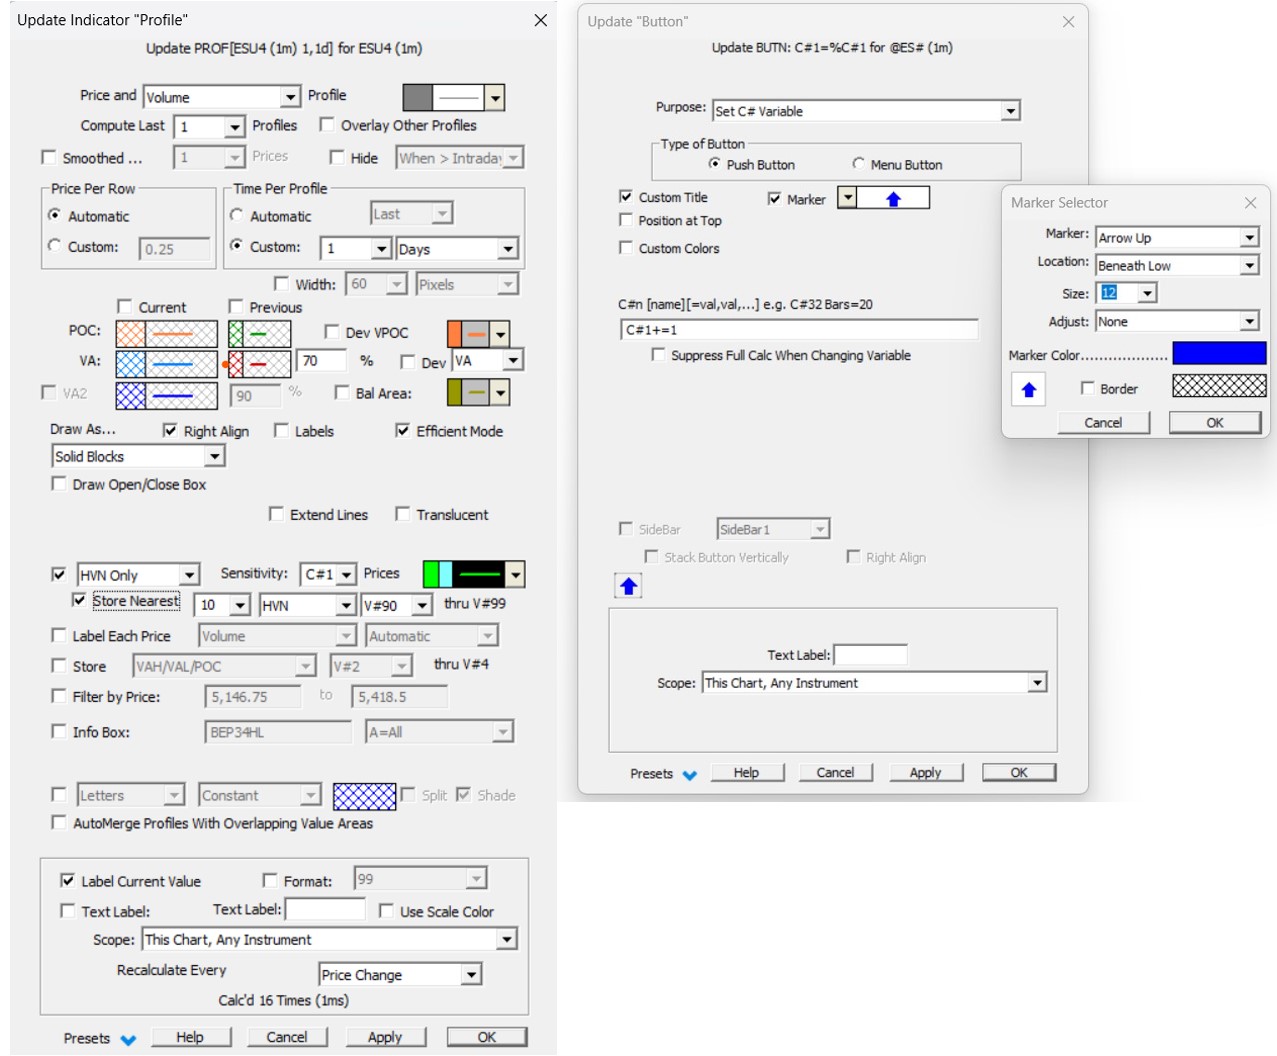
This tip explains how to adjust the sensitivity of High Volumes Nodes with the latest chart buttons
This video provides several tips and shortcuts that make creating Investor/RT charts quick and easy. Version 12.5 is used for this video.
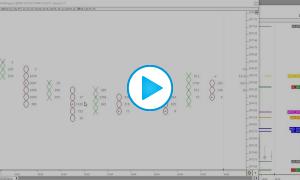
This video explains how point and figure bars are formed and why volume is often missing at the high or low prices of PNF bars (ghost or phantom prices). It also explains how to set a configuration variable, PnfConventionalHighLows, to FALSE, to avoid this situation.

This tip explains how to customize the column titles in the resulting Excel file when exporing all chart data from a multi-pane chart by right-cilcking in chart and "Export: All Chart Data".
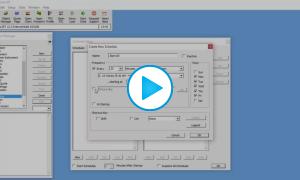
In this video tip, Chad Payne explains how to setup Investor/RT to play an audible alert every 30 minutes throughout the regular trading session using the Schedule module.

How to paint or shade background of the overnight period (or day session) a diferent color.

How to access the overnight volume point of control (ON VPOC) on a day session chart.

