I am stuck on RTL and I do not understand why I cannot get this to calculate correctly.
Question:
How often did we close below IBL 4.0?
Syntax tried:
V#31 <= (SESST_IBL - 3.00 * (SESST_IBH - SESST_IBL))
Problem- Calculates multiple closes on a 60 min chart.
Syntax tried:
Sesst_Close (Last price ---> Close ---> 1min --->last---> daysession) <= (SESST_IBL - 3.00 * (SESST_IBH - SESST_IBL))
Problem populates signals on every close
What am I missing here. What is the best way to go about getting the close price to calculate correctly?
BEGIN Investor/RT TRADING SIGNAL DEFINITION for BACK_TEST_CL_BELOW_IB4
COMMENT=NONE
SOURCE=Joshua Dawson
PLATFORM=Windows 10 x64 (6.2, Build 9200)
DATE=2020-06-20 10:03
VERSION=14.1c12 (Build #33441 Jun 12 2020 16:37:38)
DATAFEED=Rithmic
NAME=BACK_TEST_CL_BELOW_IB4
BARCOUNT=AUTOMATIC
ELEM=SESST_IBL:Session Statistics Indicator:SESST[ ] Lowest PREFS: 255,0,0,2,2,0,0,128,0,1,0,0,1,4,60,1,12701270,0,1,4,1,F,F,1020,11,20,F,F,3539980800,3540326400,2,0,60,F,3,F,F,F,1020,405,F,
ELEM=SESST_IBH:Session Statistics Indicator:SESST[ ] Highest PREFS: 255,0,0,2,2,0,0,128,0,1,0,0,0,3,60,1,12701270,0,1,4,1,F,F,1020,11,20,F,F,3539980800,3540326400,2,0,60,F,3,F,F,F,1020,405,F,
ELEM=CLOSE:Close
SIGNAL=CLOSE <= (SESST_IBL - 3.00 * (SESST_IBH - SESST_IBL))
END Investor/RT TRADING SIGNAL DEFINITION for BACK_TEST_CL_BELOW_IB4
BEGIN Investor/RT CUSTOM INDICATOR DEFINITION for IBL4_00
COMMENT=NONE
SOURCE=Joshua Dawson
PLATFORM=Windows 10 x64 (6.2, Build 9200)
DATE=2020-06-20 10:03
VERSION=14.1c12 (Build #33441 Jun 12 2020 16:37:38)
DATAFEED=Rithmic
NAME=IBL4_00
BARCOUNT=AUTOMATIC
ELEM=SESST_IBL:Session Statistics Indicator:SESST[ ] Lowest PREFS: 0,128,255,2,2,0,0,128,0,1,0,0,1,4,60,1,12701270,0,1,4,1,F,T,1020,11,50,F,F,3539980800,3540326400,2,0,60,F,3,F,F,F,1020,405,F,
ELEM=SESST_IBH:Session Statistics Indicator:SESST[ ] Highest PREFS: 0,128,255,2,2,0,0,128,0,1,0,0,0,3,60,1,12701270,0,1,4,1,F,T,1020,11,50,F,F,3539980800,3540326400,2,0,60,F,3,F,F,F,1020,405,F,
INDICATOR=SESST_IBL - 3.00 * (SESST_IBH - SESST_IBL)
END Investor/RT CUSTOM INDICATOR DEFINITION for IBL4_00
BEGIN Investor/RT CHART DEFINITION for TEST_IB4
--
--To Import This Definition:
--1. Select all the text in this file.
--2. COPY to clipboard (Ctrl+C)
--3. Go to Investor/RT and PASTE (Ctrl+V)
--To learn more about importing definitions see www.linnsoft.com/importing.
--
COMMENT=NONE
SOURCE=Joshua Dawson
PLATFORM=Windows 10 x64 (6.2, Build 9200)
DATE=2020-06-20 10:03
TIMEZONE=Eastern Daylight Time (UTC - 5:00) DST
VERSION=14.1c12 (Build #33441 Jun 12 2020 16:37:38)
DATAFEED=Rithmic + DTNMA ORS=0 Trading Simulator
NAME=TEST_IB4 SIZE=571,1065
PERIODICITY=3,60,0 (60 Minutes)
PIXELS=2:0
LOOKAHEAD=0
RMARGIN=257
CFLAGS=786432 CFLAGS2=154113
VIEWPERIOD=0,1,120,2164551300,3675428100 (08/03/72 16:15 to present)
SUBSESSION=0,30,6
COLORS=12632256,0,5329233,16053492,2434341,11382189,16777215,0,0
DESC=TEST_IB4: ESU0 (60m) 60 Minutes, Day Session 09:30-16:15
SESSION OVERRIDE=2 Index Futures: Hours: 09:30 to 16:15
TICKER=ESU0:GLOBEX:7 SECTYPE=3 DISPLAY=12 ALIAS=@ES#
-Tick Data: 120 Days, Intraday: All Data, Daily: 6000 Days
PANE #1 PCT=0.043478 PFLAGS=912 SCALE=1,2600.000000,3250.000000,0.250000,1.000000,0.000000,0,0
INDICATOR: BUTN #94 ASSOC: ESU0:GLOBEX:2 ID#1 PERIODICITY: 3,60,0 DESC: BUTN: Session Menu LABEL: T TXTLBL: F,"",F RECALC: 0,0 PREFS: 2,1,0,0,14011401,0^1^31,3553552,\0,0,16711680,\0,2,0,1,30,0,16746632,117440512,0,0,50331903,117440512,Pivot,10,2,
INDICATOR: BUTN #94 ASSOC: ESU0:GLOBEX:2 ID#1 PERIODICITY: 3,60,0 DESC: BUTN: Set View Period 3 mo LABEL: T TXTLBL: F,"",F RECALC: 0,0 PREFS: 25,0,0,0,14011401,3 mo,3553552,\0,0,16711680,\0,2,0,1,30,0,16746632,117440512,0,0,50331903,117440512,Pivot,10,2,
INDICATOR: BUTN #94 ASSOC: ESU0:GLOBEX:2 ID#1 PERIODICITY: 3,60,0 DESC: BUTN: Set View Period 6 mo LABEL: T TXTLBL: F,"",F RECALC: 0,0 PREFS: 25,0,0,0,14011401,6 mo,3553552,\0,0,16711680,\0,2,0,1,30,0,16746632,117440512,0,0,50331903,117440512,Pivot,10,2,
INDICATOR: BUTN #94 ASSOC: ESU0:GLOBEX:2 ID#1 PERIODICITY: 3,60,0 DESC: BUTN: Set View Period 1 yr LABEL: T TXTLBL: F,"",F RECALC: 0,0 PREFS: 25,0,0,0,14011401,1 yr,3553552,\0,0,16711680,\0,2,0,1,30,0,16746632,117440512,0,0,50331903,117440512,Pivot,10,2,
INDICATOR: BUTN #94 ASSOC: ESU0:GLOBEX:2 ID#1 PERIODICITY: 3,60,0 DESC: BUTN: Set View Period 2 yr LABEL: T TXTLBL: F,"",F RECALC: 0,0 PREFS: 25,0,0,0,14011401,2 yr,3553552,\0,0,16711680,\0,2,0,1,30,0,16746632,117440512,0,0,50331903,117440512,Pivot,10,2,
INDICATOR: BUTN #94 ASSOC: ESU0:GLOBEX:2 ID#1 PERIODICITY: 3,60,0 DESC: BUTN: Set View Period 5 yr LABEL: T TXTLBL: F,"",F RECALC: 0,0 PREFS: 25,0,0,0,14011401,5 yr,3553552,\0,0,16711680,\0,2,0,1,30,0,16746632,117440512,0,0,50331903,117440512,Pivot,10,2,
INDICATOR: BUTN #94 ASSOC: ESU0:GLOBEX:2 ID#1 PERIODICITY: 3,60,0 DESC: BUTN: Set View Period from Menu LABEL: T TXTLBL: F,"",F RECALC: 0,0 PREFS: 25,1,0,0,14011401,1/1/2016^50 days^1 month^3 months^6 months^1 year^2 years^3 years^5 years,3553552,\0,0,16711680,\0,2,0,1,30,0,16746632,117440512,0,0,50331903,117440512,Pivot,10,2,
INDICATOR: BUTN #94 ASSOC: ESU0:GLOBEX:2 ID#1 PERIODICITY: 3,60,0 DESC: BUTN: Maximize Chart LABEL: T TXTLBL: F,"",F RECALC: 0,0 PREFS: 26,0,0,0,14011401,Maximize,3553552,\0,0,16711680,\0,2,0,1,30,0,16746632,117440512,0,0,50331903,117440512,Pivot,10,2,
INDICATOR: BUTN #94 ASSOC: ESU0:GLOBEX:2 ID#1 PERIODICITY: 3,60,0 DESC: BUTN: Minimize Chart LABEL: T TXTLBL: F,"",F RECALC: 0,0 PREFS: 26,0,0,0,14011401,Minimize,3553552,\0,0,16711680,\0,2,0,1,30,0,16746632,117440512,0,0,50331903,117440512,Pivot,10,2,
INDICATOR: BUTN #94 ASSOC: ESU0:GLOBEX:2 ID#1 PERIODICITY: 3,60,0 DESC: BUTN: Restore Chart LABEL: T TXTLBL: F,"",F RECALC: 0,0 PREFS: 26,0,0,0,14011401,Restore,3553552,\0,0,16711680,\0,2,0,1,30,0,16746632,117440512,0,0,50331903,117440512,Pivot,10,2,
PRESET: RLINE 3170.00,#6 DESC: REF[ESU0 (60m) 0] 3170.00 LABEL: T TXTLBL: F,"AUTO",F RECALC: 3,3 PREFS: 0,128,255,2,2,0,2,4294944000,3170,T,F,F,F,F,2,15,0,\0,0,F,512,,55033632,3316.72656,1.72333,T,F,100BarPctChg,0,1242240,3675369600,F,F,F,0,0,0,0,-0,0,0,0,-2147483648,163,163,163,2,2,0,F,F,1,14011401,12,F,F,0,0,255,1,2,0,33488896,33619712,283816,4.000000,8.000000,12.000000,F,F,2,2,F,F,F,F,50,0,1,0,F,60,0,0,T,F,0,0,30,
INDICATOR: BUTN #94 ASSOC: ESU0:GLOBEX:2 ID#1 PERIODICITY: 3,60,0 DESC: BUTN: RLINE 3170.00 LABEL: T TXTLBL: F,"",F RECALC: 0,0 PREFS: 21,0,1032,0,14011401,\0,6,RLINE 3170.00,2,16711680,\0,2,1,1,30,0,16746632,117440512,0,0,50331903,117440512,Pivot,10,2,
PRESET: PROF_50 ,#127 DESC: PROF[ESU0 (60m) 0,1q] LABEL: T TXTLBL: F,"AUTO",F RECALC: 3,3 PREFS: 128,128,128,1,2,0,0.25,225165264,100,204,0,0,2,2,0,0,255,0,2,2,0,255,255,255,2,2,0,255,0,255,2,2,0,98,7,14011401,F,T,T,F,5,T,T,F,F,1,5,T,F,3652790400,3653028000,8,3,0,0,T,F,500,T,F,F,F,10,0,0,255,2,2,0,0,2,1,0,1,T,F,0,255,0,2,2,0,255,0,0,2,469791792,0,F,F,0,128,255,3,2,0,9,0,F,T,255,16777215,0,0,F,F,50331903,2,0,9934592,65,255,5000,0,0,0,0,3,2,0,0,1,0,1,F,F,F,T,0,0,255,2,2,0,95,T,F,2824,2893.5,F,F,BEP34HL,0,-1,
INDICATOR: BUTN #94 ASSOC: ESU0:GLOBEX:2 ID#1 PERIODICITY: 3,60,0 DESC: BUTN: PROF_50 LABEL: T TXTLBL: F,"AUTO",F RECALC: 0,0 PREFS: 4,0,1024,0,14011401,\0,127,PROF_50 ,5,16711680,\0,2,0,1,30,0,16746632,117440512,0,0,50331903,117440512,Pivot,10,2,
PRESET: PROF_51 ,#127 DESC: PROF[ESU0 (60m) 0,1y] LABEL: T TXTLBL: F,"AUTO",F RECALC: 3,3 PREFS: 128,128,128,1,2,0,0.25,225165264,10,204,0,0,2,2,0,204,0,0,2,2,0,255,255,255,2,2,0,255,128,192,2,2,0,68,7,14011401,F,T,T,T,5,T,T,F,F,1,6,T,F,3652790400,3653028000,8,3,0,0,T,F,500,T,F,F,F,10,0,0,255,2,2,0,0,3,1,0,1,T,F,0,255,0,2,2,0,255,0,0,2,469791792,0,F,F,0,128,255,3,2,0,9,0,F,T,255,16777215,0,0,F,F,50331903,2,0,9934592,65,255,5000,0,0,0,0,3,2,0,0,1,0,1,F,F,F,T,0,0,255,2,2,0,95,T,F,2824,2893.5,F,F,BEP34HL,0,-1,
INDICATOR: BUTN #94 ASSOC: ESU0:GLOBEX:2 ID#1 PERIODICITY: 3,60,0 DESC: BUTN: PROF_51 LABEL: T TXTLBL: F,"AUTO",F RECALC: 0,0 PREFS: 4,0,1024,0,14011401,\0,127,PROF_51 ,5,16711680,\0,2,0,1,30,0,16746632,117440512,0,0,50331903,117440512,Pivot,10,2,
PANE #2 PCT=0.957609 PFLAGS=34448 SCALE=16,2691.983501,3413.754271,0.250000,1.000000,0.000000,0,0
INDICATOR: SIG #10 ASSOC: ESU0:GLOBEX:2 ID#1 PERIODICITY: 3,60,0 DESC: SIGNAL[ESU0 (60m) 2] BACK_TEST_CL_BELOW_IB4,0 LABEL: T TXTLBL: F,"AUTO",F RECALC: 0,0 PREFS: 0,128,255,1,0,0,BACK_TEST_CL_BELOW_IB4,0,11,0,F,159416448,524288,8,\0,F,0,0,0,0,0,F,0,F,F,F,F,0,0,0,0,0,0,0,0,0,0,0,0,F,F,0,0,0,0,0,0,0,0,0,0,0,F,\0,F,F,F,2,12781278,3,F,0,F,IBL4_00,1,0,1,0,0,2,
INDICATOR: CI #40 ASSOC: ESU0:GLOBEX:2 ID#1 PERIODICITY: 3,60,0 DESC: CI:IBL4_00[ESU0 (60m) 0] SESST_IBL - 3.00 * (SESST_IBH - SESST_IBL) LABEL: T TXTLBL: F,"",F RECALC: 0,0 PREFS: 0,51,255,2,2,0,IBL4_00,0,0,3,F,15693672,3,255,0,0,0,0,0,1,70,F,0,F,50,F,F,13001300,1,0,2,0,F,F,0,0,255,1,2,0,33488896,33619712,21672,4.000000,8.000000,12.000000,1,1,F,T,F,F,0,T,F,60,405,A1,F,
INSTRUMENT: ESU0:GLOBEX:2 ID#1 PERIODICITY: 3,60,0 TYPE: 3,2,12 COLORS: 64256,16711680,1,0 [Alias: @ES#]
VAP_FOOTPRINT: 0,0,2,0,9,0,0,100,0,0,0,4672,50,0,0.25,0,0,0,0,0,Arial,0,
SESSION #2. Index Futures: Closed,UnPosted, Hours: 09:30 to 16:15
INDICATOR: PROF #127 ASSOC: ESU0:GLOBEX:2 ID#1 PERIODICITY: 3,60,0 DESC: PROF[ESU0 (60m) 7264,1q] LABEL: T TXTLBL: F,"AUTO",F RECALC: 0,0 PREFS: 128,128,128,1,2,0,0.25,225165264,100,204,0,0,2,2,0,0,255,0,2,2,0,255,255,255,2,2,0,255,0,255,2,2,0,98,7,14011401,F,T,T,F,5,T,T,F,F,1,5,T,F,3652790400,3653028000,8,3,0,0,T,F,500,T,F,F,F,10,0,0,255,2,2,0,0,2,1,0,1,T,F,0,255,0,2,2,0,255,0,0,2,469791792,0,F,F,0,128,255,3,2,0,9,0,F,T,255,16777215,0,0,F,F,50331903,2,0,9934592,65,255,5000,0,0,0,0,3,2,0,0,1,0,1,F,F,F,T,0,0,255,2,2,0,95,T,F,2824,2893.5,F,F,BEP34HL,0,-1,
PRESET: RLINE 3083.75 (PREV POC),#6 DESC: REF[ESU0 (60m) 0] 3083.75 (PREV POC) LABEL: T TXTLBL: F,"AUTO",F RECALC: 3,3 PREFS: 255,128,255,2,2,0,2,3655976400,3083.75,T,F,F,T,F,2,15,0,PREV POC,0,F,512,,0,3103.6897,21.28205,T,F,100BarPctChg,0,1242240,3656052000,F,F,F,0,0,0,0,-0,0,0,0,-2147483648,163,163,163,2,2,0,F,F,1,14011401,12,F,F,0,0,255,1,2,0,33488896,33619712,283816,4.000000,8.000000,12.000000,F,F,2,2,F,F,F,F,50,0,1,0,F,60,0,0,T,F,0,0,30,
INDICATOR: BUTN #94 ASSOC: ESU0:GLOBEX:2 ID#1 PERIODICITY: 3,60,0 DESC: BUTN: PREV POC LABEL: T TXTLBL: F,"",F RECALC: 6,1 PREFS: 21,0,12,134361344,14011401,\0,6,RLINE 3083.75 (PREV POC),2,16711680,PREV POC,2,1,1,30,0,16746632,0,0,0,50331903,117440512,Pivot,10,2,
--INVISIBLE INSTRUMENT: ESU0:GLOBEX:2 PERIODICITY: 10,1,1
- This chart definition references 2 RTL objects (scan/signal/custom indicator)
END Investor/RT CHART DEFINITION for TEST_IB4
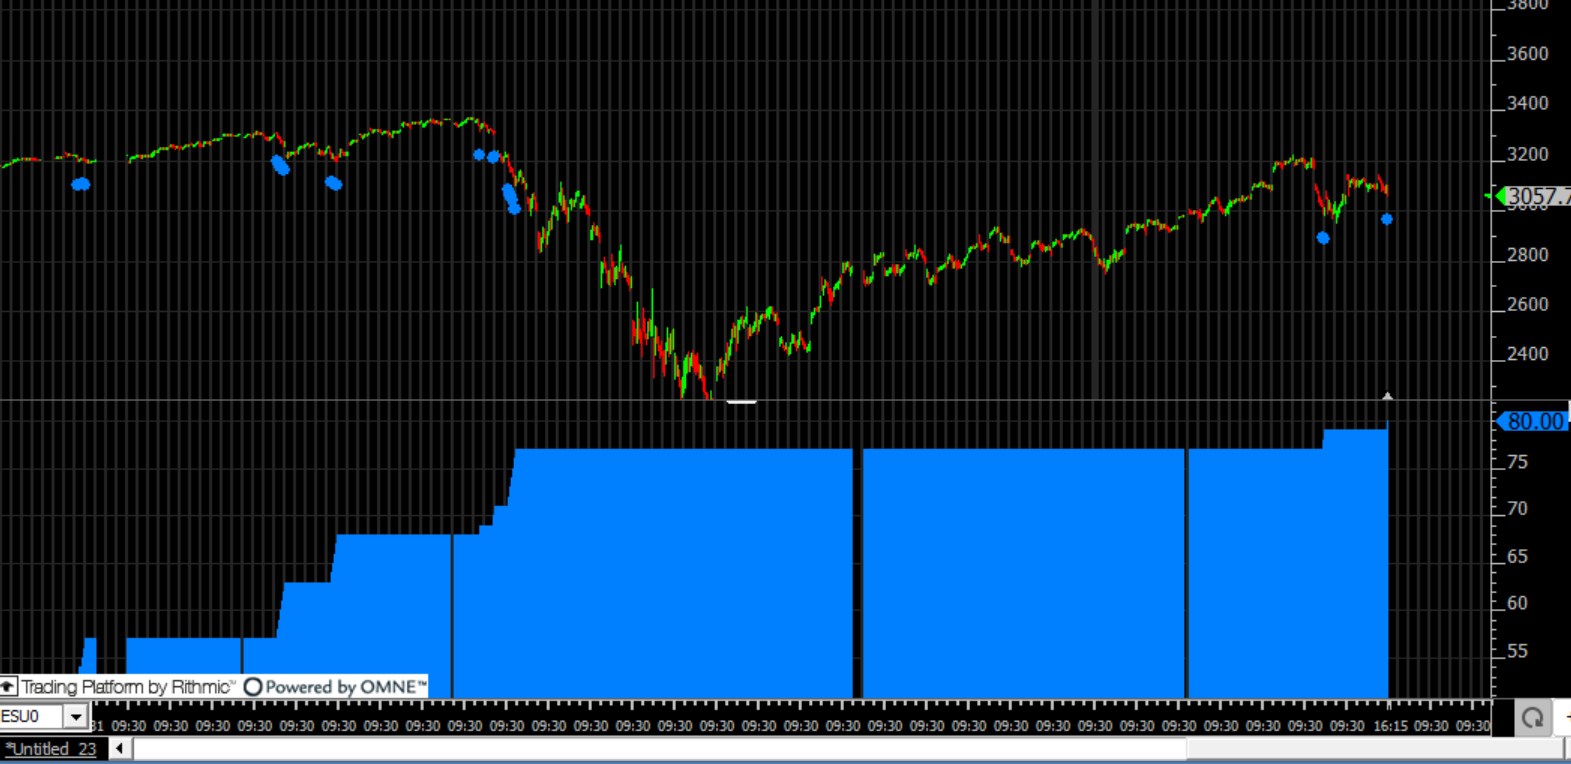
Josh,
I just threw this together for you from scratch. The button at top controls C#1 which I'm using for the IB mutiplier....set to 4 in this chart. Just use button to change the multiple and the rest of the chart will respond. I'm using MPD on a 1d* (daily) chart periodicity (day session) to get the IBL and IBH within the custom indicators used in the lower pane. Let me know if you have any questions. 1975 days studied. 67 closed above the 4xIBH. 66 days closed below the 4xIBH (3.3% of the time).
https://www.linnsoft.com/charts/closerelativetoib-es
Reverse engineering your code. Please correct anything wrong, if you have time.
You used the MPD to capture the IB VS using SESST.
***More important you used a "Day Chart" to capture the daily closing price and used the MPD for the IB***
You used the C# variable to record each Value.
C#1 is used to make the 0.5,0.7 etc into a changeable variable.
IBH%C#1//C#2 This line is placed in "text label", to make the chart calculate the probability and plot it in the chart sub pane. This is done in Signal Statistics.
Info Box:
The infobox is capturing "Always True" Signal and plotted as "Days" because you used a "Daily Chart"
IBLO is a C# value from the Signal Statistics
IBHI is a C# value from the Signal Statistics
My code error:
I was trying to capture the daily close by using a lower time frame chart, which caused the cross of the IB threshold to trigger multiple times.
I used a low time frame chart to capture the data of a high time frame chart V.S using a High Time frame chart to capture the movement of a lower time frame chart.
The above statement is the reason why my syntax fails over and over.
I have been trying to use a lower time frame chart to capture a higher time frame. When I should be using the high time frame chart and using MPD to capture the lower time frame since the Higher time frame chart already contains the data of the lower time frame. Yet the lower time frame does not include the Higher time frames values.
E.G a 15-minute chart made up of High, Low, Open, Close, contains the data for everything below it, however, that time frame doesn't include the High, Low, Open, Close of a 30-min chart,
If I am correct on the example above then that has been my error. And this is why you use MPD so often?
Thanks for your help Chad. I really do appreciate it.
By using the daily periodicity (time per bar: 1 Day) and setting session to day session, you can then access all the key daily tokens of close, open, high and low with tokens CL, OP, HI and LO. And accessing the IBH is pretty easy with MPD and setting it up to grab high of 1st 60m bar of the session as seen below. And also by using the higher timeframe of daily, you have one result per bar which equates to one result per day, which is what you want. And you can just sum up the number of positive (true) results easily with Signal Statistics.