
This forum post will explain how to export the VPOC of various durations (5 days, 20 days, and 90 days) on multiple symbols, to an Excel spreadsheet. And in our example, we will focus on these VPOCs being built from only day session data. And we will be exporting the data when the day session of all symbols is closed.
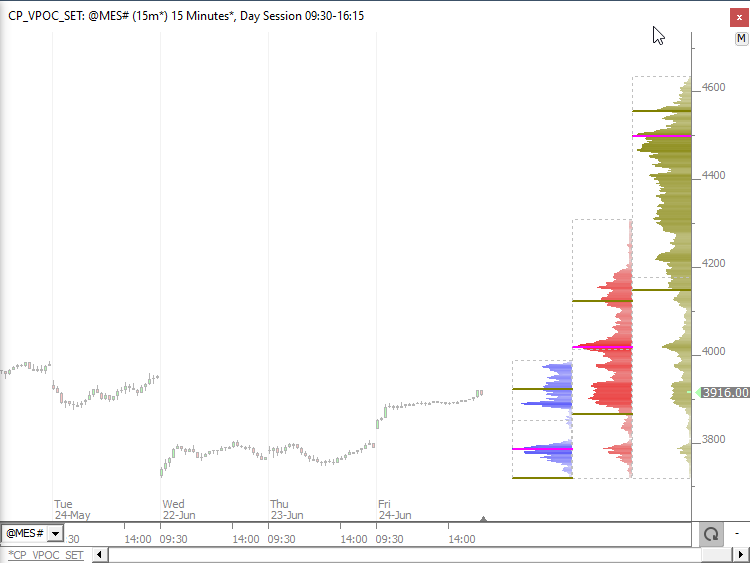
First, we create a chart and put Profile indicators in the chart which compute the 5, 20, and 90 day VPOCs and set them into V# variables (V#30 for 5 day, V#31 for 20 day, and V#32 for 20 day).
Chart Definition: https://www.linnsoft.com/charts/cp-vpoc-set-mes
Blue is 5 day, red is 20 day, gold is 90 day.
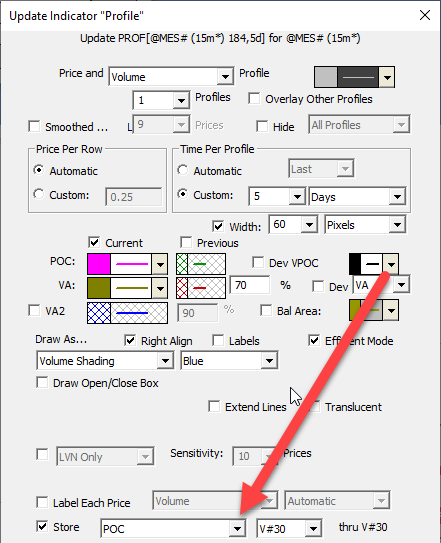
The Profile Indicator are setup as you see below to store the VPOC to V#30. If you need to export other information like VAH/VAL, you may change the Profile indicators accordingly.
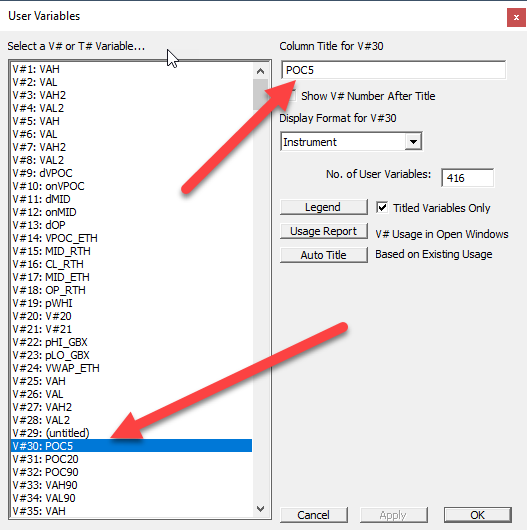
With this chart in place, now we will create a quotepage which contains the symbols we want to export VPOCs for. Also, remove all columns from this quotepage except the Ticker column (just right-click on column heading and "Delete Column" and then add columns for each V# you are exporting (in our example, V#30, V#31, and V#32). Right-click within each V# colum and edit the the column titles to give them appropriate titles like VPOC5, VPOC20, VPOC90, etc as seen below...
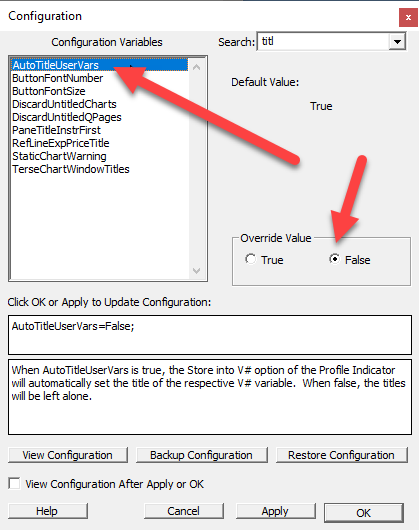
Save your quotepage. Also, set the Configuration variable "AutoTitleUserVars" to false as seen below. This will prevent the Profile indicator from autotitling these V#s to VPOC and we will retain our custom titles.
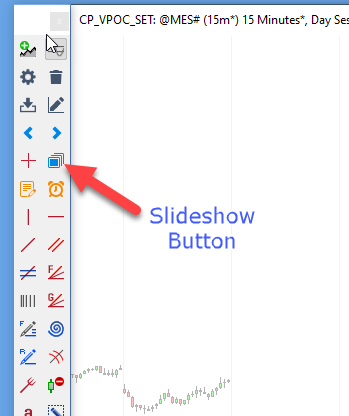
Now go back to your chart, and change the symbol in the chart to the top symbol in your quotepage. Then click the Slideshow button in the chart toolbar...
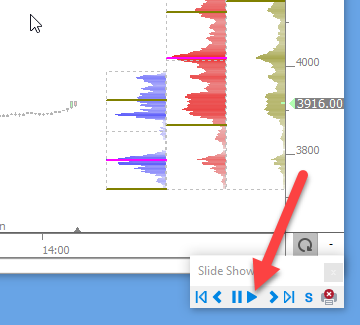
Then click the play button on the Slideshow control...
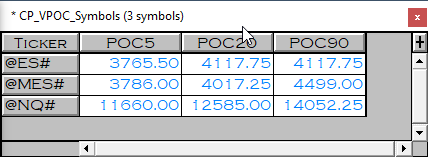
And it will cycle through all the symbols in the quotepage, and in the process, the Profile Indicators will set the 5, 20, and 90 day VPOCs into the V# variables. And the quotepage should update to reflect this.
You would want to perform this operation when the day session of all symbols is closed, and that could be either after market hours in the evening or prior to market opening in the morning.
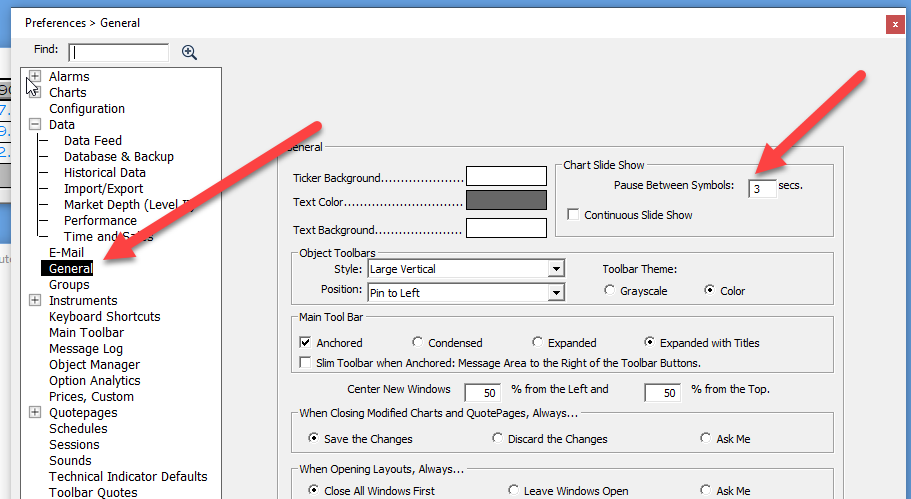
You can adjust the rate that the slideshow players by going to File > Preferences > General...
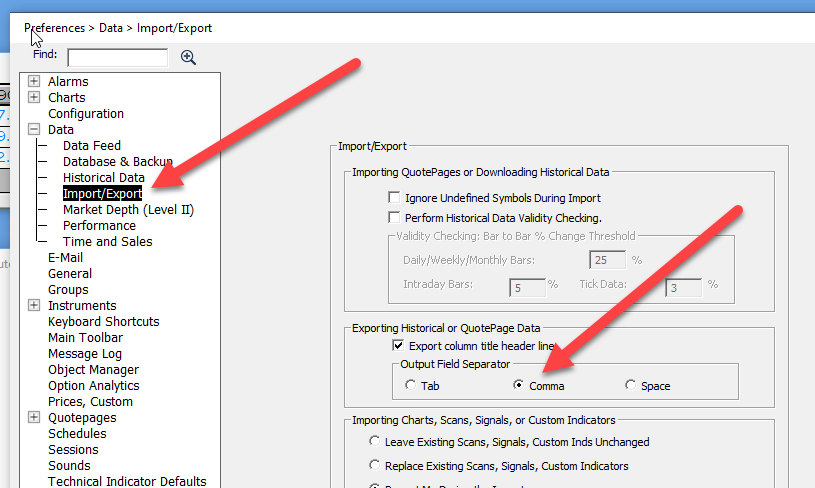
Also while in Preferences, click on Data > Import/Export, and choose to export Quotepage data as Comma separated...
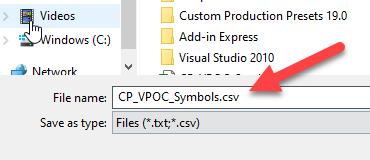
And last, go back and click on the Quotepage and choose File > Save > Save As Text, and then change the .txt extension to .csv as seen below....
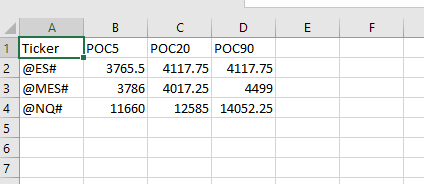
This will result in your Quotepage being exported to a .csv file and then opened automatically in Excel as seen below...
Now, on a day by day basis, all you have to do is run the slideshow (after market) and then Save the Quotepage as Text (changing txt to csv). You may choose to give each export a different name if you want to retain these values historically.
If you have any problems or questions about this process, please respond to this ticket.