This post explains how to paint the candles that have high volume compared to same time period of previous days. More specifically, this chart is going to highlight the bars that have a greater volume (for that 5-min period) than the average volume of that time period over prevoius 10 days.
Chart Definition: https://www.linnsoft.com/charts/cp-bigvolattime-es

This highlighting is based on an underlying signal with syntax...
VO > SESST_VO * C#1 / 100
And with SESST_VO setup as...
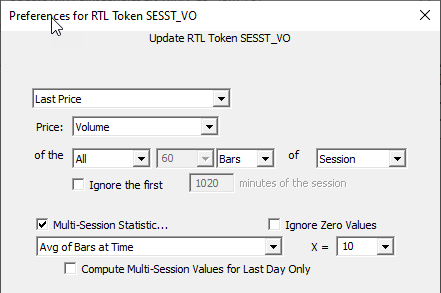
So that C#1 can be set with button at top of the chart. If the value is set to 150, the blue will paint the bars that are 150% or greater of the average volume value for same time period over previous 10 days.
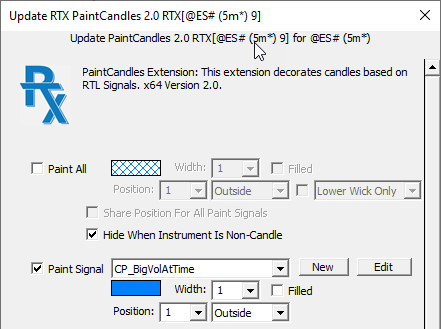
The PaintCandle settings can be seen below...