I am trying to figure out how to SET the C# or V# variable to record the RTX Double Top data. I have created a Signal for RTX and then used the token-->
SET(C#5,RTX)
Is this the correct Syntax to capture this data?
From here I want to calculate the probability of a Local Double Top being broken in the RTH session. This is also where I am getting lost and need help.
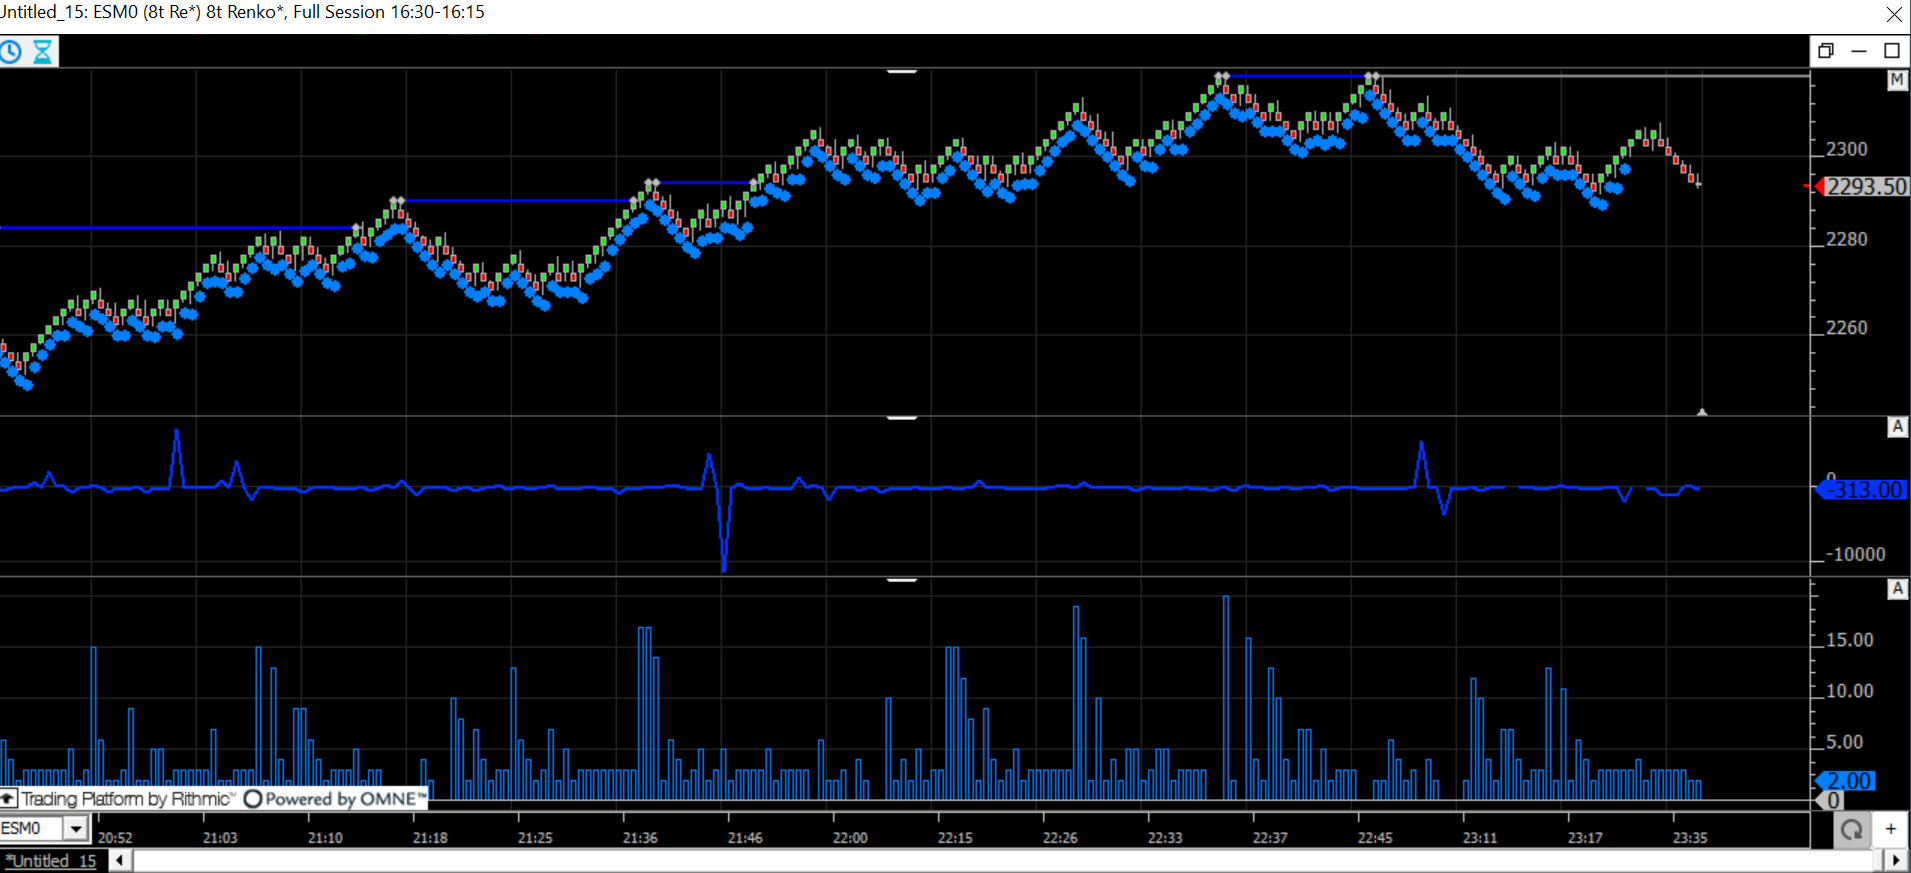
The chart is identifying the double top correctly. When I send the signal to the Signal marker, it turns every bar into a signal. I only want to capture the bars that have broken the double top. Or identify the bars after the signal of a double top has triggered till the double top has broken. Once I have that data, I would like to see how many Double Tops are formed in a trading session? How often those Double tops are broken? The mean pull back for a Double top. How many Double tops are left open during the RTH Session?
This is my first attempt at using the SET method to capture the C# Variables. Any help is greatly appreciated.
You can use the token DTOP for Double Top indicator. To detect the number of double tops...
DTOP = 1
where DTOP is setup with "Double Tops" result.
To detect the double tops that were never broken during session..
(DTOP = 1) AND (HI >= POS)
where POS is setup as "Max High to End of Session"
To detect double tops that WERE broken in remainder of session...
(DTOP = 1) AND (HI < POS)
You'd do something similar for doulbe bottoms if interested.
You can sum these signals up with Signal Statistics indicator.
You can accumulate the per-day values by using MPD on a chart with periodicity of "Time Per Bar: 1 Day" and let MPD sum up all the intraday signals within each day.
Let me know if you need further help putting this together, but give me specifically what data you're lookign for.
Hey Chad- I really appreciate your time.
I added the code that you suggested and I am getting results!!! I have a couple of questions. I do know not how to add the MPD correctly. I did as you suggested but was not sure how to add it to the study? I used MPD ---> 1 day ---> SSTAT:Signal Statistics ---> Indicator Preferences ----> Dbl top Broken ----> Result: Sum of Session Signals(intraday). Doing this did not give any results? So I am assuming, I did this incorrectly?
I am not looking for any data, in particular, the default settings are fine on a 60-minute time frame. I am more interested in being proficient at the software so that I can answer additional questions that I have.
I am absolutely horrible with the info panel - I really need to get better at using this feature. I would like to be able to calculate the values in the info panel similar to how you were able to do so in the Extended Gap Study. It would be really nice to write the Syntax to find the probability and have the chart calculate it for me. Currently, I am opening a calculator and doing it manually.
Thank you for your help and any suggestions you may have to get better are highly welcomed!
The image below should help. Do the best you can, and then if you're still not there, share your chart definition.
Well, I think that I have it set up properly, keyword THINK. I am not getting results for the broken double top. And I am not sure how to find the probability of the results. If you have time and can import the def that would be awesome!! In the meantime, I am going to watch videos on some of the other studies that you have done, to see how you piece the puzzles together.
BEGIN Investor/RT TRADING SIGNAL DEFINITION for DTOP_NAKED
COMMENT=NONE
SOURCE=Joshua Dawson
PLATFORM=Windows 10 (6.2, Build 9200)
DATE=2020-03-24 14:31
VERSION=13.6.15 (Build #33378 Mar 3 2020 14:53:45)
DATAFEED=Rithmic
NAME=DTOP_NAKED
BARCOUNT=AUTOMATIC
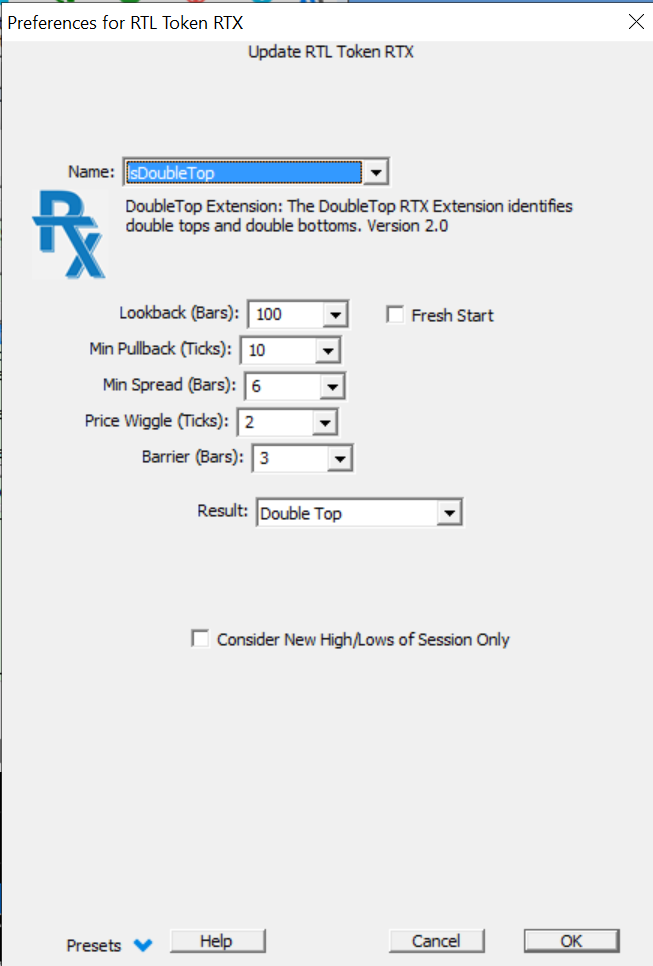
ELEM=DTOP:RT Extension:lsDoubleTop RTX[ ] PREFS: 0,166,0,2,2,0,167,84,84,2,2,0,0,0,0,0,0,0,0,0,0,0,0,0,0,0,0,0,0040255201671168020842150420100001FF,0,0,lsDoubleTop,15391416,1,1,0,0,0,0,0,0,0,0,0,0,10,8,0,2,0,0,0,0,0,0,0,0,0,0,0,
ELEM=HI:High
ELEM=POS:Position Indicator:POS[ ] Result 29 PREFS: 0,101,202,1,2,0,168,0,0,1,0,0,29,10,744744,10,
SIGNAL=(DTOP = 1) AND (HI >= POS)
END Investor/RT TRADING SIGNAL DEFINITION for DTOP_NAKED
BEGIN Investor/RT TRADING SIGNAL DEFINITION for DTOP_BROKEN
COMMENT=NONE
SOURCE=Joshua Dawson
PLATFORM=Windows 10 (6.2, Build 9200)
DATE=2020-03-24 14:31
VERSION=13.6.15 (Build #33378 Mar 3 2020 14:53:45)
DATAFEED=Rithmic
NAME=DTOP_BROKEN
BARCOUNT=AUTOMATIC
ELEM=DTOP:RT Extension:lsDoubleTop RTX[ ] PREFS: 0,166,0,2,2,0,167,84,84,2,2,0,0,0,0,0,0,0,0,0,0,0,0,0,0,0,0,0,0040255201671168020842150420100001FF,0,0,lsDoubleTop,15391416,1,1,0,0,0,0,0,0,0,0,0,0,10,8,0,2,0,0,0,0,0,0,0,0,0,0,0,
ELEM=HI:High
ELEM=POS:Position Indicator:POS[ ] Result 29 PREFS: 0,101,202,1,2,0,168,0,0,1,0,0,29,10,744744,10,
SIGNAL=(DTOP = 1) AND (HI < POS)
END Investor/RT TRADING SIGNAL DEFINITION for DTOP_BROKEN
BEGIN Investor/RT CHART DEFINITION for dbl top study
--
--To Import This Definition:
--1. Select all the text in this file.
--2. COPY to clipboard (Ctrl+C)
--3. Go to Investor/RT and PASTE (Ctrl+V)
--To learn more about importing definitions see www.linnsoft.com/importing.
--
COMMENT=dbl top
SOURCE=Joshua Dawson
PLATFORM=Windows 10 (6.2, Build 9200)
DATE=2020-03-24 14:31
TIMEZONE=Eastern Daylight Time (UTC - 5:00) DST
VERSION=13.6.15 (Build #33378 Mar 3 2020 14:53:45)
DATAFEED=Rithmic + DTNMA ORS=N/A
NAME=dbl top study SIZE=559,1278
PERIODICITY=3,87840,0 (1 Day)
PIXELS=3:0
LOOKAHEAD=0
RMARGIN=67
CFLAGS=786432 CFLAGS2=150017
VIEWPERIOD=1,1,500,3607459200,3667911300 (Last 500 hours)
SUBSESSION=0,30,6
COLORS=12632256,0,5329233,16053492,2434341,11382189,16777215,0,0
DESC=dbl top study: ESM0 (1d) 1 Day, Day Session 09:30-16:15
SESSION OVERRIDE=2 Index Futures: Hours: 09:30 to 16:15
TICKER=ESM0:GLOBEX:31 SECTYPE=3 DISPLAY=12 ALIAS=@ES#
-Tick Data: 120 Days, Intraday: All Data, Daily: 1500 Days
PANE #1 PCT=0.044487 PFLAGS=912 SCALE=1,2060.000000,3480.000000,0.250000,1.000000,0.000000,0,0
INDICATOR: BUTN #94 ASSOC: ESM0:GLOBEX:2 ID#1 PERIODICITY: 3,87840,0 DESC: BUTN: Session Menu LABEL: T TXTLBL: F,"",F RECALC: 0,0 PREFS: 2,1,0,266851872,13011301,0131,3553552,\0,0,16711680,\0,2,0,1,30,0,16746632,117440512,
INDICATOR: BUTN #94 ASSOC: ESM0:GLOBEX:2 ID#1 PERIODICITY: 3,87840,0 DESC: BUTN: Set View Period from Menu LABEL: T TXTLBL: F,"",F RECALC: 0,0 PREFS: 25,1,0,266851648,13011301,1/1/201650 days1 month3 months6 months1 year2 years3 years5 years,3553552,\0,0,16711680,\0,2,0,1,30,0,16746632,117440512,
INDICATOR: BUTN #94 ASSOC: ESM0:GLOBEX:2 ID#1 PERIODICITY: 3,87840,0 DESC: BUTN: Maximize Chart LABEL: T TXTLBL: F,"",F RECALC: 0,0 PREFS: 26,0,0,266852096,13011301,Maximize,3553552,\0,0,16711680,\0,2,0,1,30,0,16746632,117440512,
INDICATOR: BUTN #94 ASSOC: ESM0:GLOBEX:2 ID#1 PERIODICITY: 3,87840,0 DESC: BUTN: Minimize Chart LABEL: T TXTLBL: F,"",F RECALC: 0,0 PREFS: 26,0,0,266852320,13011301,Minimize,3553552,\0,0,16711680,\0,2,0,1,30,0,16746632,117440512,
INDICATOR: BUTN #94 ASSOC: ESM0:GLOBEX:2 ID#1 PERIODICITY: 3,87840,0 DESC: BUTN: Restore Chart LABEL: T TXTLBL: F,"",F RECALC: 0,0 PREFS: 26,0,0,266848064,13011301,Restore,3553552,\0,0,16711680,\0,2,0,1,30,0,16746632,117440512,
PANE #2 PCT=0.202963 PFLAGS=33424 SCALE=16,1901.052609,3738.947391,0.250000,1.000000,0.000000,0,0
INDICATOR: PTBAR #76 ASSOC: ESM0:GLOBEX:2 ID#1 PERIODICITY: 3,87840,0 DESC: Paint Bars: DTOP_NAKED[ESM0 (1d) 2] (DTOP = 1) AND (HI >= POS) LABEL: T TXTLBL: F,"",F RECALC: 0,0 PREFS: 0,0,0,0,0,0,DTOP_NAKED,0,0,0,F,0,0,2,255,255,191,0,0,0,0,255,255,0,0,0,F,F,T,F,F,F,0,F,F,1,-1,12671267,1,2,F,F,\0,0,30,0,
INDICATOR: RTX #111 ASSOC: ESM0:GLOBEX:2 ID#1 PERIODICITY: 3,87840,0 DESC: lsDoubleTop 2.0 RTX[ESM0 (1d) 0] LABEL: T TXTLBL: F,"AUTO",F RECALC: 0,0 PREFS: 0,0,0,0,0,0,0,0,0,0,0,0,0,0,0,0,0,0,0,0,0,0,0,0,0,0,0,0,0040255201671168020167772152010000TF,0,0,lsDoubleTop,12111211,0,0,0,0,0,0,0,0,0,0,0,0,0,0,0,0,0,0,0,0,0,0,0,0,0,0,0,
INSTRUMENT: ESM0:GLOBEX:2 ID#1 PERIODICITY: 3,87840,0 TYPE: 3,2,12 COLORS: 64256,16711680,1,0 [Alias: @ES#]
VAP_FOOTPRINT: 0,0,2,0,9,0,0,100,0,0,0,4672,50,0,0.25,0,0,0,0,0,Arial,0,
SESSION #2. Index Futures: Open,UnPosted, Hours: 09:30 to 16:15
--INVISIBLE INSTRUMENT: ESM0:GLOBEX:2 PERIODICITY: 3,1,1073741824
PANE #3 PCT=0.100580 PFLAGS=528 SCALE=17,66.000000,432.000000,0.000000,0.000000,0.000000,0,0
INDICATOR: MPD #113 ASSOC: ESM0:GLOBEX:2 ID#1 PERIODICITY: 3,87840,0 DESC: MPD[ESM0 (1d) 17] H "mpd broken" LABEL: T TXTLBL: T,"mpd broken",F RECALC: 0,0 PREFS: 0,128,255,2,2,0,18,239,0,1,0,1,13011301,3,1,0,10,3,1,1073741824,F,F,T,T,T,F,51,\0,SIG,010000000000000000000000FF80000044544F505F42524F4B454E000000000000000000000000000000000000000000000000000B000000000000000000000080808009000008000800004E6F20536F756E643E00000000000000000000000000000000000000000000000000000000000000000000000000000000000000000000000000000000000000000000000000000000000000000000000000000000000000000000000000000000000000000000000000000000000000000000000000000000000000000000000000000000000000000000000000000000000000000000000000000000000000000000000000000000000000000000000000000000000000000000000000000000000000000000000002000000DE06C300030000000000000000000000000000000000000000000000000000000000000000000000000000000100000000000100000000000200000000000000000000000000,F,1,T,0,1,F,F,31,3,0,F,F,0,10,100,F,0,1,
PANE #4 PCT=0.145068 PFLAGS=528 SCALE=17,-8.000000,116.000000,0.000000,0.000000,0.000000,0,0
INDICATOR: MPD #113 ASSOC: ESM0:GLOBEX:2 ID#1 PERIODICITY: 3,87840,0 DESC: MPD[ESM0 (1d) 18] H "mpd naked" LABEL: T TXTLBL: T,"mpd naked",F RECALC: 0,0 PREFS: 0,128,255,2,2,0,18,239,0,1,0,1,13011301,3,1,0,10,3,1,1073741824,F,F,T,T,T,F,51,\0,SIG,010000000000000000000000FF80000044544F505F4E414B454400000000000000000000000000000000000000000000000000000B000000000000000000000080808009000008000800004E6F20536F756E643E00000000000000000000000000000000000000000000000000000000000000000000000000000000000000000000000000000000000000000000000000000000000000000000000000000000000000000000000000000000000000000000000000000000000000000000000000000000000000000000000000000000000000000000000000000000000000000000000000000000000000000000000000000000000000000000000000000000000000000000000000000000000000000000000002000000DE06C300030000000000000000000000000000000000000000000000000000000000000000000000000000000100000000000100000000000200000000000000000000000000,F,1,T,0,1,F,F,31,3,0,F,F,0,10,100,F,0,1,
PANE #5 PCT=0.208897 PFLAGS=33296 SCALE=17,-0.010000,0.010000,0.000000,0.000000,0.000000,0,0
INDICATOR: SSTAT #110 ASSOC: ESM0:GLOBEX:2 ID#1 PERIODICITY: 3,87840,0 DESC: SSTAT[ESM0 (1d) 2] 20,DTOP_BROKEN "dbl top broken" LABEL: T TXTLBL: T,"dbl top broken",F RECALC: 0,0 PREFS: 0,128,255,1,0,0,DTOP_BROKEN,0,1,F,F,3,185,0,0,1,0,0,0,20,0,T,13001300,2,1,1,F,F,10,
PANE #6 PCT=0.299807 PFLAGS=528 SCALE=17,13.300000,53.200000,0.000000,0.000000,0.000000,0,0
INDICATOR: SSTAT #110 ASSOC: ESM0:GLOBEX:2 ID#1 PERIODICITY: 3,87840,0 DESC: SSTAT[ESM0 (1d) 0] 20,DTOP_NAKED "dbl top naked" LABEL: T TXTLBL: T,"dbl top naked",F RECALC: 0,0 PREFS: 0,128,255,1,0,0,DTOP_NAKED,0,1,F,F,3,185,0,0,1,0,0,0,20,0,T,13001300,2,1,1,F,F,10,
- This chart definition references 2 RTL objects (scan/signal/custom indicator)
END Investor/RT CHART DEFINITION for dbl top study
When I imported your chart, some of the signals had odd settings for DTOP (see below). Once I fixed that (just changed value to 0) it was fine. Are you seeing same thing on your end?
I do not have that error, sir. I have attached a screenshot to show you how my chart is printing. One thing that is weird is I can't copy and paste directly to the forum, I have to save and upload each file. I have tried Google Chrome and Firefox both browser will not let me paste.
You did not use MPD in the DTOP Broken signal as you did with the 2 above that (that seem to be working fine).
Got that error fixed and removed it. Used the top two indicators to calculate the percentage of naked vs broken stats. Next thing I want to deep dive into is Delta, MPH and pace of trade.
I am going to go back and watch the home work series and other related videos to see how you put everything together. I really appreciate you walking me through this process. I am super stoked about being able to find the data and applying it to trading ideas!