
In this forum topic we will explore specific examples of patterns in volume at price that can be identified, highlighted, and accessed using the Multiple Price Highlighter indicator (MPH). Some examples of how MPH might be used...
- Highlight the Volume Point of Control of the bar.
- Highlight the 3 prices within each bar with the highest volume.
- Highlight the 3 consecutive prices within each bar that have the highest volume of any 3 consecutive prices.
- Highlight buy volume imbalance > 250% with weak side volume at least 25 contracts.
- Plot the sum of the buy volume of the 3 lowest prices in each bar (as histogram and/or text)
- Compute and Plot a ratio of the buy volume of the lowest 2 prices of the bar versus the sell volume of the higest 2 prices in the bar.
- Compute and Plot a ratio of the buy volume of the highest price of the bar to the buy volume of the 2nd highest price in the bar
We will demonstrate how to use MPH to highlight the prices which exhibit these volume patterns by adding MPH directly to the chart. Will will also explore how to access the volume data of the prices identified by MPH and use that data in RTL (signals and custom indicators).
When MPH is added directly to a chart, it is used to identify and highlight the volume-at-price patterns. When the MPH token is used with RTL for signals or custom indicators,
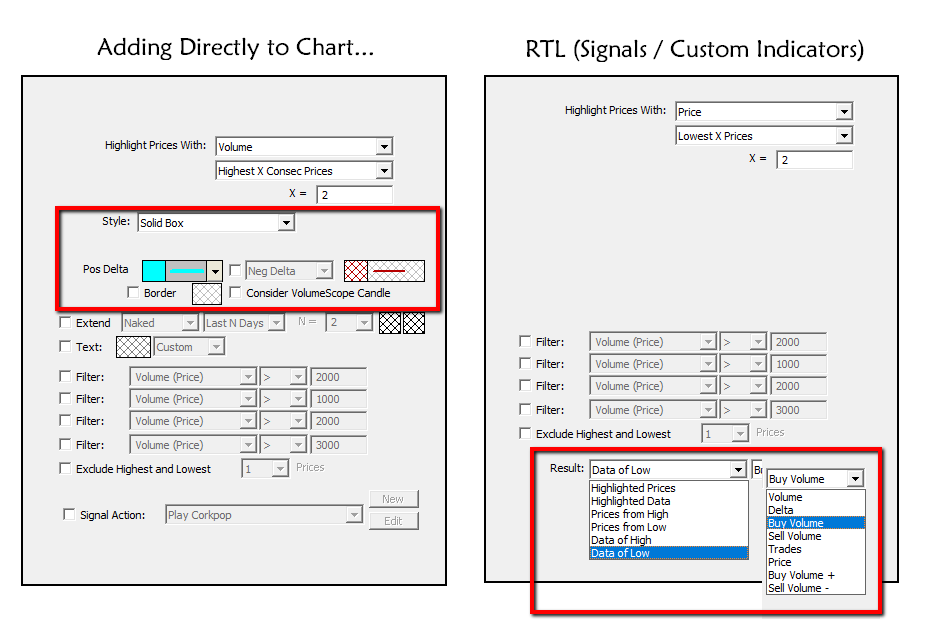
Below, you can see the difference in preferences for the 2 implementations. On the left, when adding directly to a chart, highlighting options are visible with choices such as Solid Box, Hollow Box, Dot, Line, and Text Only along with color and border options. On the right, when using in RTL, the higlighting options are hidden (not relevant) but result options are presented at the bottom to specify what data of the identified prices should be reflected in the MPH token value result.
If you are struggling to find the right settings of MPH to identify a volume at price pattern, let us help you by replying to this topic with details of the pattern you are looking to identify and we will be glad to help.
The MPH setup below demonstrates how to highlight the 3 prices within each bar that have the highest volume. In this implementation, the prices do not need to be sequental (we will get to that in a subsequent post). We've added MPH to a chart that also has the VolumeScope indicator so that we can clearly validate what MPH is highlighting. This setup allows for quick identification of where the heavier volume occurred within each bar. To highlight the VPOC of the bar, simply change X = 3 to X = 1 to focus only on the ONE price within each bar with the highest volume. When using a Solid Box style for MPH as seen below, it's important that you put the MPH behind the VolumeScope. This can be done by right-clicking on MPH and choosing "Send to Back". Once it's in the back, it can be selected by shift-clicking on the boxes. Holding down the shift-key while clicking causes the VolumeScope to be ignored during selection (or double-click) process.
The MPH setup below highlights the 3 consecutive prices within each bar which have more cumulative volume than any other 3 consecutive prices in the bar. This identifies the highest-volume cluster within the bar - a multi-price point of control. Technically, the single-price VPOC may lie complete outside of this 3-price volume cluster, but the 3 consecutive prices, when considered together, make up the highest 3-price voulme cluster in the bar.
This post will take a jump into RTL and introduce a few concepts. The goal is to compute the difference between the buy volume (ask volume) of the top 3 prices of each bar and sell volume (bid volume) of the bottom 3 prices. So we will simply subtract the sell volume of the bottom 3 prices from the ask volume of the top 3 prices. The chart below uses two instances of MPH added directly to chart to visually highlight the buy volume of the top 3 prices and sell volume of the bottom 3 prices. This highlighting is not required for computation of the custom indicator we are about to discuss, it's simply for visual purposes. On the rightmost bar, if you sum up the buy volume of the top 3 prices you get 907. Subtracting the sell volume of bottom 3 prices (228) results in a difference of 679 as seen in the custom indicators label in the lower pane.
The image below show the details of the Custom Indicator (RTL) window.
The syntax is...
MPH_BV_HI - MPH_SV_LO
...when using a single token more than once inside RTL syntax, append an underscore and then any sequence of letters after that to differentiate. In this case, MPH_BV_HI was used for the buy volume of upper 3 prices and MPH_SV_LO was used for the sell volume of the lower 3 prices. The settings for each instance of MPH can be seen below the RTL window. The upper area Highest 3 Prices dictates what prices within each bar we are going to identify. The lower area Highlighted Data > Buy Volume dicatates what data we are going to extract from those prices - in this case, summing up the buying volume of the 3 highest prices.
Hi, not sure if this is better suited for the PriceVolumePattern or the MultiplePriceHighlighter. I'd like to highlight a range of prices per bar, which includes all the available prices between the current and previous values of an indicator. VWAP could be an example. The "body" of the highlighted prices (for the current bar) would be bound by the price of the current vwap and the price of the previous bar's vwap. As i noodle this out it seems something like highlight price <= vwap and price >= vwap.1 and a 2nd one for going the other direction. But i defer to your better judgement.
thank you sir!
It's not easy, but I was able to put what I think you want together using a couple of instances of the Band Indicator.
Import this chart and let me know if it gives you what you're after: https://www.linnsoft.com/charts/vwap-change-bands-es
You'll need to drag both the pink and the blue bands and drop them in another chart.