
The Pivot Strategy Analysis Indicator (PSA) - general documentation and videos can be found by clicking here. And for Pivot Strategy Optimizer (PSO), click here.
I'm creating this topic to handle miscellaneous questions related to these two indicators.
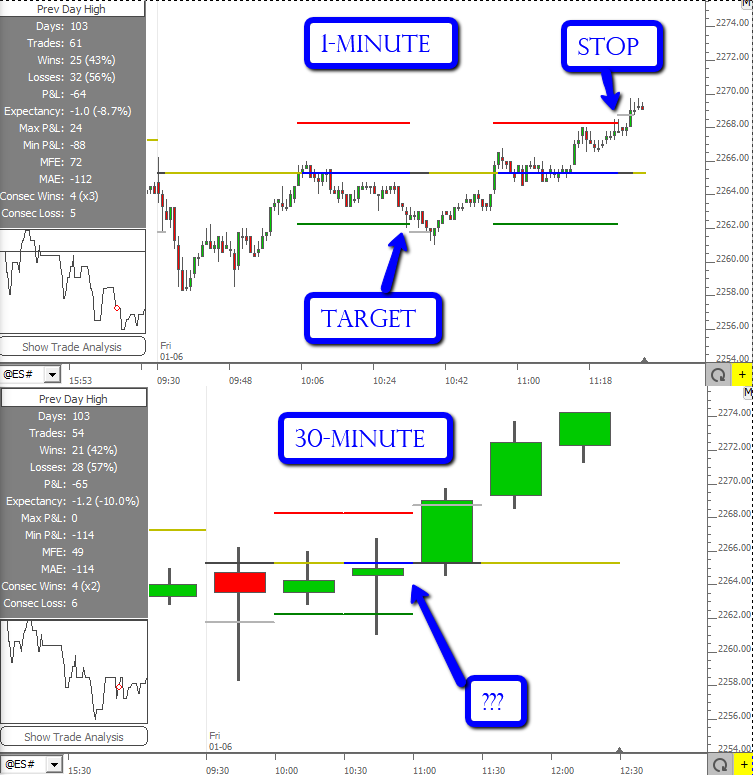
Question: I get different results when testing different periodicities (1minute vs 30minute), why is that?
Answer: Smaller periodiicities (1min) will work much better for PSA and here's why. The PSA indicator operates on the open, high, low, close prices of the bars in the chart. With 1-minute bars, PSA has much more information to go on with respect to the path taken to move from price A to price B. While a 30 minute bar may hit BOTH a target (with the high) and a stop (with the low), the 1-minute bars will almost always clearly identify which one was hit first. So for the 30 min bars, there are situations where PSA has to make a best guess as to which one (stop or target) was hit first. Also, PSA does not get out and then back into a position on the same bar, and therefore subsequent entries are often missed with 30 minute bars that are not missed with 1-minute bars. For these reasons and more, 1-minute bars should be the periodicity of choice for both PSA and PSO. PSA is really all about identifying price movement with respect to your levels, and 1-minute bars just provides much greater granularity than a 5 minute or 30 minute bar. 1-minute data is pretty reliable for telling us what levels were touched and in what sequence. The screenshot below shows pretty clearly why 1-minute data is preferable over 30-minute for PSA.
Question: Can you explain what is meant by "Trades From: Inside"?
Answer: When analyzing daily periods, the "Inside" refers to the side of the session open. So if price opens below your level, then inside would limit to trades from below. If price opens above your level, then inside would limit to trades from above. In other words, the first tick of the day (the open) is always "inside". If price opens below your level and then moves up to your level to trigger a long entry, then continues to your target, the price must then move back through your level and below it by the "reset distance" and then move back up to your level from below/inside, to trigger another trade (assuming you don't have PSA setup to limit to 1 trade per day).
Thanks for the explanation's....I may have some follow up question, so I'll use this thread.
So just some follow up.....I have some settings based on the optimizer that are for a 'Trend' trade & 'Inside' as settings, but the Reset Distance is (minus) -20....I just want to make sure I'm not taking trades incorrectly before I trade it live. If I understand these settings, as you described in your answer about "Inside" it would mean that the market opens below the key level being tested (for a Long lets say), but because the Reset Distance is a minus (-20), it would first cross above it by twenty ticks, then reverse, and break below it, thus triggering a short trade?
Thank you.
No need to make reset distance a negative value. If you want to short from above, then setup to "Trend: From Above" with a reset distance of 20. With this in place, it would require price to first move 20 ticks above you level, then return to the level to enter the short. The reset distance is in place to prevent trades occurring right at the open if we open right at or even beyond our level. You can specify a minimal reset distance of 1 if you want to allow it to open 1 tick away from your level then hit level for entry. The reset distance is also there to require price to move away from your level by that number of ticks in order for subsequent trades to occur (if allowed). Let me know if this addresses your question.
Sometimes the best way to determine if you have the right settings in place, is to just scroll back and reveiw the trades, and make sure they line up with expectations.
Sorry to be a pain....probably easier if you just type in the settings.......So, it's not that I necessarily want to trade from above or below, its just that the optimizer came up with the -20 (minus) setting with great results, try it on your end if you have time and let me know what you think....take the IBHI, Trend, Inside, 16 tick Stop & Target....but the Reset -20
Goes from a very positive expectancy with -20 Reset to a negative expectancy with a +20 Reset, that's why I asked about the Inside setting etc
Is that a bug or is there actually a way to trade it is what I'm trying to figure out?
Thanks
A negative reset distance is not realistic. What that basically allows is an entry when you're already 20 ticks on the positive side of a trade. I'll look into enforcing a positive reset distance in the preferences, but the bottom line is you should not use negative reset distances.
OK makes sense, thanks.
I wanted to backtest the Pivot Point indicator using the PSA, I stored the S & R levels into C# variables but they only test for the previous day even though prior days levels are plotted on the chart, I assume that happens because of the HI.1 and LO.1 or whatever the user is testing, it doesn't access the previous day's.
Is there a way to accomplish this?
Also, is there a way to use C# variables to test something like the Pivot Point calculation itself so instead of Hi+LO+CL/3...it could be (C#1+C#2+C#3/3)? and same for the Hi & Lo calc......ie Average HI vs Average LO of X bars back instead of the pre built HI/LO or HI.1/LO.1 etc?
Thanks
The image below shows how to access a Pivot Point level within a custom indicator. Use the token PVPT. And within PVPT, choose only the level you want. If you want Pivot Point, choose that and unchecked S1, S2, R1, R2, etc. If you want S1 instead, then uncheck Pivot Point and check S1. You could create a separate custom indicator for each level if you wish. I would choose "Use: 1 Day*" to force the daily bars to honor the session (day session). And choose "Plot Historical Levels" so that you get the historical levels that shift each session.
Thanks for the help.
Hello,
In trying to replicate the HW #26 video (https://www.linnsoft.com/videos/homework-26) that uses the daily midpoint as the entry point, I keep getting a "Warning: Undefined custom indicator is included by the cart" error. I utilized Session Statistics ==> Midpoint of Range in order to configure the midpoint custom indicator. I also tried to break down the calculation ((ex: SESST_hod + SESST_lod) / 2) without any luck.
I have tried seemingly more complex methods to configure other custom indicators for PSA and they work fine but I am not sure why the midpoint configuration is causing the error. Can you please share the configuration for the daily midpoint was used for hw#26, or point me in the right direction?
Thank you!
Pages