Market profile sometimes divides buyers and sellers in two groups: responsive and initiative
I think of "responsive" as buying the dip, or selling the rip, or otherwise responding to a move in price up or down. This responsive activity usually reverses price.
"Initiative" is like the breakout or beginning of a trend. It's when a trader enters the market and starts buying everything in sight or hitting all bids. This initiative activity gets price moving in a direction and out of a range/consolidation.
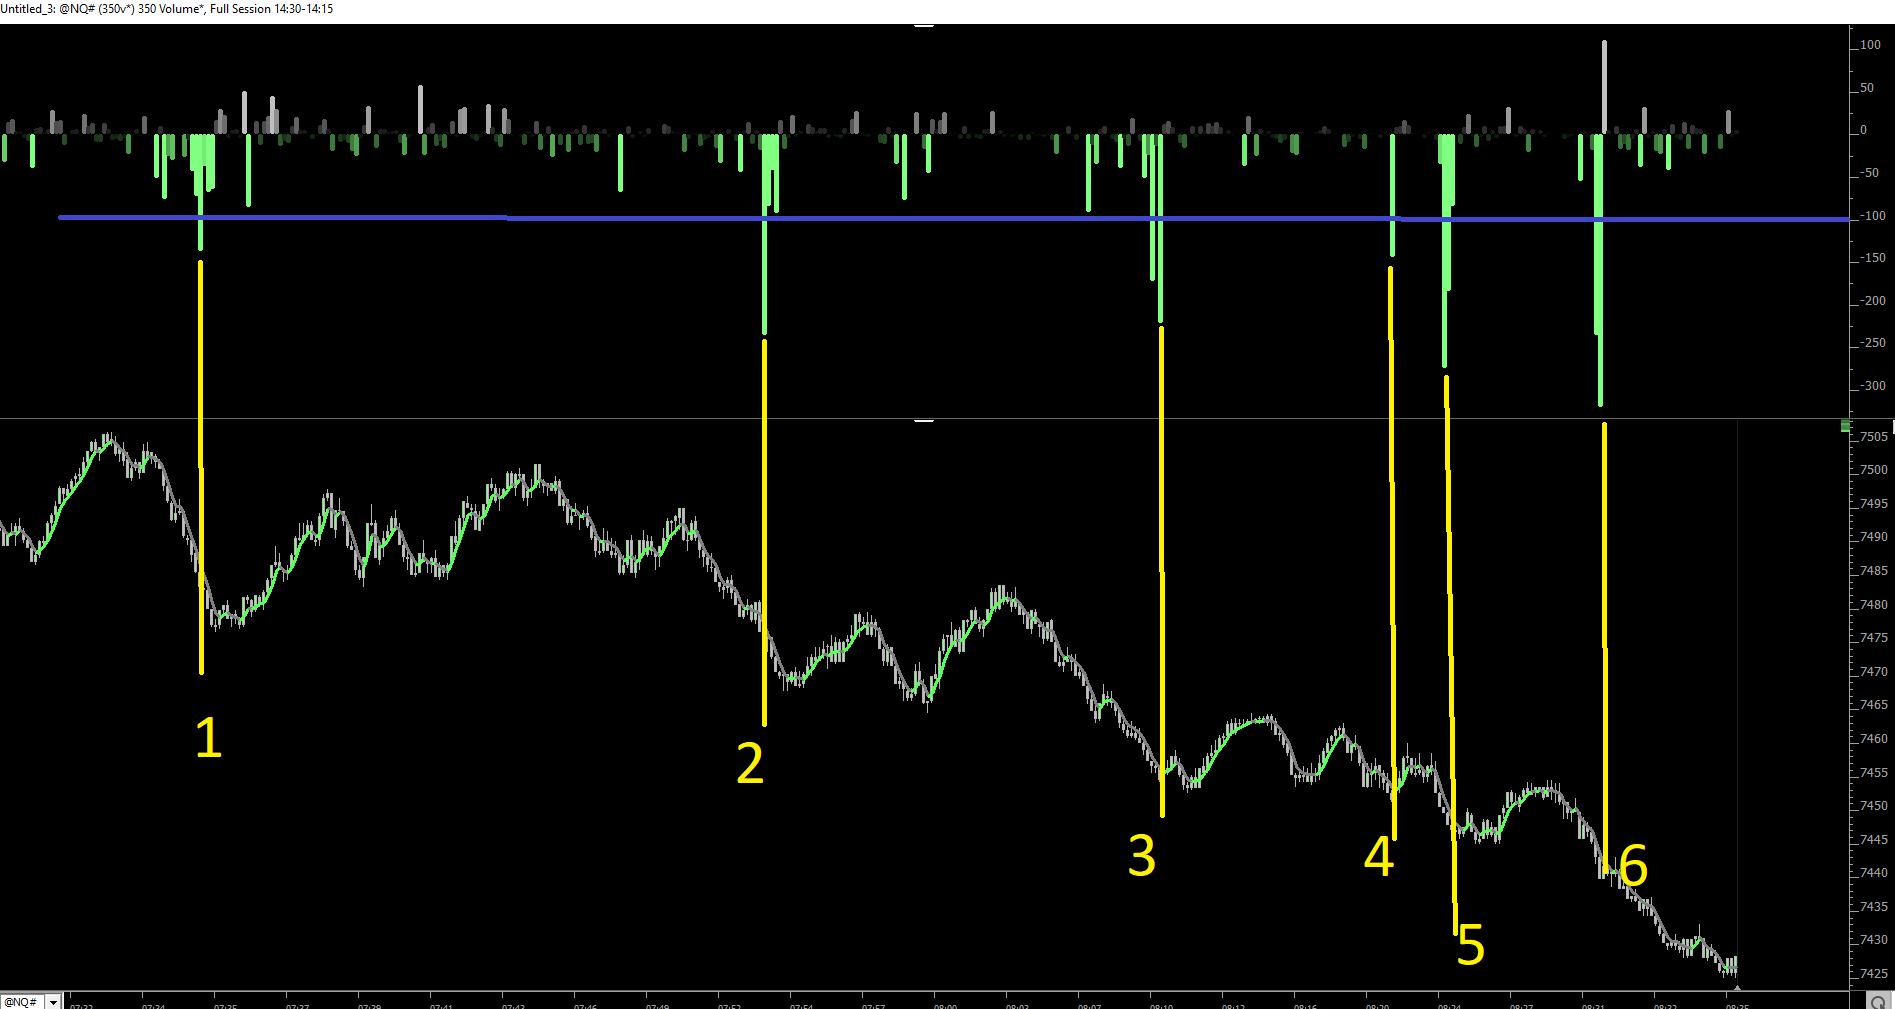
There was an initiative seller in the NQ off the open today, who drove the market down by about 75 points in an hour.
There were responsive buyers the whole way down and these are the HFT traders that the VB: Speed per second indicator can identify.
This initiative seller was bigger than the responsive buyers all the down from about 7500 to about 7425.
But I only know that with the benefit of hindsight.
In real time, this morning's trend down in the NQ shows why you need to be kind of careful with the VB: Speed per second indicator and why I don't use it as a standalone buy and sell indicator.
Clearly the market was moving fast and volume was high and there was LOTs of activity in the VB indicator. I've highlighted the 6 big buying spikes that went lower than -100.
1, 2, and 3 were actually pretty good spots to buy.
4 was probably a loss.
5, meh...maybe a scratch or small profit
6 definitely a loss -- something funky happened there
Each one of those are responsive buyers, responding to price dropping to new lows. You can tell when they show up. It's pretty easy.
It's really hard for me to tell, in real time, that the initiative seller was going to drive the market down by 75. I can't see the initiative seller the same way I can see the responsive buyers.
I think the way you try to identify the initiative seller, and measure whether they are bigger than the responsive buyers, is by defining market mode and if the market is trending, then the initiative seller is still in charge and has more selling to do.
That said, if I had a long-only approach to trading the NQ this morning with other buy signals, and used the responsive buying spikes in the VB indicator, I probably could have made a small profit. But at what mental and opportunity costs? It would've been hard. Had to be super focused. And, I'm missing the bigger profits on the short side, where it's easier, a higher probability, but only because the trend is down, which brings me back to defining market mode.
If I can define trend mode in real time and it's a down trend, then I should be focusing on shorting. From the short side, those responsive buying spikes were pretty good spots to cover, except 4 and 6. On balance, good spots to cover and re-short again.
Lastly, trends tend to occur -- not always, but generally -- in the morning and afternoons, especially when thinking about the U.S. equity market. Remember the time of day when applying this indicator and remember that whether it's a buying or selling spike, try see it from both sides, and apply the information to both sides.
That's a 350 volume chart of the NQ