Investor/RT is a powerful trading platform offering advanced charting and market analytics to professional traders and active investors around the world. Continually refined for more than two decades, Investor/RT's charting and technical analysis tools offers traders a view of the market that second to none.
Visualize the markets your way by choosing from many different chart styles and periodicities such as basic Candlesticks charts, Point and Figure charts, TPO Profile, Range Bars, Change Bars, Volume Bars, Tick-based charts, Renko charts or Heiken Ashi. Advanced volume analysis tools like the profile indicator make it possible to analyze areas of price acceptance and rejection over any time frame. Add a profile to each day or take a macro approach by overlaying an additional composite profile to analyze longer time frame such as weeks, months or even years.
Need to analyze a custom timeframe like a News event or a Fed announcement day? No problem. Just use the profile drawing tool to draw the profile along your area of interest. Or put the market under A microscope by expanding each individual bar with our volume profile chart style. Other tools like the volume breakdown indicator make analyzing buy and sell volume a snap. You can choose to view buy or sell volume separately or just view the difference using the volume delta setting. It's even possible to accumulate the volume delta in a candlestick form to spot keyed divergences that show when aggressive participants may have left the market. You can dig even deeper by choosing volume from trades over or under a certain trait size.
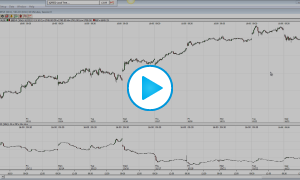
We know that sometimes it's hard to know where the markets going without knowing it's where it's been. The sessions statistics indicator as a powerful tool that shows you just that. It can handle simple tasks such as marking keep price levels like the open hi, low or close of each day, or you can take it a step further by marking price levels of specific parts of the session such as the overnight future session, or even the first hour of the day session also known as the Initial Balance. You can even compare today's indicators with with how that same indicator performed at the same time on previous days.
Here's the volume indicator and I've overlaid the average volume of the last 20 sessions at the exact same time of day to uncover above average market activity during this time of day. To harness the power of these indicators and the other 200+ indicators provided, Investor/RT offers real-time language, a full featured scripting language used to write custom indicator signals and scans. Even easier than easy language, RTL is a robust tokenized scripting language with hundreds of tokens that can can be used to access the price and technical indicator values associated with your trading instruments. Easily create custom technical indicators, scan the market for opportunities, or create buy and sell signals based on predetermined rules. With RTL, the sky is the limit. With all these features and more, it's no wonder that we've been serving traders for over 20 years. Come experience the power of Investor/RT today!