Chad Payne of Linn Software and Bill Duryea of IOAMT discuss tools and strategies for statistical analysis in Investor/RT.
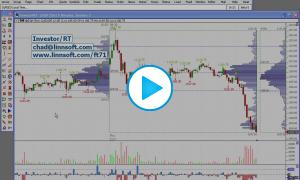
Day Session / IB Range Ratio: In this chart we determined that the average ratio between the Day Session Range and the IB Range was 2.15. And on average, the Day Session Range was 10.38 points larger than the IB Range. These averages were computed on the ES over a 1,000 day period ending 5/12/2011.
Overnight to Day Session: In this chart we determined that out of 1046 sessions, the days session broke out of both the high and low of the overnight session 279 times and stayed completely within the overnight range 44 times.
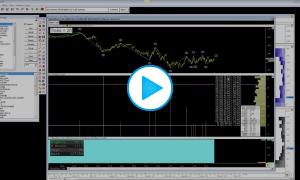
Volume Price Statistics: In this chart we explored the Volume Price Statistics Indicator.
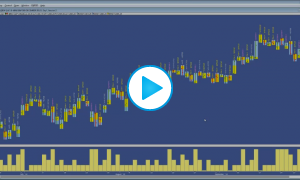
Volume Breakdown: In this chart we explored the Volume Breakdown Indicator.
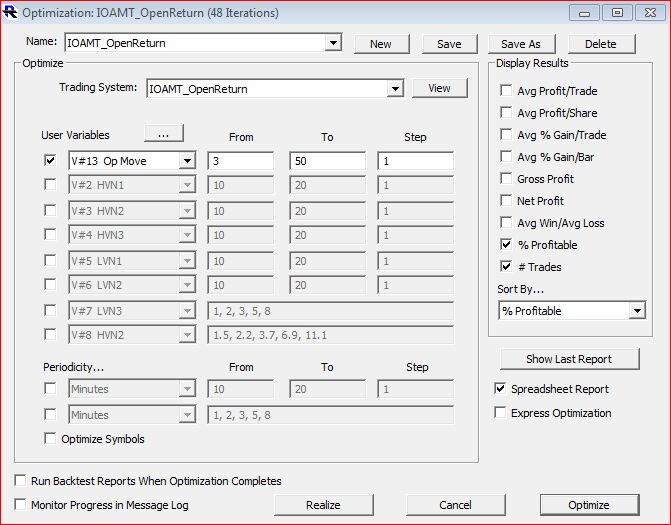
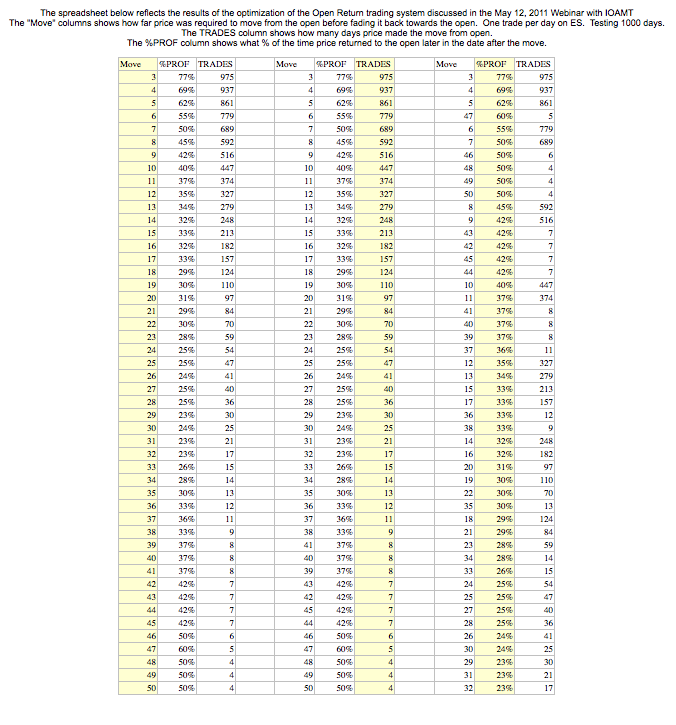
Return to Open: Here is the Trading System Definition for the Return to Open system discussed in the Webinar. Here is a screenshot of the optimization settings used to produce this spreadsheet.